EUROPEAN ORGANISATION FOR NUCLEAR RESEARCH (CERN)
CERN-PH-EP-2012-357
Submitted to: JHEP
Measurement of the cross-section for
W
boson production in
association with
b
-jets in
pp
collisions at
√
s = 7 TeV
with the
ATLAS detector
The ATLAS Collaboration
Abstract
This paper reports a measurement of the W +b-jets production cross-section in proton–proton colli-sions at a centre-of-mass energy of 7 TeV at the LHC. These results are based on data corresponding to an integrated luminosity of 4.6 fb−1, collected with the ATLAS detector. Cross-sections are pre-sented as a function of jet multiplicity and of the transverse momentum of the leading b-jet for both the muon and electron decay modes of the W boson. The W +b-jets cross-section, corrected for all known detector effects, is quoted in a limited kinematic range, using jets reconstructed with the anti-kt
clustering algorithm with transverse momentum above 25 GeV and rapidity within ±2.1. Combining the muon and electron channels, the fiducial cross-section for W +b-jets is measured to be 7.1 ± 0.5 (stat) ± 1.4 (syst) pb, consistent with next-to-leading order QCD calculations within 1.5 standard deviations.
Prepared for submission to JHEP
Measurement of the cross-section for W boson
production in association with b-jets in pp collisions
at
√
s = 7 TeV with the ATLAS detector
ATLAS Collaboration
Abstract: This paper reports a measurement of the W +b-jets production cross-section in proton–proton collisions at a centre-of-mass energy of 7 TeV at the LHC. These results are based on data corresponding to an integrated luminosity of 4.6 fb−1, collected with the ATLAS detector. Cross-sections are presented as a function of jet multiplicity and of the transverse momentum of the leading b-jet for both the muon and electron decay modes of the W boson. The W +b-jets cross-section, corrected for all known detector effects, is quoted in a limited kinematic range, using jets reconstructed with the anti-kt clustering
algorithm with transverse momentum above 25 GeV and rapidity within ±2.1. Combining the muon and electron channels, the fiducial cross-section for W +b-jets is measured to be 7.1 ± 0.5 (stat) ± 1.4 (syst) pb, consistent with next-to-leading order QCD calculations within 1.5 standard deviations.
Contents
1 Introduction 1
2 The ATLAS detector 3
3 Simulated event samples 3
4 Data sample and event selection 4
5 Signal and background estimation 6
5.1 Multijet background 7
5.2 t¯t background 8
5.3 Single-top background 9
5.4 W +jets backgrounds and signal 11
6 Cross-section extraction 12
7 Systematic uncertainties 14
8 Results 17
9 Results without single-top subtraction 23
10 Conclusions 26
1 Introduction
This paper reports a measurement of the cross-section for W boson production in associa-tion with b-quark jets in proton–proton (pp) collisions at √s = 7 TeV. The measurement, performed differentially in the b-jet transverse momentum (pT) for the 1-jet and 2-jet final states, provides an important test of perturbative quantum chromodynamics (QCD) in the presence of heavy quarks.
Next-to-leading-order (NLO) perturbative QCD calculations of the W +b-jets process have recently become available in Monte Carlo (MC) simulations, both at the parton level [1] and enhanced with parton shower models [2,3]. Several processes contribute to W +b-jets production at NLO. In the four-flavour number scheme (4FNS), where only u, d, c, s are considered as initial-state quarks, these are q ¯q → W b¯b(g) and gq → W b¯bq. When considering the presence of b-quarks in the initial state (5FNS), the single b-quark processes bq → W bq(g) and bg → W bq ¯q also play a significant role at LHC energies [4,5]. In addition, double-parton interactions (DPI), in which a W boson and b-jets are produced from different
parton–parton interactions within the same pp collision, are also expected to contribute to the total observed W +b-jets cross-section [6].
The production of W +b-jets events via top-quark decay (from single or pair-produced top-quarks) is not included in the signal definition for the primary measurement. An additional set of measurements is performed including the contribution from single top-quark production. These are of particular relevance for the differential cross-section, since single top-quark and W +b-jets events are difficult to separate and their relative contribution depends strongly on the b-jet transverse momentum.
The W +b-jets process is an important background to the Higgs boson associated-production process W H with H → b¯b decays [7]. The associated-production measurements are a substantial ingredient in determining the coupling of the Higgs boson to fermions, through the decay H → b¯b, and searches in this channel have been included in studies of the Higgs-like boson [8]. The W +b-jets process is also an irreducible background in some searches for physics beyond the Standard Model [9], and in measurements of single top-quark properties [10], due to the dominating branching fraction of the t → W b decay.
Measurements of the W +b-jets fiducial cross-section in proton–antiproton collisions at √s = 1.96 TeV have been reported by the CDF Collaboration [11] and more recently also by the D0 Collaboration [12]. The ATLAS Collaboration reported a previous mea-surement based on 36 pb−1 of data collected in pp collisions at √s = 7 TeV [13]. The CDF measurement of 2.74 ± 0.27 (stat) ± 0.42 (syst) pb, and the ATLAS measurement of 10.2 ± 1.9 (stat) ± 2.6 (syst) pb are both found to be larger than the corresponding theoretical cross-sections calculated at NLO (1.22 ± 0.14 pb and 4.8 ± 1.3 pb) by 2.8 and 1.5 standard deviations, respectively. The D0 measurement of 1.05 ± 0.12 pb is found to be lower than the theoretical prediction of 1.34+0.41−0.34pb [1], but in agreement within theoretical uncertainties.
In this paper, the W +b-jets cross-section is measured using the ATLAS detector1 in a restricted fiducial region defined at the particle level and given in table 1. For the first time, and in the same region, the W +b-jets differential cross-section is also measured as a function of the b-jet pT. To enter the fiducial region, events at the generator level are
required to contain an electron or muon and a neutrino originating from a W boson decay, and one or two hadron-level jets2. At least one of the jets is required to be a b-jet, defined by the presence of a weakly decaying b-hadron with pT > 5 GeV and within ∆R = 0.3 of the jet axis.
At the reconstruction level, events are required to be consistent with the decay of a W boson to the `ν (` = µ, e) final state, and to contain either one or two jets. Events are selected if exactly one jet, which can be a b-jet, but also a mis-tagged c-jet or a light-jet,
1
The ATLAS experiment uses a right-handed coordinate system with its origin at the nominal interaction point (IP) in the centre of the detector and the z-axis along the beam pipe. The x-axis points from the IP to the centre of the LHC ring, and the y-axis points upward. Cylindrical coordinates (r, φ) are used in the transverse plane, φ being the azimuthal angle around the beam pipe. The pseudorapidity is defined in terms of the polar angle θ as η = − ln tan(θ/2) and the rapidity is defined as y = ln[(E + pz)/(E − pz)]/2.
The distance ∆R in η-φ space is defined as ∆R ≡p(∆η)2+ (∆φ)2.
2Hadron-level jets are built from stable particles, i.e. those with a proper lifetime longer than 10 ps.
Table 1. Definition of the phase space for the fiducial region. The W transverse mass is defined as mT(W ) = q 2p` Tp ν T(1 − cos(φ`− φν)). Requirement Cut
Lepton transverse momentum p`T > 25 GeV Lepton pseudorapidity |η`| < 2.5
Neutrino transverse momentum pν
T > 25 GeV
W transverse mass mT(W ) > 60 GeV
Jet transverse momentum pjT > 25 GeV
Jet rapidity |yj| < 2.1
Jet multiplicity n ≤ 2
b-jet multiplicity nb= 1 or nb = 2
Jet-lepton separation ∆R(`, jet) > 0.5
passes the b-tagging requirements. Events with two or more b-tagged jets are rejected, as are events with three or more jets, to reduce the top-quark background. Given the fiducial region definition and the reconstruction-level selection, the measurement is performed using reconstructed events containing a single b-tagged jet, and unfolded to the fiducial region with one or more b-jets. The measurement is performed separately in the W → µν and W → eν decay channels and in the exclusive 1-jet and 2-jet final states.
2 The ATLAS detector
The ATLAS detector [14] is a multi-purpose particle physics detector operating at one of the interaction points of the LHC. It consists of an inner detector tracking system (ID) within a 2 T axial magnetic field provided by a superconducting solenoid, surrounded by electromagnetic and hadronic calorimeters, and by a muon spectrometer (MS) embedded in the magnetic field provided by three air-core superconducting toroidal magnets.
The ID consists of pixel and silicon microstrip detectors surrounded by a transition radiation tracker, and it provides measurements of charged-particle tracks within |η| < 2.5. The calorimeters provide three-dimensional reconstruction of particle showers in the region of |η| < 4.9, with a finely segmented inner layer used for electron identification in |η| < 2.5. They are based on liquid-argon (LAr) sampling technologies, except for the barrel region (|η| < 1.7) of the hadronic calorimeter where scintillator tiles are used as the active media. The MS consists of three layers of high-precision tracking chambers (monitored drift-tubes and cathode strips) in the region |η| < 2.7, and resistive-plate or thin-gap chambers providing trigger signals in the region |η| < 2.4.
3 Simulated event samples
Monte Carlo simulated samples are used to model the reconstructed W +b-jet signal and most of its background contributions, as well as to extract a fiducial cross-section from the measured W +b-jet yield.
The processes of W boson production in association with b-jets, c-jets and light-jets are simulated separately using the Alpgen 2.13 [15] generator, interfaced to Herwig 6.510 [16] for parton showers and hadronization, and Jimmy 4.31 [17] for the underlying-event simu-lation. Exclusive samples with zero to four additional partons and an inclusive sample with five or more additional partons are used. The MLM [18] matching scheme, as implemented in Alpgen, is used to remove overlaps between samples with the same parton multiplicity originating from the matrix element (ME) and the parton shower (PS). In addition, over-lap between samples with heavy-flavour quarks originating from the ME and from the PS is removed. Large samples of dijet events simulated using Pythia 6.423 [19] are used to model the light and heavy-flavour jet properties relevant to the b-jet identification in the W +jets sample.
The Z+jets background is simulated with Alpgen interfaced to Herwig and Jimmy, using the same configuration as for W +jets. The diboson (W W , W Z, ZZ) background is simulated with Herwig. The t-channel, s-channel and W t-channel single-top processes are simulated with AcerMC 3.7 [20] interfaced to Pythia. The t¯t background is simulated
with Powheg [2] interfaced to Pythia.
The total cross-sections of the W +jets and Z+jets samples are normalized to the inclusive NNLO predictions [21], while other backgrounds are normalized to NLO predic-tions [22–24]. The t¯t contribution in the 1-jet and 2-jet analysis regions, and the single-top contribution in the 2-jet analysis region, are estimated from data.
For all the processes modelled, multiple interactions per bunch crossing (pile-up) are ac-counted for by overlaying minimum-bias events simulated with Pythia onto the generated hard process. The detector simulation [25] is based on the Geant4 program [26].
4 Data sample and event selection
The analysis considers data recorded in the year 2011 during periods with stable pp collisions at √s = 7 TeV, and where all relevant parts of the detector were operating normally. The resulting data set corresponds to 4.6 fb−1 of integrated luminosity, with an uncertainty of 3.9% [27,28]. Events were collected using single-muon or single-electron triggers. The pT
threshold of the muon trigger was 18 GeV, while the transverse energy (ET) threshold used for the electron trigger was initially 20 GeV and was later raised to 22 GeV to cope with the increasing LHC instantaneous luminosity.
Candidate W +b-jets events are required to have exactly one high-pT electron or muon,
as well as missing transverse momentum (ETmiss) consistent with a neutrino from a W boson, and one or two reconstructed jets, exactly one of which must be b-tagged. All events must have at least one reconstructed vertex formed by the intersection of at least three tracks with pT > 400 MeV. In events with multiple vertices, the vertex with the largest sum of squared pT of the associated tracks is taken to be the primary hard-scatter vertex (PV).
Requiring events to have exactly one b-tagged jet significantly reduces the top-quark background contribution in the 2-jet analysis region. W +b-jets events with a second b-jet satisfying the fiducial selection represent 10% of the 2-jet fiducial region. Most of these
events have a single b-tagged jet, and they are included in the 2-jet region at the recon-struction level.
Electron candidates are formed by matching clusters found in the electromagnetic calorimeter to tracks reconstructed in the ID in the region of |η| < 2.47 and are required to have ET > 25 GeV. To ensure good containment of electromagnetic showers in the
calorimeter, the transition region 1.37 < |η| < 1.52 between the barrel and the endcaps is excluded. The lateral and transverse shapes of the clusters must be consistent with those of an electromagnetic shower [29]. Muon candidates, reconstructed by combining tracks reconstructed in the ID and the MS, are selected in the region |η| < 2.4, and are required to have pT > 25 GeV. Both the electron ET and the muon pT requirements are chosen to
be on the efficiency plateau for the respective triggers. The selection efficiency of electrons and muons in simulated events, as well as their energy and momentum scale and resolution, are adjusted to reproduce those observed in Z → `` events in data [29–31].
In order to reduce the large background from multijet production, lepton candidates are required to be isolated from neighbouring tracks within ∆R = 0.4 of their direction, as well as from other calorimeter energy depositions, corrected for pile-up contributions, within ∆R = 0.2. In the muon case, the sum of transverse momenta of neighbouring tracks must be less than 2 GeV, while the sum of the calorimeter transverse energies must be less than 1 GeV. In the electron case, these requirements range between 1.35 GeV and 3.15 GeV depending on pT and η in order to yield a constant efficiency across momentum ranges and detector regions. Additionally, leptons are required to be consistent with originating from the PV. Their longitudinal impact parameter (|z0|) with respect to the PV must be smaller
than 10 mm, and the ratio of the transverse impact parameter d0 to its uncertainty (d0 significance) must be smaller than 3 for muons, and 10 for electrons.
Jets are reconstructed from calorimeter energy topological clusters (topoclusters) [32] using the anti-kt algorithm [33] with a radius parameter R = 0.4. They are required to have a transverse momentum greater than 25 GeV, and a rapidity |y| < 2.1 in order for the entire jet to be reconstructed within the tracking region. Jets originating in pile-up interactions are suppressed by requiring that at least 75% of the total transverse momentum of tracks associated with each jet point to the PV. Jets within a distance ∆R = 0.5 of the lepton candidate are removed, and jets arising from detector noise or cosmic rays are also rejected [34].
The jet energy is calibrated to account for the different response of the calorimeters to electrons and hadrons, for energy losses in un-instrumented regions, and for the energy offset introduced by pile-up, by applying jet calibration factors dependent on pT, η [35–37], and pile-up conditions [38]. A residual calibration derived from in-situ techniques is applied to the data to reduce differences between data and Monte Carlo simulation [39,40].
Jets originating from b-quarks are identified using the combination of two b-tagging algorithms. The first one exploits the topology of weak b- and c-hadron decays inside the jet to reconstruct their decay vertices along a common line originating from the PV. The second one uses the impact parameter significance of each track within the jet to determine the likelihood that the jet originates from a b-quark. The properties measured by these two taggers are combined using an artificial neural network to determine a single discriminant
variable (CombNN) [41].
The CombNN variable is used both to select a sample enriched with b-jets, as well as to discriminate between b-jets, c-jets and light-jets within the enriched sample. The working point used for the selection (CombNN > 2.2) corresponds to a b-tagging efficiency of about 40% at low pT, increasing to a plateau of 57% for b-jets of pT above 60 GeV,
with rejection rates of about 10 for c-jets and 1000 for light-jets. In order to reproduce the b-jet, c-jet and light-jet tagging efficiencies measured in data [42–44], event weights in Monte Carlo simulation are scaled as a function of the number of tagged and untagged jets of each flavour and the corresponding pT and η. The CombNN distribution in the b-tagged sample is then used to separate statistically the remaining c-jet and light-jet contributions from the W +b-jets signal.
The measurement of ETmiss in each event is based on an algorithm [45] which performs the vector sum of transverse energies of high-pT objects such as electrons, muons and
jets, and of individually calibrated [46] topological energy clusters [32] not associated with any physics objects. To be consistent with a W boson decay, and to reduce the multijet background, the ETmiss is required to be larger than 25 GeV, and the W boson transverse mass mT(W ) =
q 2p`
TpνT(1 − cos(φ`− φν)) is required to be larger than 60 GeV.
5 Signal and background estimation
Several processes contribute to the overall background for the W +b-jets signal, accounting for more than 85% of the selected sample. Some of the backgrounds, such as single-top, t¯t and multijet, are characterized by rather different kinematics from W +b-jets, but they have real b-jets in their final state and show similar b-tagging response. Others, W +c-jets and W +light-jets, have kinematic properties similar to the signal, but they can be statistically separated by studying the characteristics of b-tagged jets. The remaining backgrounds, diboson (W W and W Z) and Z+jets, contribute less than 5% of the selected sample.
In most cases, backgrounds are estimated directly from data in order to reduce the theoretical uncertainties on their normalization. A sequence of binned maximum likelihood (ML) fits is performed, in which a distribution measured in data is described by a linear combination of templates representing each contributing process. In each fit, the normaliza-tion of the process of interest is allowed to float freely, while some processes are constrained by Gaussian terms in the likelihood3. For a constrained process, the mean of the corre-sponding Gaussian constraint is fixed to the expected number of events, while the width is fixed to the associated uncertainty. This uncertainty is derived either from the results of a previous ML fit or from theoretical uncertainties, depending on the process considered. Pseudo-experiments are used to validate the behaviour and properties of each fit.
The single-top, t¯t and multijet contributions are estimated either in background-enriched control regions or using kinematic distributions directly in the signal regions. The W +b-jets, W +c-jets and W +light-jets contributions are then statistically separated, and the number 3Using log-normal terms to ensure positive normalization yields consistent results with those obtained
of W +b-jets events is extracted, by fitting the CombNN weight distribution of b-tagged jets observed in data in each analysis region. Example templates for the muon 1-jet sample are shown in figure 1. CombNN 3 4 5 6 7 8 9 10 Arbitrary Units 0 0.05 0.1 0.15 0.2 0.25 0.3 W+b W+c W+light ATLAS Simulation
Figure 1. Overlay of the W +b-jets, W +c-jets and W +light-jets CombNN distributions in MC
simulation for b-tagged (CombNN > 2.2) jets in the muon 1-jet analysis region.
5.1 Multijet background
Multijet events from QCD production processes in which one of the jets is either identified as a lepton, or contains a real lepton originating from a heavy-quark decay, can occasionally enter the selected sample. Specific criteria are used to reduce this contamination, such as the lepton identification, isolation and impact parameter, and the ETmiss and mT(W )
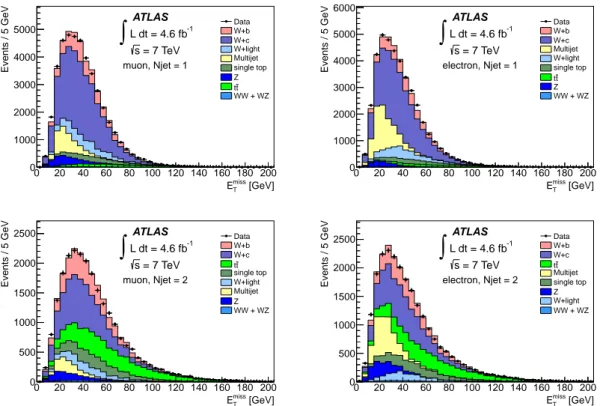
requirements mentioned in section 4. To estimate the remaining multijet contribution, complementary data samples highly enriched in multijet events are created by requiring that some of these criteria are not fulfilled. The normalization of these samples is then obtained by fitting the ETmiss or mT(W ) distributions in data.
Specifically, the multijet background shape for each distribution is obtained in the muon channel by inverting the tracking isolation requirement, and in the electron channel by inverting part of the identification selection and waiving the calorimeter isolation re-quirement. The selection used to form the multijet template from data was studied using dijet Monte Carlo simulations to minimize kinematic biases with respect to the standard signal selection, while maintaining the large number of events required to obtain smooth templates.
The normalization of the multijet template is then assessed, in each analysis region, by performing a fit to the ETmiss distribution in data after relaxing the mT(W ) requirement
from 60 GeV to 40 GeV, and removing the ETmiss > 25 GeV requirement. The templates used in this fit for the W/Z+jets, t¯t, single-top and diboson processes are based on Monte Carlo simulation. The multijet and the W +jets template normalizations are free parameters of the fit to the ETmiss distribution, while those of the other components are fixed to their
expected cross-sections. The ETmiss distributions, normalized to the results of the fit, are presented in figure2 for the 1- and 2-jet regions in the muon and electron channels.
[GeV] miss T E 0 20 40 60 80 100 120 140 160 180 200 Events / 5 GeV 0 1000 2000 3000 4000 5000 DataW+b W+c W+light Multijet single top Z t t WW + WZ ATLAS -1 L dt = 4.6 fb
∫
= 7 TeV s muon, Njet = 1 [GeV] miss T E 0 20 40 60 80 100 120 140 160 180 200 Events / 5 GeV 0 1000 2000 3000 4000 5000 6000 Data W+b W+c Multijet W+light single top t t Z WW + WZ ATLAS -1 L dt = 4.6 fb∫
= 7 TeV s electron, Njet = 1 [GeV] miss T E 0 20 40 60 80 100 120 140 160 180 200 Events / 5 GeV 0 500 1000 1500 2000 2500 Data W+b W+c t t single top W+light Multijet Z WW + WZ ATLAS -1 L dt = 4.6 fb∫
= 7 TeV s muon, Njet = 2 [GeV] miss T E 0 20 40 60 80 100 120 140 160 180 200 Events / 5 GeV 0 500 1000 1500 2000 2500 Data W+b W+c t t Multijet single top Z W+light WW + WZ ATLAS -1 L dt = 4.6 fb∫
= 7 TeV s electron, Njet = 2 Figure 2. EmissT distributions in data and MC simulation in the 1-jet (top) and 2-jet (bottom)
analysis regions, in the muon (left) and electron (right) channels. MC samples are normalized to the results of the multijet background fit. To enhance the multijet contribution in the fitted region,
the mT(W ) selection is loosened from 60 GeV to 40 GeV.
An uncertainty of 50%, applied as a Gaussian constraint in subsequent ML fits, is assigned to the multijet normalization by comparing the ETmiss fit results in each analysis region with the results obtained by fitting the alternative distributions of mT(W ) and lepton pT. In the 4-jet region used to estimate the t¯t background, this uncertainty is estimated
to be 100%. In the differential measurement, the multijet background normalization is extrapolated from the inclusive estimates, and the same 50% uncertainty is applied as an independent Gaussian constraint in each pbT-jet bin.
5.2 t¯t background
The t¯t background is estimated in data by selecting events with at least four jets and exactly one b-tag. A binned ML fit to the CombNN distribution is performed in this control region to extract the t¯t yield. The t¯t Monte Carlo simulation is then used to extrapolate the measured yield into the 1- and 2-jet analysis regions.
In this fit, the sum of the W +b-jets, W +c-jets and W +light-jets MC templates is normalized to the NNLO W inclusive cross-section. Their relative contributions are taken
from the Alpgen Monte Carlo prediction and a Gaussian normalization uncertainty con-straint of 100% is applied to each. Similarly, the single-top template is assigned a 50% constraint that reflects the maximum uncertainty on the single-top normalization discussed in section 5.3. The multijet background is estimated using the technique described in the previous section and assigned a normalization uncertainty constraint of 100%, based on the fits to the alternative distributions. The Z+jets contribution is assigned a 10% normal-ization uncertainty constraint based on theoretical calculations and previous measurements [47, 48]. Finally, the diboson contribution is assigned a 10% normalization uncertainty constraint, which is twice the uncertainty of the corresponding NLO predictions [49,50].
The correction factors to the t¯t Monte Carlo normalization estimated by the fit in the “at least 4 jets 1-b-tag” region are 1.09 ± 0.06 for the muon channel and 1.08 ± 0.07 for the electron channel. These factors are in good agreement with those resulting from alternative fits to the “3-jet 1-b-tag” region, and with those resulting from a fit of the number-of-jets distribution in the “at least 1 jet 1-b-tag” and the “at least 4 jets 1-b-tag” regions. The fit projections corresponding to the CombNN distribution in the “at least 4 jets 1-b-tag” region and to the number-of-jets distribution in the “at least 1 jet 1-b-tag” are shown in figure3. As a result, a 10% t¯t normalization uncertainty is applied as a Gaussian constraint in subsequent fits.
5.3 Single-top background
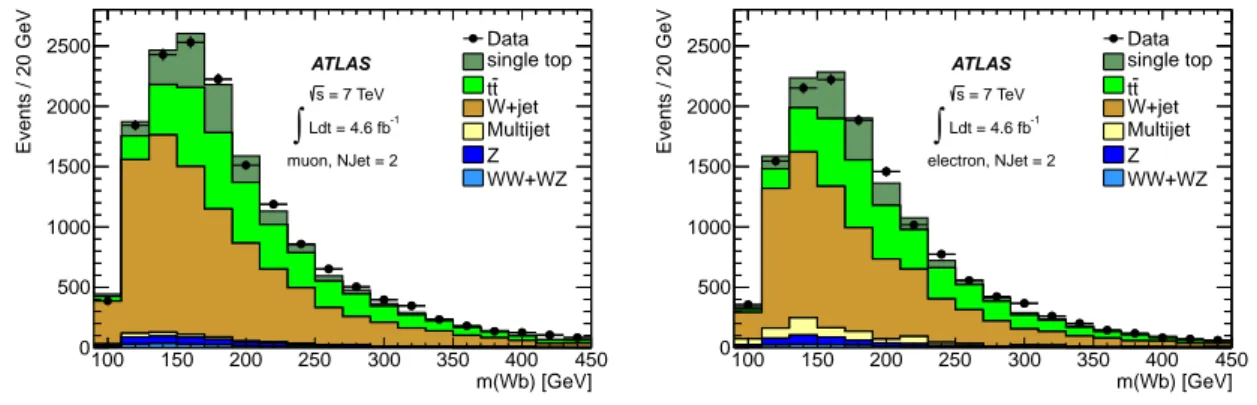
Single-top events containing a W boson and at least one b-jet are, like t¯t events, an ir-reducible background for the W +b-jets signal. In the 2-jet region, where the single-top and W +b-jets contributions are comparable, kinematic observables are used to estimate the single-top normalization in data. The invariant mass of the combined W boson and b-tagged jet system is computed for each event4, and the resulting m(W b) distribution,
where single-top appears as a relatively narrow peak, is fitted. Example templates for the muon 2-jet sample are shown in figure4.
The W +jets and single-top template normalizations are free parameters of the fit. Gaussian constraints are applied to the multijet, t¯t, Z+jets, and diboson backgrounds as described above. The single-top correction factors estimated by the fit in the electron and muon channel are, respectively, 1.13 ± 0.15 and 1.09 ± 0.13, and the corresponding fit projections are shown in figure5.
These estimates of the single-top background contribution are verified with a fit to the HT= p`T+ETmiss+
n
P
i=1
pjeti
T distribution, where single-top events are expected, on average, to
be harder than W +jets events. The corresponding single-top correction factors (1.17 ± 0.17 and 1.12 ± 0.11 for the electron and muon channels, respectively) are consistent with those obtained from the m(W b) fit. The m(W b)-derived factors are therefore used to scale the AcerMC single-top prediction in the 2-jet region, and a 20% uncertainty is assigned to its normalization and applied as a Gaussian constraint in subsequent ML fits.
4The p
z of the neutrino is computed by setting the W mass equal to the world average value of
CombNN 3 4 5 6 7 8 9 10
Events / Unit of CombNN
0 500 1000 1500 2000 2500 3000 Data single top t t W+b W+c W+light Multijet Z WW+WZ ATLAS 4 ≥ muon, NJet -1 Ldt = 4.6 fb
∫
s = 7 TeV CombNN 3 4 5 6 7 8 9 10Events / Unit of CombNN
0 500 1000 1500 2000 2500 3000 Data single top t t W+b W+c W+light Multijet Z WW+WZ ATLAS 4 ≥ electron, NJet -1 Ldt = 4.6 fb
∫
s = 7 TeV Number of Jets 0 1 2 3 4 5 6 7 8 9 Events 0 5000 10000 15000 20000 25000 Data single top t t W+b W+c W+light Multijet Z WW+WZ ATLAS 1 ≥ muon, NJet -1 Ldt = 4.6 fb∫
s = 7 TeV Number of Jets 0 1 2 3 4 5 6 7 8 9 Events 0 2000 4000 6000 8000 10000 12000 14000 16000 18000 20000 22000 Data single top t t W+b W+c W+light Multijet Z WW+WZ ATLAS 1 ≥ electron, NJet -1 Ldt = 4.6 fb∫
s = 7 TeVFigure 3. CombNN distributions for the b-tagged (CombNN > 2.2) jet in the “at least 4 jets
1-b-tag” control region (top) and number-of-jets distributions in the “at least 1 jet 1-b-tag” region (bottom) in data and MC simulation. The muon (electron) channel is shown on the left (right). MC samples are normalized to the results of the respective ML fits.
m(Wb) [GeV] 100 150 200 250 300 350 400 450 Arbitrary Units 0 0.05 0.1 0.15 0.2 0.25 single top t t W+jet ATLAS Simulation
Figure 4. Overlay of the W +jets, t¯t and single-top m(W b) distributions in MC simulation in the
In the 1-jet region, where the expected single-top contribution is approximately half the size of the expected W +b-jets signal, the AcerMC prediction is used, and a large nor-malization uncertainty (50%) is assigned. This uncertainty reflects the difference observed in the single-top contribution estimated by the fit to the m(W b) distribution and the fit to the HT distribution in this analysis region.
m(Wb) [GeV] 100 150 200 250 300 350 400 450 Events / 20 GeV 0 500 1000 1500 2000 2500 Data single top t t W+jet Multijet Z WW+WZ ATLAS muon, NJet = 2 -1 Ldt = 4.6 fb
∫
s = 7 TeV m(Wb) [GeV] 100 150 200 250 300 350 400 450 Events / 20 GeV 0 500 1000 1500 2000 2500 Data single top t t W+jet Multijet Z WW+WZ ATLAS electron, NJet = 2 -1 Ldt = 4.6 fb∫
s = 7 TeVFigure 5. Distributions of m(W b) in the 2-jet region in data and MC simulation for the muon (left) and electron (right) channels. The MC samples are normalized to the results of the respective ML fits.
5.4 W +jets backgrounds and signal
The different response of b-jets, c-jets, and light-jets to the CombNN b-tagging algorithm is used to separate statistically the W +b-jets component from the W +c-jets and W +light-jets ones in each analysis region. The W +b-jets, W +c-jets and W +light-jets normalizations are free parameters of the fit, while Gaussian constraints are applied to all other processes. In addition to the uncertainties discussed above for the multijet, t¯t and single-top backgrounds, 10% Gaussian constraints are assigned to the diboson and Z+jets backgrounds as discussed previously.
The CombNN templates for the multijet component are extracted from data, while those from the other non-W processes are extracted from the respective MC samples. For W +b-jets, W +c-jets and W +light-jets, the corresponding templates are prepared in each analysis region using large Pythia-generated samples.
The CombNN distributions normalized to the fit results are shown in figure6, and the number of W +b-jets and background events estimated by the fits, along with their statistical uncertainties, are summarized in table 2. Table 3 shows the correction factors estimated by the fit to the data compared to the prediction for each process. While the electron and the muon sample backgrounds are treated as completely uncorrelated, the estimated background levels are found to be in good agreement across the channels. The behavior observed in the Z+jets background prediction in table2, when comparing the electron and muon channels in the 1-jet and 2-jet regions, is due to the different properties of Z → ee and Z → µµ events in which one lepton is not reconstructed. In particular, Z → ee events tend to have a higher number of jets (from the missing electron), while Z → µµ events
tend to have higher ETmiss (from the missing muon). The W +light-jets estimate does not strongly affect the measured W +b-jets cross-section, as the W +light-jets and W +b-jets estimators have a 15% correlation. Instead, the W +light-jets and W +c-jets estimators are 90% anticorrelated, and a modest change in the dominant W +c-jets contribution can change the W +light-jets estimate significantly.
In the differential pbT-jet measurement, a separate fit to the CombNN distribution is performed in each analysis region in four intervals of b-tagged jet pT: 25–30 GeV, 30–
40 GeV, 40–60 GeV and 60–140 GeV. The background contributions are extrapolated to each pT interval from the inclusive measurements, and the same Gaussian constraints as those of the inclusive fits are used. For the multijet background, this extrapolation is based on the b-tagged jet pT spectrum found in the multijet templates extracted from data. For all other backgrounds, the extrapolation is based on Monte Carlo simulation.
CombNN 3 4 5 6 7 8 9 10
Events / 0.5 Units of CombNN
0 1000 2000 3000 4000 5000 Data W+b W+c W+light single top t t Multijet Z WW+WZ ATLAS muon, NJet = 1 -1 Ldt = 4.6 fb
∫
s = 7 TeV CombNN 3 4 5 6 7 8 9 10Events / 0.5 Units of CombNN
0 1000 2000 3000 4000 5000 Data W+b W+c W+light single top t t Multijet Z WW+WZ ATLAS electron, NJet = 1 -1 Ldt = 4.6 fb
∫
s = 7 TeV CombNN 3 4 5 6 7 8 9 10Events / 0.5 Units of CombNN
0 500 1000 1500 2000 2500 Data W+b W+c W+light single top t t Multijet Z WW+WZ ATLAS muon, NJet = 2 -1 Ldt = 4.6 fb
∫
= 7 TeV s CombNN 3 4 5 6 7 8 9 10Events / 0.5 Units of CombNN
0 500 1000 1500 2000 2500 Data W+b W+c W+light single top t t Multijet Z WW+WZ ATLAS electron, NJet = 2 -1 Ldt = 4.6 fb
∫
= 7 TeV sFigure 6. CombNN distributions for the b-tagged jet in data and MC simulation, where the MC samples are normalized to the results of the ML fit, for the 1-jet (top) and 2-jet (bottom) analysis regions, in the muon (left) and electron (right) channels.
6 Cross-section extraction
The W +b-jets yields obtained from the CombNN fits are converted to a fiducial cross-section for W +b-jets times the branching ratio for each W → `ν decay channel (` = e, µ) using Monte Carlo simulation. The unfolding procedure is defined with respect to the fiducial
Process µ 1-jet e 1-jet µ 2-jet e 2-jet W +b-jets 5300 ± 400 4800 ± 400 3000 ± 260 2220 ± 250 W +c-jets 15600 ± 600 13300 ± 500 4600 ± 400 4000 ± 400 W +light-jets 1600 ± 500 500 ± 500 1170 ± 330 490 ± 320 t¯t 1230 ± 120 1100 ± 110 4300 ± 400 3690 ± 350 Single-top 1700 ± 500 1400 ± 500 2300 ± 400 1810 ± 350 Diboson 181 ± 18 139 ± 14 185 ± 18 155 ± 15 Z+jets 770 ± 70 258 ± 26 397 ± 40 365 ± 37 Multijet 780 ± 330 1000 ± 500 210 ± 150 1220 ± 290
Table 2. Estimated event yields for the eight contributions to the four analysis regions, including the statistical uncertainty from the binned ML fit.
Process µ 1-jet e 1-jet µ 2-jet e 2-jet
W +b-jets 1.68 ± 0.14 1.98 ± 0.16 1.14 ± 0.10 1.16 ± 0.13 W +c-jets 1.22 ± 0.04 1.30 ± 0.05 1.04 ± 0.09 1.10 ± 0.10 W +light-jets 0.70 ± 0.22 0.28 ± 0.25 1.15 ± 0.33 0.67 ± 0.44 t¯t 1.00 ± 0.10 1.00 ± 0.10 1.02 ± 0.10 1.01 ± 0.10 Single-top 1.07 ± 0.34 1.02 ± 0.36 1.08 ± 0.19 1.01 ± 0.19 Diboson 1.00 ± 0.10 1.00 ± 0.10 1.00 ± 0.10 1.00 ± 0.10 Z+jets 1.00 ± 0.10 1.00 ± 0.10 1.00 ± 0.10 1.00 ± 0.10 Multijet 1.12 ± 0.47 0.80 ± 0.40 0.67 ± 0.49 1.79 ± 0.42
Table 3. Correction factors estimated by the binned ML fit to the CombNN distribution for each
process in the four analysis regions, including the statistical uncertainty. The multijet, t¯t and 2-jet
single-top factors are given with respect to their estimate in data. The remaining factors are given with respect to the Monte Carlo expectations normalized to the NLO (single-top, diboson) and inclusive NNLO (W/Z+jets) cross-sections.
region introduced in table 1. It accounts for trigger and object reconstruction efficiencies (including the b-jet identification efficiency) after applying corrections for all known detector effects. The small contribution (less than 5%) from W → τ ν, where the τ decays to an electron or a muon, is not included in the fiducial region.
The Alpgen Monte Carlo simulation is used to produce correction factors to account for two effects: events passing the fiducial selection which fail the reconstructed-level selec-tion, and events which pass the reconstructed-level selection but originate from outside the fiducial region. These factors are applied to the inclusive W +b-jets yield in each analysis region to obtain a fiducial cross-section.
The differential W +b-jets cross-section is also extracted, in the 1-jet and 2-jet regions, as a function of the transverse momentum of the leading b-jet, pbT-jet, using the same bins as the CombNN differential fits. The measured quantity is therefore dσfiducial/dpbT-jet. For
this measurement, the correction factors mentioned above are produced in each pbT-jet bin. Alpgen Monte Carlo events which pass both reconstruction and fiducial selections are
used to generate a response matrix to account for bin-to-bin migration effects between the reconstructed and generator-level distributions of pbT-jet. This response matrix is applied through an iterative Bayesian technique [52], in which the MC prediction is used as the initial prior, and three successive iterations are performed to remove the bias from the initial distribution.
The stability of the unfolding procedure is tested by comparing the unfolded spectra after three iterations with those obtained using two and four iterations, yielding consistent results. The bias introduced by the choice of prior is tested by creating an alternative sample, and unfolding it using the nominal response matrix; after three iterations, the unfolded distribution is significantly different from the nominal initial prior, and reproduces correctly the alternative generated distribution.
Different jet bins and lepton flavour channels are combined to yield more precise mea-surements of the W +b-jets cross-section. In order not to introduce new assumptions on the background normalizations, the W +b-jets yields are added after the CombNN fit, and their sum is unfolded using correction factors and response matrices obtained from Monte Carlo simulated events in the combined channels. This procedure is performed for each system-atic variation and, in order to take into account the correlation of systemsystem-atic uncertainties, correlated uncertainties are varied simultaneously in the samples being combined.
7 Systematic uncertainties
Several sources of systematic uncertainties on the measured W +b-jets cross-section are considered. Each source may affect the background estimation in the control regions, the results of the CombNN fits, and the unfolding factors and response matrices. The strategy described here is used in all the jet multiplicity regions and b-jet pT intervals.
The effect of each systematic source on the estimated number of W +b-jets events is quantified using pseudo-experiments. For a given systematic variation, new sets of signal and background templates are prepared which may differ in both shape and normalization from the reference set used in the fit to data. The modified templates are used to gen-erate data samples that are fitted using the reference templates. In these pseudo-experiments, the same background constraints as those used in the fit to data are applied. Finally, the quoted fractional systematic uncertainty associated with a given source is de-fined as the ratio ( ¯Nfit− µgen) / µgen, where ¯Nfitis the mean of the estimator of the number
of W +b-jets events and µgen is the number of W +b-jets events used in the pseudo-data
generation for that particular systematic source.
The full analysis procedure is repeated for each systematic variation: the multijet, t¯t and single-top contributions are estimated in the corresponding control sample or distribu-tion, and the CombNN distribution is fitted in the analysis regions after propagating the new background estimates.
Systematic uncertainties in the unfolding process are accounted for by using each sys-tematically varied signal Monte Carlo sample to generate an alternative response matrix and set of unfolding factors. The difference in fiducial cross-section obtained when using the alternative Monte Carlo in place of the default one is quoted as the systematic
un-certainty in the measurement. For systematic uncertainties that are split into an upwards and downwards variation, the unfolding is performed twice, and only the largest of the two resulting variations is taken as a symmetric uncertainty.
Most of the systematic effects considered here influence both the fitting and unfold-ing steps. In these cases, the systematic effects are propagated coherently and for a given systematic source the corresponding estimated W +b-jets yields are unfolded using the cor-responding response matrix.
Background normalizations (multijet, t¯t, single-top, diboson and Z+jets) are treated as nuisance parameters of the ML fit to the CombNN distribution. As such, background normalization uncertainties are accounted for in the uncertainty on the number of W +b-jets events estimated by the fit. In the unfolding, the statistical uncertainty of the fiducial cross-section is evaluated using pseudo-experiments based on the uncertainty on the number of W +b-jets events estimated by the fit. For reference, if the background normalizations are fixed and the corresponding nuisance parameters are removed, the uncertainty on the number of W +b-jets events decreases by almost a factor of two.
The following effects are found to be non-negligible for the cross-section measurements: Jet energy scale and resolution. The uncertainty on the jet energy scale (JES) is derived from data and from Monte Carlo simulation [35–40], and varies between 3% and 14% depending on the jet pT and pseudorapidity. This uncertainty includes effects arising
from the dependence of the jet response on the pile-up. It also accounts for differences between the calorimeter responses to light-quark-, gluon-, and heavy-quark-initiated jets, and for additional low-momentum jets found within ∆R = 0.8 of each jet considered. Uncertainties related to the jet energy resolution (JER) are derived from the jet response asymmetry measured in dijet events in data [35,37].
The effects of the JES and JER uncertainties are quantified using alternative signal and background Monte Carlo templates in which the jet energy is modified by ±1σ or smeared, respectively. They represent the dominant sources of systematic uncertainties on the measured W +b-jets fiducial cross-sections and are found to be in the range 10–50%, depending on the jet multiplicity and pT interval considered.
Initial-state and final-state radiation (ISR/FSR). Uncertainties on ISR and FSR affect the extrapolation of the t¯t contribution in the analysis regions, as well the single-top Monte Carlo expectation in the 1-jet region and the data-driven single-top estimate in the 2-jet region. These effects are evaluated using the AcerMC generator interfaced to Pythia, and by varying the parameters controlling ISR and FSR in a range consistent with experimental data [53]. Their effect on the final cross-section measurements depends strongly on the jet pT interval and varies between 2% and 30%.
b-tagging efficiency calibration. The calibration of the b-tagging efficiency is per-formed using control samples in data [42]. Uncertainties on these calibrations are estimated separately for light-jets, c-jets and b-jets as a function of the pT and η of the jet [43, 44]. These uncertainties affect both the W +b-jets selection efficiency and the shape of the CombNN templates. The corresponding impact on the measured cross-section is estimated independently for b-jets, c-jets and light-jets to be in the range 1–8%.
Monte Carlo modelling. The uncertainty related to the Alpgen W +b-jets fiducial acceptance modelling is estimated using alternative W +b-jets samples, generated using dif-ferent settings. Specifically, the functional form of the factorization scale is varied; the set of parton distribution functions (PDF) is changed from CTEQ6L1 [54] to MRST2002LO [55]; the renormalization and factorization scales are halved and doubled; finally, the minimum jet pTused in the MLM matching is decreased (increased) to 15 (25) GeV, from the reference value of 20 GeV.
Because of the mild dependence of the CombNN template shape on the jet pT, an
additional systematic uncertainty due to the c-jets and b-jets pT modelling is quoted. This uncertainty is estimated using the full Herwig parton shower sample of c-jets and b-jets in place of the Alpgen matrix element ones. The full Herwig parton shower c-jets and b-jets spectra are found to be softer than the corresponding spectra produced by the Alpgen matrix element and the difference between the two is larger than any differences observed with the alternative Alpgen samples mentioned above.
The systematic uncertainties on the measured cross-section related to the Monte Carlo modelling are in the range 2–8%.
Topological cluster energy scale and pile-up modelling. These account for the contribution to the ETmiss uncertainty due to uncertainties on the energy measurement of low-momentum jets and calorimeter cells that are not associated with electrons, muons or jets, as well as the uncertainty on the modelling of pile-up [56]. Their effect is estimated to be in the range 2–6%.
CombNN weight templates shape. Uncertainties on the CombNN shape of b-jets, c-jets and light-jets are quantified independently. These uncertainties affect the measured cross-section by changing the results of the CombNN fits, but they do not affect the un-folding process.
The systematic uncertainty associated with the b-jet CombNN shape is estimated using data. Events with at least four jets, two of which must be b-tagged, are selected. These events form a sample of t¯t candidates whose leading jet is a real b-jet approximately 95% of the time, as estimated in Monte Carlo simulation. This clean sample of b-jet candidates is used to compute the ratio of the corresponding CombNN distribution in data to that in MC simulation. This ratio is applied to all the b-jet templates used in the CombNN fit and the new set of templates is used to assess the corresponding systematic uncertainty.
The systematic uncertainty associated with the c-jet CombNN shape is estimated by preparing alternative CombNN templates for c-jets. Both the c-jet and b-jet CombNN shapes are sensitive to the description of the b-hadron and c-hadron branching ratios and in particular to the number of charged particles produced in their decay vertices. While it is possible to define a clean and almost unbiassed control sample of b-jets in the data to check any possible discrepancy with the Monte Carlo simulation, the same is not feasible for c-jets. The alternative c-jet templates are then obtained by varying artificially the relative contribution of events with different track multiplicity associated with secondary vertices. Variations of 10% are considered in each track multiplicity bin, consistent with the relevant uncertainties in the c-hadron branching ratios.
from Pythia to assess the systematic uncertainties on the light-jet CombNN shape. The effects of the variations of b-jet and c-jet CombNN shapes on the final cross-section measure-ments range between 2% and 8%, while the effect of the light-jet CombNN shape variation is negligible.
Multijet background CombNN shape. The systematic uncertainty on the multijet template shape is assessed using a control region defined by ETmiss< 25 GeV and mT(W )<
40 GeV. Any mismodelling observed in this region is transported to the signal region and used to generate alternative multijet shapes, both in the electron and muon samples. The corresponding effect on the measured cross-section is larger in the electron sample where it is in the range 1–10% depending on the jet multiplicity and pT interval considered.
Others. Uncertainties related to the lepton trigger and reconstruction efficiencies are evaluated using tag-and-probe measurements in Z → µµ and Z → ee events [29, 31]. Similarly, the Z-mass peak is used to determine the lepton momentum scales and resolutions and the corresponding uncertainties [29,30]. The effect of these sources of uncertainties on the W +b-jets cross-section is between 1% and 2%. A 3.9% uncertainty on the integrated luminosity is also included [28].
8 Results
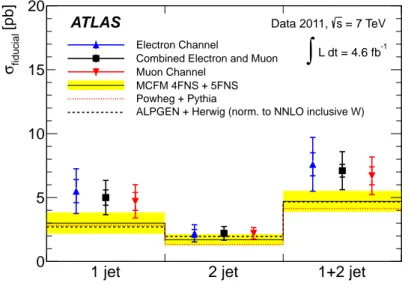
The unfolded result for the fiducial W +b-jets cross-section is presented in figure 7, while the measured differential dσ/dpbT-jet distributions are shown in figure 8. The numerical values corresponding to the combination of the electron and muon channels are shown in tables 4–6, where details of the systematic uncertainties and correlation matrices for the statistical and systematic uncertainties are also presented. The measured cross-sections for the 1-jet, 2-jet and 1+2-jet fiducial regions are:
σfid (1 jet) = 5.0 ± 0.5 (stat) ± 1.2 (syst) pb,
σfid (2 jet) = 2.2 ± 0.2 (stat) ± 0.5 (syst) pb,
σfid (1+2 jet) = 7.1 ± 0.5 (stat) ± 1.4 (syst) pb.
The results are compared to the NLO predictions of MCFM and Powheg, and to the Alpgen predictions scaled by the NNLO normalization factor for the inclusive W cross-section [21]. Both the Alpgen and Powheg predictions implement a 4-flavour number
scheme (4FNS) calculation, while the MCFM prediction, following the calculation described in ref. [5], includes terms which use the 5-flavour number scheme (5FNS) to account for the presence of b-quarks in the initial state originating from parton distribution functions.
The NLO predictions of MCFM and Powheg are evaluated using the MSTW2008 [57] NLO PDF, and the following dynamic renormalization and factorization scales (µRand µF) are chosen5: µ2F = µ2R= m2`ν+ p2T(`ν) +m 2 b+ p2T(b) 2 + m¯2b+ p2T(¯b) 2 . (8.1)
The PDF uncertainty is calculated with the MSTW2008 eigenvectors using the Hessian procedure [57]. The dependence of the result on the choice of scale, which dominates the 5In the 5-flavour number scheme, the production of one b-jet in the final state with an associated light
theoretical uncertainty, is evaluated by varying the scale conservatively between a quarter and four times the value in equation8.1, as in ref. [5]. These variations are used to calculate an asymmetric uncertainty before applying vetoes on additional jets. The effect of jet vetoes is then taken into account following the procedure outlined in ref. [58].
To compare the NLO calculations with data, the impact of non-perturbative effects and double-parton interactions has to be considered. The MCFM predictions are only available at the parton level, while the Powheg predictions are interfaced with Pythia to model the non-perturbative effects of hadronization and the underlying event. A multiplicative correction derived from the Powheg sample is therefore applied to the MCFM calculation to account for these non-perturbative effects. The uncertainty on the hadronization compo-nent of this correction is estimated by comparing the Pythia and Herwig parton showers, while the uncertainty on the underlying event component is estimated using the alternative Perugia2011 [53] tune instead of the AUET2B [59] one. The effect of double-parton inter-actions, where a W boson and heavy-flavour jet are produced from different parton–parton interactions within the same proton, also has to be considered. Neither the MCFM nor the Powheg calculations include this contribution, therefore an additive correction derived
1 jet 2 jet 1+2 jet
[pb] fiducial σ 0 5 10 15 20 Electron Channel
Combined Electron and Muon Muon Channel
MCFM 4FNS + 5FNS Powheg + Pythia
ALPGEN + Herwig (norm. to NNLO inclusive W)
ATLAS Data 2011, s = 7 TeV
-1
L dt = 4.6 fb
∫
Figure 7. Measured fiducial cross-sections with the statistical (inner error bar) and statistical plus systematic (outer error bar) uncertainties in the electron, muon, and combined electron and muon channels. The cross-sections are given in the 1-jet, 2-jet, and 1+2-jet fiducial regions. The
measurements are compared with NLO predictions calculated with MCFM [5] and corrected for
hadronization and double-parton interaction (DPI) effects. The yellow bands represent the total uncertainty on the prediction. It is obtained by combining in quadrature the uncertainties resulting from variations of the renormalization and factorization scales, the PDF set, the DPI model and non-perturbative corrections. The NLO prediction from Powheg interfaced to Pythia, corrected for DPI effects, and the prediction from Alpgen interfaced to Herwig and Jimmy and scaled by the NNLO inclusive W normalization factor are also shown.
[GeV] T b-jet p 25-30 30-40 40-60 60-140 Data/MC 1 2 3 4 Data / MCFM theor. uncertainties [GeV] T b-jet p 25-30 30-40 40-60 60-140 Data/MC 1 2 3 4 Data / ALPGEN [pb/GeV] b-jet T /dp σ d -2 10 -1 10 1 ATLAS -1 L dt = 4.6 fb
∫
Data (s=7 TeV) MCFM ALPGEN , NJet = 1 µ e + [GeV] T b-jet p 25-30 30-40 40-60 60-140 Data/MC 1 2 3 Data / MCFM theor. uncertainties [GeV] T b-jet p 25-30 30-40 40-60 60-140 Data/MC 1 2 3 Data / ALPGEN [pb/GeV] b-jet T /dp σ d -2 10 -1 10 ATLAS -1 L dt = 4.6 fb∫
Data (s=7 TeV) MCFM ALPGEN , NJet = 2 µ e +Figure 8. Measured differential W +b-jets cross-sections with the statistical plus systematic
un-certainties as a function of pbT-jet in the 1-jet (left) and 2-jet (right) fiducial regions, obtained by
combining the muon and electron channel results. The measurements are compared to the MCFM predictions and to the Alpgen predictions interfaced to Herwig and Jimmy and scaled by the NNLO inclusive W normalization factor. The ratios between measured and predicted cross-sections are also shown.
from the Alpgen simulation interfaced to Herwig and Jimmy has beeen applied to both calculations. This correction represents a 25% effect on the total cross-section, concen-trated in the lowest momentum bins of the 1-jet region. The DPI contribution in Alpgen has been shown to agree at the detector level with the ATLAS measurement of σeff in the W +2-jet sample [60]. Based on this measurement, a +39−28% uncertainty is assigned to the DPI correction. The non-perturbative and DPI corrections for the 1-jet and 2-jets regions are presented in table 7. The fully corrected MCFM predictions are presented in table 8
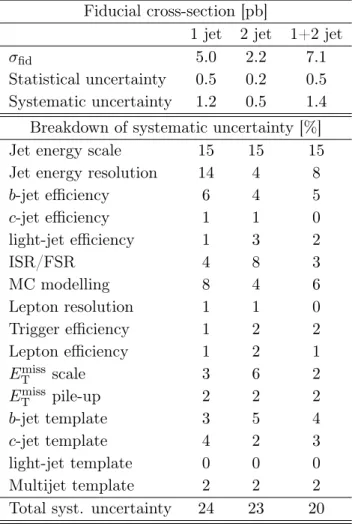
Table 4. Measured fiducial W +b-jets cross-sections for the combination of the electron and muon channels with statistical and systematic uncertainties and breakdown of relative systematic uncer-tainties per jet multiplicity, and combined across jet bins.
Fiducial cross-section [pb]
1 jet 2 jet 1+2 jet
σfid 5.0 2.2 7.1
Statistical uncertainty 0.5 0.2 0.5 Systematic uncertainty 1.2 0.5 1.4 Breakdown of systematic uncertainty [%]
Jet energy scale 15 15 15
Jet energy resolution 14 4 8
b-jet efficiency 6 4 5 c-jet efficiency 1 1 0 light-jet efficiency 1 3 2 ISR/FSR 4 8 3 MC modelling 8 4 6 Lepton resolution 1 1 0 Trigger efficiency 1 2 2 Lepton efficiency 1 2 1 EmissT scale 3 6 2 EmissT pile-up 2 2 2 b-jet template 3 5 4 c-jet template 4 2 3 light-jet template 0 0 0 Multijet template 2 2 2
Table 5. Measured fiducial W +b-jets cross-section in the 1-jet region with statistical and systematic
uncertainties and their correlations in bins of pbT-jet.
Fiducial cross-section, 1 jet
pbT-jet [GeV] [25, 30] [30, 40] [40, 60] [60, 140] dσ/dpbT-jet [nb/GeV] 259 143 65 10.3 Statistical Uncertainty (%) 9 6 12 18 Systematic Uncertainty (%) 24 19 33 54 Correlation coefficients of 1 0.415 −0.38 −0.02 statistical uncertainties 1 −0.01 −0.17 1 −0.14 1 Correlation coefficients of 1 0.893 0.740 0.582 systematic uncertainties 1 0.887 0.750 1 0.875 1
Table 6. Measured fiducial W +b-jets cross-section in the 2-jet region with statistical and systematic
uncertainties and their correlations in bins of pbT-jet.
Fiducial cross-section, 2 jets
pbT-jet [GeV] [25, 30] [30, 40] [40, 60] [60, 140] dσ/dpbT-jet [nb/GeV] 73 58 38 9.3 Statistical Uncertainty (%) 12 8 14 23 Systematic Uncertainty (%) 26 22 21 31 Correlation coefficients of 1 0.585 −0.45 −0.08 statistical uncertainties 1 0.069 −0.29 1 −0.20 1 Correlation coefficients of 1 0.900 0.550 0.544 systematic uncertainties 1 0.795 0.719 1 0.775 1
Table 7. Multiplicative correction factors for non-perturbative effects and additive corrections for double-parton interactions, derived from the Alpgen simulation, applied to the MCFM and Powheg predictions for the comparisons with unfolded results. The non-perturbative uncertainties include the hadronization and underlying event modelling, while the DPI uncertainties are based
on the ATLAS measurement of σeff [60].
Correction 1 jet 2 jets
Non-perturbative 0.92 ± 0.02 (had.) ±0.03 (UE) 0.96 ± 0.05 (had.) ±0.03 (UE) DPI [pb] 1.02 ± 0.05 (stat)+0.40−0.29 (syst) 0.32 ± 0.02 (stat) +0.12−0.09 (syst)
Table 8. Theoretical NLO predictions for the W +b-jets fiducial cross-section for one lepton flavour calculated with the MCFM program, corrected for non-perturbative effects and DPI contributions.
MCFM NLO prediction [pb]
1 jet 3.01 ± 0.07 (stat)+0.72−0.54 (scale) ±0.04 (PDF) ±0.08 (non-pert) +0.40−0.29 (DPI) 2 jets 1.69 ± 0.06 (stat)+0.40−0.23 (scale) ±0.04 (PDF) ±0.08 (non-pert) +0.12−0.09 (DPI) 1+2 jets 4.70 ± 0.09 (stat)+0.60−0.49 (scale) ±0.06 (PDF) ±0.16 (non-pert) +0.52−0.38 (DPI)
9 Results without single-top subtraction
The W +b-jets cross-section is also measured including the contribution of the single-top process. These measurements provide a complementary perspective on the W +b-tagged-jet sample, and they have a higher statistical precision than the single-top subtracted ones, especially at high pbT-jet.
For each analysis region and pbT-jet bin, the same ML fit as for the W +b-jets measure-ment is used, as well as the same estimates and constraints for the multijet, t¯t, Z+jets and diboson backgrounds. In the fit to the CombNN distribution, the W +b-jets and single-top templates are merged accounting for their respective predicted cross-sections, and they form a single template whose normalization is estimated. As a consequence of the single-top pro-cess being considered as part of the signal, the number of nuisance parameters in the fit is reduced, thereby increasing its statistical precision. After the CombNN fit, the number of estimated W +b-jets and single-top events is unfolded to a common fiducial region, identical to the W +b-jets fiducial region, using correction factors and a response matrix built from the sum of the two Monte Carlo samples.
The systematic uncertainties from the fit and unfolding steps are accounted for using the same methods as for the single-top subtracted measurement. An additional uncertainty is introduced to account for the relative normalization of W +b-jets and single-top. Alternative samples, in which the amounts of W +b-jets and single-top are doubled in turn, are used to perform the unfolding. The largest deviation obtained with respect to the nominal result, approximately 5%, is then quoted as a separate systematic uncertainty.
The resulting fiducial cross-sections for W +b-jets plus single-top, combining the elec-tron and muon channels, are:
σfid (1 jet) = 5.9 ± 0.2 (stat) ± 1.3 (syst) pb,
σfid (2 jet) = 3.7 ± 0.1 (stat) ± 0.8 (syst) pb,
σfid (1+2 jet) = 9.6 ± 0.2 (stat) ± 1.7 (syst) pb.
The corresponding expected cross-sections, calculated for the W +b-jets process using Alpgen interfaced to Herwig and Jimmy and scaled by the NNLO inclusive W normal-ization factor and for the single-top processes using AcerMC interfaced to Pythia and scaled to NLO, are 3.6 pb, 3.0 pb and 6.6 pb, respectively. The differential results as a function of pbT-jet are presented in figure9 and tables9 and 10.
[GeV] T b-jet p 25-30 30-40 40-60 60-140 Data/MC 1 2 Data / (ALPGEN+AcerMC) [pb/GeV] b-jet T /dp σ d -2 10 -1 10 1 ATLAS -1 L dt = 4.6 fb
∫
Data (s=7 TeV) AcerMC single-top ALPGEN W+b-jets + , NJet = 1 µ e + [GeV] T b-jet p 25-30 30-40 40-60 60-140 Data/MC 1 2 Data / (ALPGEN+AcerMC) [pb/GeV] b-jet T /dp σ d -2 10 -1 10 ATLAS -1 L dt = 4.6 fb∫
Data (s=7 TeV) AcerMC single-top ALPGEN W+b-jets + , NJet = 2 µ e +Figure 9. Measured differential W +b-jets cross-section without single-top subtraction as a function
of pbT-jetin the 1-jet (left) and 2-jet (right) samples, obtained by combining the electron and muon
channels. The measurements are compared to the W +b-jets plus single-top predictions obtained using Alpgen interfaced to Herwig and Jimmy and scaled by the NNLO inclusive W normalization factor plus AcerMC interfaced to Pythia and scaled to the NLO single-top cross-section. The ratios between measured and predicted cross-sections are also shown.
Table 9. Measured fiducial W +b-jets cross-section without single-top subtraction in the 1-jet
region, with statistical and systematic uncertainties and their correlations in bins of pbT-jet.
Fiducial cross-section of W +b-jets + single-top, 1 jet
pbT-jet [GeV] [25, 30] [30, 40] [40, 60] [60, 140] dσ/dpbT-jet [nb/GeV] 278 156 80 15.7 Statistical Uncertainty (%) 6 4 5 5 Systematic Uncertainty (%) 23 15 15 16 Correlation coefficients of 1 0.401 −0.31 −0.03 statistical uncertainties 1 0.00 −0.13 1 −0.05 1 Correlation coefficients of 1 0.840 0.682 0.866 systematic uncertainties 1 0.935 0.875 1 0.861 1
Table 10. Measured fiducial W +b-jets cross-section without single-top subtraction in the 2-jet
region, with statistical and systematic uncertainties and their correlations in bins of pbT-jet.
Fiducial cross-section of W +b-jets + single-top, 2 jets
pbT-jet [GeV] [25, 30] [30, 40] [40, 60] [60, 140] dσ/dpbT-jet [nb/GeV] 88 73 56.5 18.8 Statistical Uncertainty (%) 8 5 6 5 Systematic Uncertainty (%) 20 18 16 19 Correlation coefficients of 1 0.602 −0.27 −0.08 statistical uncertainties 1 0.125 −0.18 1 −0.12 1 Correlation coefficients of 1 0.905 0.723 0.792 systematic uncertainties 1 0.925 0.940 1 0.885 1
10 Conclusions
A measurement of the cross-section of W boson production in association with b-jets at √
s = 7 TeV is presented, based on data corresponding to an integrated luminosity of 4.6 fb−1 collected with the ATLAS detector at the LHC. The measurement is performed with a single b-tagged jet requirement in the W +1-jet and W +2-jets samples. W +b-jets yields are estimated separately in the electron and muon decay channel and unfolded to a common fiducial region. Good agreement is found between the results in the electron and muon channels and combined measurements are provided.
In the 1-jet region, the measured fiducial cross-section is 5.0 ± 0.5 (stat) ± 1.2 (syst) pb, consistent within 1.5σ with NLO predictions. In the 2-jet region, the measured fiducial cross-section is 2.2 ± 0.2 (stat) ± 0.5 (syst) pb, in good agreement with the theoretical calculations. As a result, the combined 1+2-jet measurement, yielding a cross-section of 7.1 ± 0.5 (stat) ± 1.4 (syst) pb, is found to be consistent within 1.5σ with the MCFM NLO prediction, corrected for hadronization and DPI effects, of 4.70 ± 0.09 (stat)+0.60−0.49 (scale) ± 0.06 (PDF) ± 0.16 (non-pert)+0.52−0.38 (DPI) pb.
A differential cross-section measurement as a function of the leading b-jet pT is also
presented, for jets in the pTrange between 25 GeV and 140 GeV. In the 1-jet fiducial region,
the measured cross-section is larger than the NLO predictions, but compatible within the theoretical and experimental uncertainties. The same measurement in the 2-jet fiducial region is found to be in agreement with the theoretical predictions.
A second set of measurements, including the single-top contribution, is also presented. In the 1-jet fiducial region, the measured W +b-jets plus single-top cross-section is 5.9 ± 0.2 (stat)±1.3 (syst) pb, while in the 2-jet fiducial region it is 3.7±0.1 (stat)±0.8 (syst) pb. The combined 1+2-jet fiducial cross-section is measured to be 9.6±0.2 (stat)±1.7 (syst) pb. The corresponding b-jet pT differential cross-sections have significantly reduced uncertain-ties with respect to the single-top subtracted measurements and can be compared to com-bined single top-quark and W +b-jets calculations in the future.
Acknowledgments
We thank CERN for the very successful operation of the LHC, as well as the support staff from our institutions without whom ATLAS could not be operated efficiently.
We acknowledge the support of ANPCyT, Argentina; YerPhI, Armenia; ARC, Aus-tralia; BMWF and FWF, Austria; ANAS, Azerbaijan; SSTC, Belarus; CNPq and FAPESP, Brazil; NSERC, NRC and CFI, Canada; CERN; CONICYT, Chile; CAS, MOST and NSFC, China; COLCIENCIAS, Colombia; MSMT CR, MPO CR and VSC CR, Czech Republic; DNRF, DNSRC and Lundbeck Foundation, Denmark; EPLANET, ERC and NSRF, Euro-pean Union; IN2P3-CNRS, CEA-DSM/IRFU, France; GNSF, Georgia; BMBF, DFG, HGF, MPG and AvH Foundation, Germany; GSRT and NSRF, Greece; ISF, MINERVA, GIF, DIP and Benoziyo Center, Israel; INFN, Italy; MEXT and JSPS, Japan; CNRST, Morocco; FOM and NWO, Netherlands; BRF and RCN, Norway; MNiSW, Poland; GRICES and FCT, Portugal; MERYS (MECTS), Romania; MES of Russia and ROSATOM, Russian
Fed-eration; JINR; MSTD, Serbia; MSSR, Slovakia; ARRS and MVZT, Slovenia; DST/NRF, South Africa; MICINN, Spain; SRC and Wallenberg Foundation, Sweden; SER, SNSF and Cantons of Bern and Geneva, Switzerland; NSC, Taiwan; TAEK, Turkey; STFC, the Royal Society and Leverhulme Trust, United Kingdom; DOE and NSF, United States of America. The crucial computing support from all WLCG partners is acknowledged gratefully, in particular from CERN and the ATLAS Tier-1 facilities at TRIUMF (Canada), NDGF (Denmark, Norway, Sweden), CC-IN2P3 (France), KIT/GridKA (Germany), INFN-CNAF (Italy), NL-T1 (Netherlands), PIC (Spain), ASGC (Taiwan), RAL (UK) and BNL (USA) and in the Tier-2 facilities worldwide.
References
[1] J. M. Campbell and R. Ellis, MCFM for the Tevatron and the LHC , Nucl. Phys. Proc. Suppl. 205-206 (2010) 10.
[2] S. Alioli, P. Nason, C. Oleari, and E. Re, A general framework for implementing NLO calculations in shower Monte Carlo programs: the POWHEG BOX , JHEP 1006 (2010) 043 [arXiv:1002.2581].
[3] S. Frixione and B. R. Webber, Matching NLO QCD computations and parton shower simulations, JHEP 06 (2002) 029 [hep-ph/0204244];
S. Frixione, P. Nason and B. R. Webber, Matching NLO QCD and parton showers in heavy flavour production, JHEP 08 (2003) 007 [hep-ph/0305252];
S. Frixione, E. Laenen and P. Motylinski, Single-top production in MC@NLO, JHEP 03 (2006) 092 [hep-ph/0512250].
[4] S. Badger, J. M. Campbell and R. K. Ellis, QCD corrections to the hadronic production of a heavy quark pair and a W-boson including decay correlations, JHEP 1103 (2011) 027 [arXiv:1011.6647];
F. F. Cordero, L. Reina and D. Wackeroth, Associated production of a W or Z boson with bottom quarks at the Tevatron and the LHC, PoS RADCOR2009 (2010) 055
[arXiv:1001.3362];
J. M. Campbell, R. K. Ellis, F. Febres Cordero, F. Maltoni, L. Reina, D. Wackeroth and S. Willenbrock, Associated Production of a W Boson and One b Jet, Phys. Rev. D 79 (2009) 034023 [arXiv:0809.3003].
[5] J. M. Campbell, F. Caola, F. Febres Cordero, L. Reina and D. Wackeroth, NLO QCD predictions for W + 1 jet and W + 2 jet production with at least one b jet at the 7 TeV LHC, Phys. Rev. D 86 (2012) 034021 [arXiv:1107.3714].
[6] E. L. Berger, C. B. Jackson, S. Quackenbush and G. Shaughnessy, Calculation of Wb¯b
Production via Double Parton Scattering at the LHC, Phys. Rev. D 84 (2011) 074021 [arXiv:1107.3150].
[7] ATLAS Collaboration, Search for the Standard Model Higgs boson produced in association with a vector boson and decaying to a b-quark pair with the ATLAS detector, Phys. Lett. B 718 (2012) 369 [arXiv:1207.0210].
[8] ATLAS Collaboration, Observation of a new particle in the search for the Standard Model Higgs boson with the ATLAS detector at the LHC, Phys. Lett. B 716 (2012) 1
[9] ATLAS Collaboration, Search for light top squark pair production in final states with leptons
and b-jets with the ATLAS detector in√s = 7 TeV proton-proton collisions, submitted to
Phys. Lett. B (2012) [arXiv:1209.2102].
[10] ATLAS Collaboration, Measurement of the t-channel single top-quark production cross
section in pp collisions at√s = 7 TeV with the ATLAS detector, Phys. Lett. B 717 (2012)
330 [arXiv:1205.3130].
[11] CDF Collaboration, T. Aaltonen et al, First Measurement of the b-jet Cross Section in
Events with a W Boson in p¯p Collisions at √s = 1.96 TeV, Phys. Rev. Lett. 104 (2010)
131801 [arXiv:0909.1505].
[12] D0 Collaboration, V. Abazov et al, Measurement of the p¯p → W+b+X production cross
section at√s =1.96 TeV [arXiv:1210.0627].
[13] ATLAS Collaboration, Measurement of the cross section for the production of a W boson in
association with b-jets in pp collisions at√s = 7 TeV with the ATLAS detector, Phys. Lett.
B 707 (2012) 418 [arXiv:1109.1470].
[14] ATLAS Collaboration, The ATLAS Experiment at the CERN Large Hadron Collider, JINST 3 (2008) S08003.
[15] M. L. Mangano, M. Moretti, F. Piccinini, R. Pittau and A. D. Polosa, ALPGEN, a generator for hard multiparton processes in hadronic collisions, JHEP 07 (2003) 001.
[16] G. Corcella et al., HERWIG 6.5: an event generator for Hadron Emission Reactions With Interfering Gluons (including supersymmetric processes), JHEP 01 (2001) 010;
G. Corcella et al., HERWIG 6.5 release notes [hep-ph/0210213].
[17] J. M. Butterworth, J. R. Forshaw, and M. H. Seymour, Multiparton Interactions in Photoproduction at HERA, Z. Phys. C 72 (1996) 637 [hep-ph/9601371].
[18] M. L. Mangano and R. Pittau, Multijet matrix elements and shower evolution in hadronic collisions: Wbb + n jets as a case study , Nucl. Phys. B 632 (2002) 343 [hep-ph/0108069]. [19] T. Sjostrand, S. Mrenna, and P. Z. Skands, PYTHIA 6.4 Physics and Manual , JHEP 0605
(2006) 026 [hep-ph/0603175].
[20] B.P. Kersevan and E. Richter-Was, The Monte Carlo event generator AcerMC version 2.0 with interfaces to PYTHIA 6.2 and HERWIG 6.5 [hep-ph/0405247].
[21] C. Anastasiou, L. Dixon, K. Melnikov and F. Petriello, High-precision QCD at hadron colliders: electroweak gauge boson rapidity distributions at NNLO, Phys. Rev. D 69 (2004) 094008 [hep-ph/0312266].
[22] J. M. Campbell, R. K. Ellis and C. Williams, Vector boson pair production at the LHC, JHEP 1107 (2011) 018 [arXiv:1105.0020].
[23] J. M. Campbell, R. K. Ellis and F. Tramontano, Single top production and decay at next-to-leading order, Phys. Rev. D 70 (2004) 094012 [hep-ph/0408158].
[24] M. Aliev, H. Lacker, U. Langenfeld, S. Moch, P. Uwer and M. Wiedermann, HATHOR: HAdronic Top and Heavy quarks crOss section calculatoR, Comput. Phys. Commun. 182 (2011) 1034 [arXiv:1007.1327].
[25] ATLAS Collaboration, The ATLAS Simulation Infrastructure, Eur. Phys. J. C 70 (2010) 823 [arXiv:1005.4568].