Adaptive Auditory-motor Control of the Time-varying Formant Trajectories
in Vowels and Its Patterns of Generalization
by Shanqing Cai
B. Eng., Biomedical Engineering, Tsinghua University, Beijing, China, 2005
M. S. E., Biomedical Engineering,
MASSACHUSETTS INSTITUTE OF TECHNOLOGY
MAR
2
0 2012
LPBRA RIES
The Johns Hopkins University, Baltimore, Maryland, USA, 2007Submitted to the Department of Electrical Engineering and Computer Science in partial fulfillment of the requirements for the degree of
MASTER OF SCIENCE IN ELECTRICAL ENGINEERING AND COMPUTER SCIENCE
February 2012
ARCHVES
C2012. Massachusetts Institute of Technology. All Rights Reserved.
Signature of Author
/
Shanqing Cai Harvard-MIT Division of Health Science and Technology February 3, 2012
Certified by __
Joseph S. Perkell, Ph.D., D.M.D. Senior Research Scientist, Research Laboratory of Electronics, Massachusetts Institute of Technology Thesis Supervisor
Accepted by
jj/ij
Professor Leslie A. Kolodziej skiAdaptive Auditory-motor Control of Time-varying Formant Trajectories in
Vowels and its Patterns of Generalization
by
Shanqing Cai
Submitted to the Department of Electrical Engineering and Computer Science in partial fulfillment of the requirements for the degree of Master of Science in Electrical Engineering and Computer Science
Abstract
This thesis aims at elucidating the role of auditory feedback in the learning and planning of complex articulatory gestures in time-varying phonemes. To this end, we studied native
Mandarin speakers' responses to perturbations of their auditory feedback of the first and second formant trajectories during the production of the Mandarin triphthong /iau/. On the group level, subjects adaptively adjusted their productions to partially compensate for the perturbations in auditory feedback under both the F1 and F2 perturbations. But considerable between-individual variation existed. The result indicate that auditory feedback-based learning and control of speech movements is not restricted to quasi-static gestures in monophthongs as found in previous
studies, but also extends to time-varying gestures. To probe the internal structure of the
mechanisms of auditory-motor transformations in speech, we tested the pattern of generalization of the adaptation trained on the triphthong /iau/ to other vowels with different spatial and
temporal characteristics in the same language. A broad but weak and decaying pattern of generalization was observed under the F1 perturbation; the strength of the generalization diminished with increasing dissimilarity from /iau/. No significant transfer of adaptation was found under the perturbation of F2. The details and implications of the pattern of generalization are examined and discussed in light of previous sensorimotor adaptation studies of speech and limb motor control and a neurocomputational model of speech motor control.
Thesis Supervisor: Joseph S. Perkell
Acknowledgements
I am grateful to Drs. Joseph Perkell, Satrajit Ghosh and Frank Guenther for their guidance
and support during my Master's thesis research. Marc Boucek's work laid the basis for the Audapter perturbation software used in this study. Members of the Speech Motor Control Group, Research Laboratory of Electronics, including Melanie Matthies, Mark Tiede, and Harlan Lane offered useful suggestions to the data analysis and interpretation. Special thanks are due to Melanie Matthies and Harlan Lane for discussions on statistical methods. I am also thankful to Seth Hall and Arlene Wint for technical and administrative support.
This research was support by NIH grants No. R01DC01925 (PI: J. Perkell). I was also supported by the MIT Edward Austin and Chyn Duog Shiah Memorial Graduate Fellowships, a Harvard Martinos Center Multimodal Neuroimaging Training Grant, and an ASA Raymond H. Stetson Fellowship in Speech Production and Phonetics.
Table of Contents
A bstract...2
Acknow ledgem ents...3
List of Figures ... 6
1. Introduction ... 7
2. M aterials and M ethods ... 12
2.1. Participants ... 12
2.2. Stim ulus utterances ... 12
2.3. A pparatus for form ant estim ation and shifting... 14
2.4. A utom atic extraction of the triphthong /iau/... 15
2.5. Experim ent design...16
2.6. Construction of the perturbation fields... 18
2.6.1. The F1 perturbations used in Experiment 1: Inflate and Deflate ... 18
2.6.2. The F2 perturbations used in Experiment 2: Up and Down ... 20
2.7. D ata analysis and statistical procedures ... 21
3. Results ... 24
3.1. Experiment 1: Adaptation to the time-varying perturbation of the auditory feedback of F1 24 3.2. Experiment 1: Transfer of the adaptive responses to the test utterances under the F1 perturbation...33
3.3. Experiment 2: Adaptation to the time-varying perturbation of the auditory feedback of F2 39 3.4. Experiment 2: Transfer of the adaptive responses to the test utterances under the F2 perturbation...46
4. D iscussion...48
4.1. Com pensatory responses ... 48
4.3. Generalization to unperturbed sounds... 53
Conclusions ... 59
A ppendix...60
List of Figures
Figure number Figure name
Figure 1 Spectrogram and parsing of the training utterance Figure 2 Experimental design for Experiment 1
Figure 3 Design of the perturbation fields for the Inflate/Deflate perturbation Figure 4 Design of the perturbation fields for the Up/Down (F2) perturbations.
Figure 5 Adaptive changes in the formant trajectories of the training vowel /iau/ under the Inflate and Deflate perturbations in representative subjects
Figure 6 Group-average formant trajectories of the training vowel /iau/ under the Inflate and Deflate perturbations in Experiment 1
Figure 7 Quantification of adaptive changes in several trajectory parameters for the training vowel /iau/ under the Inflate and Deflate perturbations in Experiment 1
Figure 8 Amount of adaptation for the training vowel /iau/ in individual subjects under the Inflate and Deflate perturbations in Experiment 1
Figure 9 The relations of the test vowels to the training vowel in formant space (Experiment 1) Figure 10 Generalization of the auditory-motor adaptation to the test utterances in Experiment 1
Figure 11 Quantification of transfer of the adaption to the test vowels (Experiment 1)
Figure 12 Group-average formant trajectories of the training vowel /iau/ under the Up and Down F2 perturbations in Experiment 2
Figure 13 Quantification of adaptive changes in several trajectory parameters for the training
vowel /iau/ under the Up and Down perturbations in Experiment 2
Figure 14 Amount of adaptation for the training vowel /iau/ in individual subjects under the Up
and Down perturbations in Experiment 2
1. Introduction
Auditory feedback of the sound of a speaker's own speech is an integral part of normal speech production. Previous studies that used artificially introduced perturbations of speakers' auditory feedback during production have generally shown that speakers compensate for such perturbations by modifying their production in the direction opposite to that of the perturbation.
These studies have explored a variety of acoustic parameters, including vocal intensity (Lane and Tranel, 1971; Liu et al., 2007, 2009), fundamental frequency (Burnett et al., 1998, 2002; Jones and Munhall, 2000, 2002; Donath et al., 2002; Xu et al., 2004; Larson et al., 2000, 2008), the first and second formant frequencies (F1 and F2) of vowels (Houde and Jordan, 1998, 2002; Purcell and Munhall, 2006a, 2006b; Villacorta et al., 2007; Tourville et al., 2008; Munhall et al.,
2009; MacDonald et al., 2010), and more recently the spectrum of the fricative If! (Shiller et al.,
2009). These studies can be divided into two categories according to the experimental design.
One category, which we call the "unexpected perturbation paradigm", involves the introduction of perturbations during a randomly selected subset of the trials. The findings of such studies address the role of auditory feedback in the online, moment-by-moment control of production of speech sounds (e.g., Purcell and Munhall, 2006a). In the second category of studies, which we refer to as the "sustained perturbation paradigm", perturbations occur repeatedly on a relatively large number of trials and are aimed at examining long-term modification of speech motor programs in response to altered auditory feedback. These studies probe sensorimotor adaptation of the speech motor system (e.g., Houde and Jordan, 1998, 2002; Purcell and Munhall, 2006b; Villacorta et al., 2007; Munhall et al., 2009; Shiller et al., 2009; MacDonald et al., 2010).
Both types of experimental design elicit compensatory responses, indicating that an
important component of goals for speech motor planning is in the auditory domain. This concept has been implemented in a computational model of speech production called DIVA (Guenther et al., 2006). This model proposes that during the execution of a pre-learned speech motor program, a speech sound map located in left ventral premotor cortex not only reads out a pre-learned
syllabic motor program via the primary motor cortex, but also provides auditory cortical areas with information about anticipated auditory outcome of the motor execution, i.e., the auditory target. The auditory areas monitor the auditory afferent signal, and compare it with the target. Mismatches between the target and auditory feedback are detected as production errors. To minimize these errors in subsequent productions, the brain uses the error information to modify the feedforward commands for subsequent movements. With the appropriate selection of a small set of parameters, the DIVA model is able to generate quantitatively accurate predictions of online compensation to unexpected perturbations (Tourville et al., 2008) and sensorimotor adaptation to sustained perturbations (Villacorta et al., 2007) of formant frequencies of vowels.
Previous studies of auditory feedback control of formant frequencies focused on steady-state vowels (i.e., monophthongs) (Houde and Jordan, 1998, 2002; Purcell and Munhall, 2006b; Villacorta et al., 2007; Tourville et al., 2008; Munhall et al., 2009; MacDonald et al., 2010). The monophthongs are characterized by relatively static formant frequencies, and many of the above-cited formant perturbation experiments (e.g., Houde and Jordan, 1998; Villacorta et al., 2007; Tourville et al., 2008) explicitly instructed subjects to prolong the monophthongs, which exaggerated the static quality of these vowels. However, time-varying sounds are pervasive in speech. Articulatory movements, which lead to changing vocal tract shapes and formant values, underlie the production of time-varying vowels such as diphthongs and triphthongs, as well as transitions between consonants and vowels. In comparison, prolonged static gestures like those used in the previous studies occur rarely in natural running speech. Thus, understanding the role of auditory feedback in the control of the time-varying speech movements is important for reaching a more comprehensive understanding of the properties of the speech motor system.
To our knowledge, no previous studies have examined whether or how time-varying
formants produced with articulatory gestures are influenced by auditory feedback. However, the role of auditory feedback has been studied within the context of the control of time-varying fundamental frequency (FO) using unexpected perturbation paradigms. Such studies have shown
that when producing utterances with time-varying FO contours, Mandarin (Xu et al., 2004) and English (Chen et al., 2007) speakers show online, short-latency compensatory FO adjustments in response to unexpected FO perturbations. It has been observed that the magnitudes of these compensatory responses were different during time-varying and static multisyllabic tonal
sequences (Xu et al., 2004; Liu et al., 2009). These results indicate that the functional properties of the auditory feedback control system may depend on whether the production goal is quasi-static or time-varying. The role of auditory feedback in the control of time-varying formant trajectories has not yet been investigated. In addition, because the above-mentioned studies of auditory feedback control of time-varying FO trajectories all used unexpected perturbations, they
did not shed light upon whether the compensatory motor corrections caused by the auditory errors could be incorporated into the feedforward motor commands of time-varying sounds, as observed previously in longer-term sensorimotor adaptation for steady state sounds.
A second aspect of sensorimotor adaptation addressed by the current study concerns
generalization of adaptation to sounds not encountered during perturbation training.
Generalization, also called transfer, refers to changes observed in movements not exposed to perturbations accompanying and/or following adaptation to perturbations of the "trained"
movements. Patterns of generalization can often provide valuable insights into the organizational principles of sensorimotor systems and provide constraints for models of those systems. For example, patterns of generalization of adaptation to untrained reaching movements have been used to guide the development of neural models of transforms between visual and motor coordinates (e.g., Ghahramani et al., 1996; Krakauer et al., 2000). Only a few studies have examined generalization of auditory-motor adaptations (Houde, 1997; Villacorta et al., 2007). Although these studies show generalization to untrained sounds, the amount of generalization and its relationship to the similarity between the trained and untrained sounds remains unclear. Nevertheless, such patterns of generalization can potentially reveal additional properties of the
speech motor system. For example, generalization of auditory-motor adaptations among vowels with different temporal or serial characteristics (e.g., monophthongs and triphthongs) could reveal principles by which the speech motor system plans and controls complex, time-varying movements. One possible principle is that the system performs auditory-to-motor mappings separately for time-varying and quasi-static vowels, which leads to the prediction that little generalization should be observed between these two different categories of vowels. Alternatively, the system could have a shared auditory-motor mapping between non-time-varying and time-non-time-varying vowels, in which case generalization across these categories of vowels is predicted. Following the same logic, more detailed properties of these mappings could be studied by examining generalization of adaptation across time-varying vowels with different numbers of serial components (e.g., diphthong /ia/ and triphthong /iau/) and time-varying vowels with different serial order (e.g., triphthongs /iau/ and /uai/).
Against this background, the aims of the current study are as follows. First, it aims to examine whether perturbations of time-varying formant frequency trajectories can induce adaptive changes in articulation. For this purpose, we chose, as the "training" stimulus, the triphthong /iau/ in Mandarin which requires active control of multiple articulators (tongue, jaw and lips; see explanation in Sect. 2.2), and we manipulated its FI trajectory in the auditory feedback provided to the speakers. The second aim of the current study is to explore the pattern of generalization of any compensatory adaptation found in response to perturbations of the F 1 trajectory in the triphthong to untrained vowels with different formant trajectories and temporal
characteristics.
To these ends, we conducted two related perturbation experiments, in which we employed different but complementary types of time-varying perturbation to auditory feedback. In Experiment 1, the Fl trajectory was manipulated in the subjects' auditory feedback as they produced words that contained the triphthong /iau/. Experiment 2 involved perturbations to the
auditory feedback of the F2 trajectory. In the triphthong /iau/, the Fl trajectory follows a
monotonic rise-then-fall pattern, reflecting the transition from a high vowel (/i/) to a low vowel (/a/) and then back to another high vowel (/u/), due to ane underlying non-monotonic pattern of tongue height change, whereas the F2 trajectory contains a monotonic decrease, reflecting transition from the front vowel /i/ to a less front vowel /a/ then to a back vowel /u/. By applying perturbations separately on both types of formant trajectories and observing the compensatory responses to them, we can gain more comprehensive insights into the auditory feedback-guided
2. Materials and Methods
2.1. Participants
Sixty-nine adult native speakers of Mandarin Chinese (35 female) participated in this study.
Of these participants, forty subjects (20 female) served as subjects in Experiment 1, which
involved perturbations of the trajectory of Fl; the remaining 29 (15 female) subjects participated in Experiment 2, in which perturbations of the trajectory of F2 was utilized.
These volunteers were recruited from around the Boston area through poster and Internet advertisements in Chinese. Inclusion criteria included: 1) began speaking Standard Mandarin before the age of 5, 2) had Standard Mandarin as the primary language of instruction throughout elementary and secondary education (1st - 12th grades), 3) reported no history of hearing, speech, or neurological disorders, and 4) had pure-tone hearing thresholds better than 20 dB HL at 0.5, 1, and 2 kHz as confirmed by an audiometric test. These methods were approved by the MIT Committee on the Use of Humans as Experimental Subjects.
2.2. Stimulus utterances
The triphthong /iau/ in Mandarin has a long average duration (250 ms on average in running speech, Yamagashi et al. 2008) and spans a large area in the Fl xF2 space. As a non-nasal vowel, its formants can be modeled relatively reliably with autoregressive (AR) analysis. Also, its occurrence in Mandarin is frequent. These properties make /iau/ an optimal phonemic target for examining sensorimotor adaptation to time-varying auditory perturbations.
The utterances used as stimuli in this experiment were divided into two categories: training utterances and test utterances. Each of the 10 training utterances, which were produced when auditory feedback was available, consisted of a consonant followed by the triphthong /iau/ in its first (i.e., high-flat) tone, denoted as /iau55/ (Table 1, left column). Ten test utterances,
sensorimotor adaptation across phonemes and phonemic categories; they comprised a mixture of different vowels (Table 1, right column). These included the same triphthong /iau55/ as in the
training set, the triphthongs /iou55/ and /uai5 5/, the diphthongs /ia55/ and /au55/, and the
monophthong /a55/. A fourth-tone (i.e., high-falling) variant of /iau/, namely /iau51/, was also
included in order to examine the transfer of the adaptation across tones. All the characters (i.e., syllables) in the stimulus list were verbs in Mandarin.
Carrier phrase: [ ] (/[ ] tgnr/) Training
GiJ
/piau55/ f|/taiau55/M /piass/ 2/phiauss
Y7
/piau/ )|/ u/N1 /tiau5/ 'j!0Iiaus5/
& [/tr.iaus.s/ j!IJ /riauss/
Test /ta 5/3S/c a,
Table 1. List of stimulus utterances and their IPA transcriptions. The left half of the list
shows the training utterances, during which auditory feedback of speech was played through the earphones. The right half shows the test utterances, which were masked by noise (see text for details).
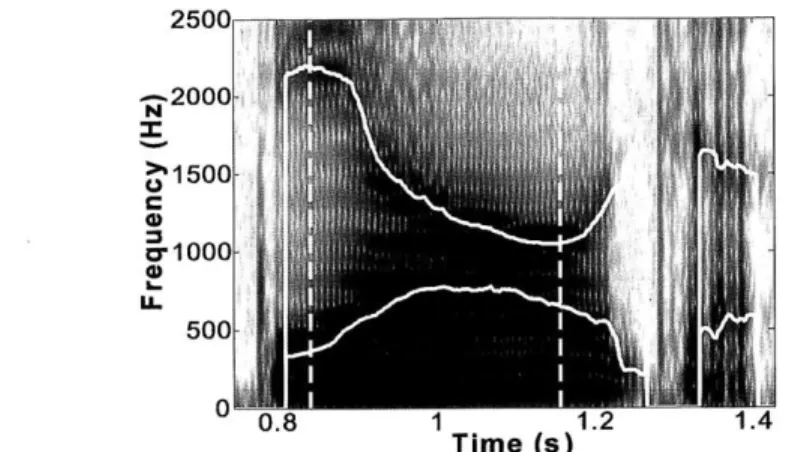
The syllables containing /iau/ or the other vowels were embedded in the carrier phrase /Ciau55 tr/, with C representing an onset consonant (See Table 1). Figure 1 shows an example
spectrogram of a training utterance produced by a male subject. Semantically, the second
syllable /§/ denotes the continuous aspect of the verb in the first syllable (similar to the English suffix "-ing"). This embedding increased the naturalness of the production; it also facilitated the online detection of the end of the vowels (see Section 2.4). Since all but one vowel used in the current experiment had the first tone, the phonetic subscripts for the first tone (/55/) are omitted in the following parts of this thesis, for simplicity of notation.
25OOr -2000-71 1500 cr-1000-500 0.8 1 1.2 1.4 Time (s)
Figure 1. Spectrogramn and parsing of the training utterance. A spectrogram of the utterance /tiause tpir/ spoken by a male speaker is overlaid with F1 and F2 tracks estimated online by the experimental apparatus. The two vertical dashed lines indicate the beginning and end of the triphthong liause5/, automatically delineated online using heuristics described in Section 2.4. 2.3. Apparatus for formant estimation and shifting
Experimental sessions were conducted in a sound-attenuating audiometric booth (Eckel Acoustic). The subject was seated comfortably in front of a computer monitor, on which the stimulus utterances were displayed at a rate of once per 2.5 - 2.75 s. The inter-trial intervals were randomized to help reduce boredom due to repeated presentation of the same set of stimuli. The subject wore a head band, to which a condenser microphone (Audio-Technica AT803) was attached and was positioned at a fixed distance of approximately 10 cm from the mouth. Auditory feedback to the subject of his or her own speech was delivered through a pair of insertion earphones (Etymotic Research ER-3A), which provided attenuation of air-conducted sound by approximately 25 - 30 dB.
During pronunciation of the utterances, frequencies of the first and second formants (F1I and F2) were estimated in near-real time using AR-based linear predictive coding (LPC). LPC was performed only during the voiced portions of the speech, as detected with a short-time root-mean-square (RMS) threshold. The LPC analysis was calculated over 17.3-ms windows. LPC orders of 13 and 11I were used for male and female speakers, respectively. To improve the quality of formant estimation for high-pitched speakers, low-pass cepstral liftering and dynamic-programming formant tracking (Xia and Espy-Wilson, 2000) were performed in conjunction
with the LPC. The tracked formant frequencies were then smoothed online with a 10.67-ms window. This smoothing used a weighting of the samples with the instantaneous RMS amplitude of the signal, which effectively emphasized the closed phase of the glottal cycles and reduced the impact of the sub-glottal resonances on the formant estimates.
As in previous studies of vowel formant frequency perturbation (Purcell and Munhall, 2006b; Villacorta et al., 2007), frequency shifting of F1 was achieved by digital filtering that substituted pole pairs on the z-plane. However, unlike in previous formant perturbation studies, which used filters that shift formant frequency by fixed ratios, the filters used for perturbation in the current study were time-varying and tailored to the time-varying characteristics of the triphthong /iau/. They shifted the formant frequencies on a frame-by-frame basis in specific ways that alter the curvature of the F l xF2 trajectory of the triphthong /iau/ (see Section 2.6 for details). Direct measurements indicated that the total processing delay of this feedback system was 14 ins.
2.4. Automatic extraction of the triphthong /iau/
The triphthongs /iau/ in the stimulus phrase /Ciau ty/ were extracted online using the
following set of heuristic rules on the frequency of Fl and F2 and their respective formant velocities (dF1/dt and dF2/dt). A triphthong /iau/ was considered to begin when the following speaker-independent criteria were satisfied (See the first dashed line in Fig. 1):
200 Hz < F1 < 800 Hz; and 800 Hz < F2 < 3000 Hz; (1)
dFJ/dt > 375 Hz/s; dF2/dt < 375 Hz/s; and dFJ/dt - dF2/dt > 375 Hz/s; (2)
Criterion (1) ensures that the values of Fl and F2 are in a region appropriate for /i/, while Criterion (2) stipulates that the directions of changes in Fl and F2 are appropriate for an /i/-to-/a/ transition. Once a triphthong starts, the end of the triphthong occurs if and only if the following exit criterion is met (the second dashed line in Fig. 1),
This criterion can effectively detect the cessation of the /iau/ because the /u/ component of the triphthong, which has a low F2, was followed by the retroflex affricative /ty/, which has a relatively high F2 (see Fig. 1 for an example).
2.5. Experiment design
As illustrated in Figure 2, an experimental session was divided into seven phases. Each phase consisted of a number of blocks. Each block contained a single repetition of each of the 10 training utterances in its first half, followed by the 10 test utterance in the second half. The order of the training and test utterances were randomized within each half of the block. During the training utterances, the subject received auditory feedback through the earphones. The level of the feedback was 16.5 dB greater than the level at the microphone, which strengthened the masking of the natural auditory feedback via bone- and air-conduction. During the test utterances, the subjects heard speech-shaped masking noise at a level of 90 dBA SPL, which adequately masked auditory feedback of vowel quality. Therefore the subject effectively produced the test utterances in the absence of meaningful auditory feedback.
-Magnitude of perturbation
I Time Pre Prac-1 Prac-2 Start Ramp tay End
(2) (4) (4) (12) (5) 10) (10) Calculation of ... Training .
perturbation field utterances
Figure 2. Experimental design for Experiment 1. The experiment was divided into seven
phases. The first three phases, Pre,Prac-1 and Prac-2, were for familiarization purposes. The next four phases, Start, Ramp, Stay and End, comprised the main experimental stages. The Start phase served as a no-perturbation baseline, at the end of which a subject-specific perturbation field was calculated (see Sect 2.6 for details). Perturbation of auditory feedback was present only in the Ramp and Stay phases. Each phase consisted of a number of blocks. The numbers of blocks are shown in the brackets. Each block was divided into two parts, the first of which contained 10 training phrases, the second of which contained 10 test utterances.
The first three phases of the experiment (Pre, Prac-1, and Prac-2) were preparatory in nature. In the Pre phase, the subject was familiarized with the experimental procedure and the stimulus utterances. In the Prac-1 phase, the subject was trained to produce the vowels in the training utterances within a level range of 78±4 dBA SPL. In the Prac-2 phase, feedback of duration of the vowel was given in an analogous way in order to train the subject to produce the vowels with a duration between 302 and 398 ms. It was discovered in pilot studies that the above-listed level and duration ranges for the training phrases were too stringent for the noise-masked test utterances due to the Lombard effect. Hence we relaxed the level ranges for the test utterances by 20%.
The Start, Ramp, Stay and End phases constituted the main portion of the experiment. Feedback about the level and duration were no longer provided in these phases, but the subject was notified when the level or duration ranges were not met. In this way, we ensured that relatively constant vocal intensity and speaking rate were maintained throughout the course of the experiment, and that these values were relatively constant across subjects.
In the Start phase, the subject received unperturbed auditory feedback. The productions of the training utterances in this phase were used to make baseline measures of vowel formants in the subject's natural productions, which provided the basis for computation of subject-specific perturbation fields (see Section 2.6). In successive blocks of the Ramp phase, the magnitude of the perturbation was linearly ramped from zero to maximum. The perturbation was maintained at the maximum magnitude (Fig. 2, top) throughout the Stay phase. In order to study the after-effects of any sensorimotor adaptation that occurred, the perturbation was discontinued for the
End phase.
Experiment 1 (using Fl perturbations) and Experiment 2 (using F2 perturbations) were based on slightly different number of blocks in the four data gathering phases. In Experiment 1, there were 12, 5, 10, and 10 blocks in the Start, Ramp, Stay, and End phases, respectively. In
After the experiment, the subject was interviewed in written form about whether he/she was aware of any perturbations to the speech auditory feedback.
2.6. Construction of the perturbation fields
2.6.1. The F1 perturbations used in Experiment 1: Inflate and Deflate
The basis of the time-varying perturbation used in this study was the perturbation field, a
region in the F 1 -F2 space where shifting of the formant frequencies occurred. Since the detailed shape and location of the F1-F2 trajectory of the triphthong /iau/ varied across speakers,
perturbation fields were designed to be subject-dependent. As exemplified in Fig. 3A, for each subject, a set of F 1 -F2 trajectories of /iau/ was automatically extracted and gathered from the
Start (baseline) phase. Two iso-F2 lines formed the boundary of the perturbation field. The F2
value of an upper boundary, F2u, was defined as the highest F2 through which at least 80% of the /iau/ trajectories passed. Similarly, a lower boundary, F2L, was defined as the lowest F2 value through which at least 80% of the trajectories passed.
A
B
2500 2400
Trajectories from single trials - Average trajectory - - - - Field boundaries 2200 - - Field boundaries
Average trajectory -* Perturbation vectors (inflate)
2000 -2000 0' Perturbation vectors (deflate)
N 1800 01500 ai 1600 IL. 1400 1000. 1200 10 0 . . ... - - .... - . . 400 500 600 700 500 600 700 800 F1 (Hz) F1 (Hz)
Figure 3. Design of the perturbation fields for the Inflate/Deflate (F1) perturbations. An example from a single subject is shown. A. Formant trajectories from 120 repetitions of /iau/ were extracted and gathered from the Start phase and were used as the basis for calculating the average trajectory and the field boundaries. B. Inflate and Deflate perturbation fields. The perturbation vectors were parallel to the F1 axis. The magnitudes of the vectors followed a quadratic function of F2, and were zero at the boundaries and greatest near the center of the field
Only F1 was perturbed in the subject's auditory feedback. The amount of the perturbation was implemented in terms of a set ofperturbation vectors, V, which defined a perturbation field.
The perturbation field was a mapping between locations in the Fl xF2 plane to perturbation vectors. Since F1 was the only perturbed formant, all perturbation vectors were parallel to the F1 axis. We took advantage of the fact that F2 varied monotonically in /iau/, and let V be a
function of F2 only. We used two different types of perturbation fields in Experiment 1, namely
Inflate fields and Deflate fields.
In the Inflate fields (Fig. 3B, darker gray arrows), the perturbation vectors point to the right and hence increased the values of F 1. The magnitudes of the vectors M follow a quadratic function of F2 which satisfied the following:
M(F21)=O, M(F2u)=O, M(F2m)=0.6-A F1,
where F2M is the average F2 value at which the maximum F 1 occurred, and AF1 is the range of F1 in the average /iau/ trajectory from the start phase (e.g., the thick solid curves in Fig. 3A).
The Deflate field (Fig. 2.3B, light gray arrows) was similar to the Inflate field, but its vectors point to the left, and hence caused a decrease in F1. The Deflate field is defined formally as:
M(F2)=O, M(F2u)=O, M(F2v) =0.375-AF1,
The 40 subjects in Experiment 1 were assigned pseudo-randomly to Inflate and Deflate groups. Twenty subjects were tested under the Inflate perturbation and 20 others under the Deflate perturbation.
2.6.2. The F2 perturbations used in Experiment 2: Up and Down - Average trajectory
- --- Field boundaries
-- Perturbation vectors (up) Perturbation vectors (down) N
U.
[a]
F1
Figure 4. Design of the perturbation fields for the UplDown (F2) perturbations used in Experiment 2. As in the Inflate/Deflate perturbations (Fig. 3), the perturbation vectors were functions of F2, and followed a quadratic function that assigned 0 perturbation magnitude at the upper and lower boundaries of the field and maximum magnitude in the approximate middle (the point of maximum Fl) However, unlike in the Inflate/Deflate fields, the Up/Down perturbation fields consisted of perturbation vectors that were parallel to the F2 axis.
In Experiment 2, we explored the adaptation to perturbation of the time course of the monotonic trajectory of F2. Instead of exerting a constant shift on the entire F2 trajectory, the perturbations in Experiment 2 shifted the F2 trajectory in a time-varying way. In a way similar to the Inflating/Deflating perturbations of Experiment 1, these perturbations led to smaller F2 shifts at the beginning and end of the triphthong and exerted the largest amount of shift in the middle. As a consequence, the starting and end points of the F2 transition during the triphthong were not altered, but its time course was perturbed. In the Up perturbation (red arrows in Fig. 4), F2 was shifted up, with the largest amount of shift occurring near the middle of the triphthong (roughly during /a/). Roughly speaking, in the Up perturbation, the rate (speed) of the F2 transition was accelerated in the first half of the triphthong and decelerated in the second half. The other type of F2 perturbation, called Down perturbation, has the opposite effect: it decelerated the F2
transition in the first half of the triphthong and sped it up that during the second half (blue arrows in Fig. Xl).
The implementation of the Down and Up F2 perturbations was similar to the implementation of the Fl perturbations. But instead of having the perturbation vector M pointing in the directions
parallel to the F 1 axis, these perturbations contained perturbation vectors parallel to the F2 axis, due to the design in which only F2 is perturbed. Similar to Equations (4) and (5), the magnitude profiles of the Up and Down perturbations followed quadratic functions that satisfy the following constraint:
M(F2L)=0, M(F2u)=0, M(F2m)=0.25-AF2, (6)
wherein AF2 = F2U - F2L- In other words, the maximum perturbation was equal to 25% of the vertical width of the perturbation field. The above equation applied to both Down and Up perturbations; the only difference between these two types of perturbations was the direction of the perturbation vector V: V points upward in the Up perturbation and downward in the Down perturbation (see Fig. 4).
As in Experiment 1, subjects were assigned pseudo-randomly to Inflate and Deflate groups. Fifteen subjects were tested under the Up perturbation and 14 others under the Down
perturbation.
2.7. Data analysis and statistical procedures
Similar methods of analysis were used for Experiments 1 and 2. The produced trajectories of Fl and F2 vs. time were smoothed by 41.3-ms Hamming windows. The track for every utterance was inspected manually. Utterances that contained production errors and/or gross errors in automatic estimations of Fl and F2 were excluded from subsequent analyses. Overall, the excluded utterances comprised 6.3% of the training utterances and 5.0% of the test utterances in Experiment 1 and 7.9% of the training utterance and 8.6% of the test utterances in Experiment 2.
Several parameters that quantify the shape and time course of the formant trajectories of /iau/ were extracted automatically. For Experiment 1, these included 1) F1Max, defined as the
maximum Fl during the triphthong, 2) F1Begin, the Fl at the beginning of the triphthong, 3) 21
F1End, the F 1 at the end of the triphthong, 4) F2Mid, the value of F2 at the time when F 1 Max
occurs, and 5) A-Ratio, the ratio between the time when FIMax occurs and the total duration of the triphthong (see Fig. 6A). For Experiment 2, two additional measures parameters were used:
6) F2Begin, the F2 value at the beginning of the triphthong, and 7) F2End, the F2 at the offset of
the triphthong.
To compute average formant trajectories across multiple subjects, each subject's Fl and F2 trajectories were normalized linearly to [0,1] intervals, respectively. Normalization of F2 was done between F2L and F2u as defined in Section 2.6; normalization of Fl was done between FIL and Flu. FIL was defined as the minimum value of the Fl in the average trajectory of the
training vowel /iau/ between F2L and F2u in the Start phase; F1u was defined as the maximum value of Fl of the same average trajectory.
For the vowels in the test utterances, the parameter FlMax was defined in the same way and extracted automatically, with exception of the monophthong /a/, for which FIMax was defined as the average F 1 between the 40% and 60% points of normalized time.
To test for the significance of adaptation of a parameter in the training vowel /iau/, data from a subject were averaged across all blocks and all trials within the Start and Stay phases,
respectively, as well as End-early and End-late phases. End-early phase was defined as the first two blocks of the End phase, in order to capture the after-effect of the adaptation following the cessation of the perturbations. End-late was defined as the remaining blocks of the End phase, in order to quantify the decay toward the baseline production. These data were then subject to repeated measures analyses of variance (RM-ANOVA) with Huynh-Feldt correction for violation of the sphericity assumption. The RM-ANOVA contained a between-subjects factor:
Group ({Inflate, Deflate}), and a within factor: Phase ({Start, Stay, End-early, End-late}). For
post hoc comparisons, we followed the least significant difference (LSD) test paradigm of Fisher (1935, see also Keppel, 1991) in controlling family-wise errors. For each vowel and trajectory measure, two types ofpost hoc analyses were undertaken: 1) comparisons within a group
between phases were performed only if the main effect of Phase is significant in that group (a=0.05); and 2) between-group comparisons within a phase were performed only if the omnibus test indicates a significant interaction between Group and Phase (a=0.05). The second approach
is more statistically sensitive than the first one. One-tailed t-tests (a=0.05) were used for these
post hoc comparisons on the F1 data (in Figs. 7B and 10A, B, F, G, and H). The one-tailed test
was justified by the existence of a set of a priori hypotheses based on previous findings based on F 1 perturbations (e.g., Houde, 1997; Houde and Jordan, 2002; Purcell and Munhall, 2006b; Villacorta et al., 2007) regarding the directions of the changes in the trajectory measures: on average across the subjects, they should change in the directions opposite to those in the auditory feedback perturbation. For the F2 data, two-tailed post hoc tests were used.
3. Results
3.1. Experiment 1: Adaptation to the time-varying perturbation of the auditory feedback of
F1
Of the 40 subjects who participated, data from 36 were used in subsequent analyses. The
data from the other four subjects were judged to contain high proportions of trials with suboptimal formant estimation according to an automatic objective procedure 11, and were excluded from further analysis. Of the 36 subjects, eighteen (mean age mean ± SD: 26.7±4.1, 10
males) comprised the Inflate group and eighteen (mean age ± SD: 28.2±6.9, 10 males) the Deflate group. None of the 36 subjects reported being aware of any perturbation to their auditory
feedback in an interview after the experiment.
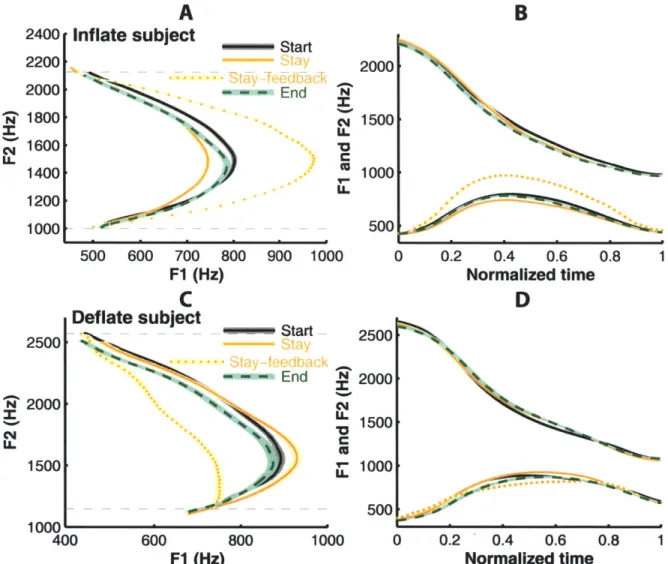
Representative results from one of the subjects (IH) who experienced the Inflate perturbation are shown in Fig. 5 (A and B). Panel A shows average trajectories for the training vowel, /iau/, in the F1-F2 space; panel B shows those trajectories vs. normalized time. In Panel A, the difference between the average trajectories from the Stay phase productions (solid gray curves) and
auditory feedback (dotted curve) shows the effect of the Inflate perturbation, which increased the maximum F 1 (Fl Max) of the triphthong without altering the values of F 1 at the beginning
(F 1 Begin) or end (F 1 End) of the triphthong. During the Stay phase, the curvature of the Fl -F2 trajectories in the auditory feedback was increased: compared to the average trajectory in the
Start phase, the average Stay-phase trajectory showed a marked decrease in FIMax (indicative of
compensation for the perturbation), while the F1 values at the beginning and end of the
triphthong were changed by much smaller amounts. This pattern of F 1 change led to a reduced curvature of the produced F1-F2 trajectory in the Stay phase. The subject made this adjustment as in an effect of bringing the shape of the formant trajectory in the auditory feedback toward its pre-perturbation baseline. However, this adjustment only partially compensated for the effect of the perturbation. If the compensation were complete, the auditory feedback in the Stay phase (dotted curve) would have overlapped with the average Start-phase trajectory. The average
trajectory from the End phase (after cessation of the perturbation) lay roughly between the trajectories from the Start and Stay phases, which indicated (1) a significant after-effect of
articulatory compensation and (2) a decay of this after-effect toward the pre-perturbation baseline. There were changes in the F2 trajectory over the three phases of the experiment (Fig.
5B), but these changes were small compared to the compensatory changes in F 1.
2500. 2000 1500 1000-Inflate subject ---500 600 700 F1 (Hz
C
Deflate subject Start End N C c-LL 800 900 1000 --- a Ed End 0 0.2 0.4 0.6 0.8 1 Normalized timeD
2500 2000 15001 10001 500 400 600 800 1000 0 0.2 ' 0.4 0.6 0.8 1 F1 (Hz) Normalized timeFigure 5. Adaptive changes in the formant trajectories of the training vowel liaul under the
Inflate and Deflate perturbations in representative subjects. The F1-F2 trajectories produced by subject IH of the Inflate group are plotted in the formant plane (A) and as functions of time
(B). Different line patterns (color version online) indicate different phase of the experiment (see legend). The dashed curves show the perturbed auditory feedback. The shading surrounding the curves show ±3 SEM. The profiles of F1 and F2 in panel B are normalized in time. Panels C and
D show analogous results from subject DF of the Deflate group.
2400 2200 2000 1800 1600 1400 1200 1000
Figure 5C and D show representative results from a subject in the Deflate group (DF). As the dashed curves show, the Deflate perturbation decreased the F1 value in the subject's auditory feedback for the part of the trajectory that passes near the target for the vowel /a/ while
preserving Fl at the initial and final components of the triphthong. The subject responded to this perturbation in the Stay phase by increasing the extent of movement of F 1 in her production,
such that Fl in the most perturbed region near the center of the perturbation field was selectively increased. By comparison, the changes in Fl at the two boundaries of the perturbation field, i.e., at the beginning and end of the vowel, remained essentially unaltered. As with the previous
subject, who received the Inflate perturbation, this compensation had a comparatively small magnitude and effectively cancelled only a small fraction of the Deflate perturbation. However, unlike in the previous example, in this subject an average End-phase after-effect was not evident, due to a rapid decay of the after-effect.
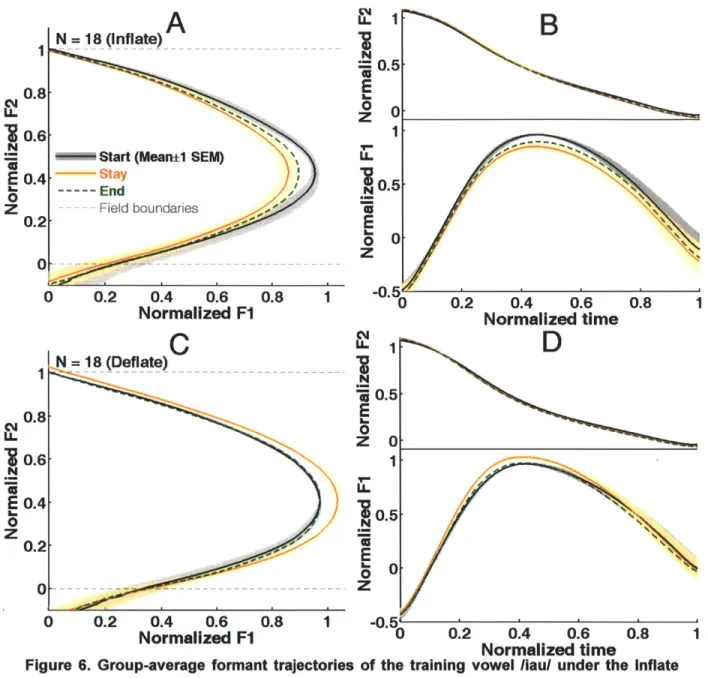
N = 18 (Inflate)A 0 0.2 0.4 0.6 Normalized F1
C
= 18 (Deflate) 0.8 1 0.4 0.6 Normalized timeD
0 0.2 0.4 0.6 0.8 1 -0.5r Normalized F1 0 0.2 0.4 0.6 0.8 Normalized timeFigure 6. Group-average formant trajectories of the training vowel liaul under the Inflate
and Deflate perturbations in Experiment 1. F1 and F2 were normalized with respect to the
perturbation-field boundaries. A: The mean F1-F2 trajectories of the Inflate group. B: The time-normalized trajectories of F1 (bottom) and F2 (top) of the Inflate group. Panels C and D: analogous results for the Deflate group. The shading shows ±1 SEM of the mean across subjects. The SEM is not shown for the End-phase trajectory for visualization purposes.
The group average trajectories in the Start, Stay and End phases are shown in Fig. 6. These trajectories are normalized by the subject-specific bounds of F1 and F2 (see Methods Section
2.7) and then averaged across all subjects in each perturbation group. The shading around the
mean curves shows ±1 standard error of the mean (SEM) across the subjects. The SEMs of the End-phase averages are omitted for the clarity of visualization; otherwise, they would partially
27 0.8 0.6 E 0.4 0
Z
obscure the other trajectories. Significant changes in the formant trajectory of the triphthong /iau55/ in the Stay phase in both groups are evident in Fig. 6. These changes were in directions
opposite to the auditory perturbations. In the Inflate group, the peak Fl and the curvature of the trajectory deceased during the Stay phase, whereas in the Deflate group, it increased in the Stay phase. The differences in the temporal profiles of F2 between the Start and Stay phases were
substantially smaller compared to the F 1 changes. They are hardly visible in the time-normalized plots (top parts of Fig. 6B and D) and didn't reach statistical significance for either group,
indicating that the compensatory changes in production were mainly specific to F1. In both groups, the End-phase average trajectory was situated roughly midway between the Start- and Stay-phase trajectories. Overall, these observations indicate that at the group level, there were modifications of the subjects' feedforward motor commands for /iau/, which were manifested as
after-effects.
A notable feature of the group-average compensatory responses is that these articulatory
changes mirrored the time-varying effect of the perturbation field throughout the triphthong movement. The most pronounced effect of the perturbations of Fl values occurred at its peak value (FIMax). The changes at F1Begin (where normalized F2 = 1) and at FIEnd (where
normalized F2 =0) were appreciably smaller compared to the changes in F1Max. This adaptation pattern is indicative of a movement controller capable of subtle spatiotemporal modifications of articulator trajectories (or motor programs) in response to sustained, selective modifications of the sensory consequences of highly practiced movement patterns (in this case, for triphthongs).
A. B. F1Max C. F1 Begin
2 30,W 10
A-Ratio= Duri Dur 30
20 10 5 (0 F2Mid - -- 10 0 L-20 eate -5 0. -deflate LL F1 Max --- Ca~~8 10 FM -- - - - - -- - - - -- -30 -40 eate
- - - - Start Stay End-early End-late
Start Stay End-early End-late
Time
D. F1 End E. F2Mid F. A-Ratio
5g 0.01 5 E0 0 0 I I I -- 0.005 C -15 ~-100 E -20 -inflate -2 < 0.01 3-deflate e -20 e &, & 0.015 -C p<0.05
Start Stay End-early End-late Start Stay End-early End-late Start Stay End-early End-late
Figure 7. Quantification of adaptive changes in several trajectory parameters for the
training vowel liaul under the Inflate and Deflate perturbations in Experiment 1. In A, the
definitions of the parameters of the F1 and F2 trajectories of the triphthong /iau/ are shown schematically (see text for details). B. The change of F1 Max (maximum F1 during /iau/) from the Start-phase mean in the Stay and End phases. The End phase is subdivided into "End-early' and
"End-late", in order to show the after-effect of the adaptation in the Stay phase and its decay. The End-early and End-late phases included the first two and the last eight blocks of the End phase,
respectively. The error bars shown mean±1 SEM across all 18 subjects in each group. The brackets with dots indicate significant change of F1 Max from the Start-phase baseline. The gray-shaded regions with asterisks indicate significant differences between the Inflate and Deflate groups according to two-sample t-tests. C - F. The changes re Start-phase mean in F1 Begin, F1 End, F2Mid and A-Ratio are shown in the same format as Panel B. Note the differing vertical scales differ from one panel to the next.
To quantify the changes in these trajectory parameters, we performed repeated measures analysis of variance (RM-ANOVA) on FIMax, FIBegin and FIEnd. The RM-ANOVA
contained a between-subjects factor (Group) and a within-subject factor (Phase). For FIMax, the
two-way interaction Group xPhase was significant (F(3,102)=9.56, p<0.0001, Huynh-Feldt
correction) , which indicated that the two types of perturbations resulted in changes in the subjects' productions in different manners and with appropriately opposite directions across the experimental phases. Fig. 7B shows the changes in FIMax from the Start-phase baseline to the
Stay phase and then the early and late parts of the End phase. Between-group post hoc t-tests of
the amounts of Fl Max change (from Start-phase baseline) in the Stay, End-early and End-late
phases indicated significant differences between the two groups in the Stay and End-early phases
(asterisks in Fig. 7B). In addition, the main effect of Phase was significant in both groups
(Inflate: F(3,51)=7.90, p<0.001; Deflate: F(3,51)=3.29, p<0.05). Post hoc comparison within the Inflate group indicated that significant decreases of Fl Max from its Start-phase baseline
occurred in Stay (p<0.05), End-late (p<0.01), and End-early (p<0.05) phases. In the Deflate group, the same post hoc comparison revealed significant changes from the Start-phase baseline in the Stay and End-early phases (p<0.05), but not in the End-late phase (dots in Fig. 7B).The above pattern of statistical results confirmed the significance of the compensatory response in F1Max in the Stay phase, and of the after-effect of this response in the End-early phase. The lack of significant between-group difference in the End-late phase was most likely due to the gradual decaying of the after-effects following the return of the auditory feedback to the unperturbed condition.
By contrast, the RM-ANOVA on Fl Begin didn't indicate a significant GroupxPhase
interaction (F(3,102)=2. 11, p>O.1, Fig. 7C). The main effect of Phase was not significant in either group (p>0.25). The GroupxPhase interaction for FiEnd merely approached significance
(F(3,102)=3.02, p=0.055,). The main effect of Phase was significant only in the Inflate group
(see Fig. 7D). These results indicate that, although on average there were some compensatory adjustments to the value of Fl at the upper and lower boundaries of the perturbation field, these changes were smaller and statistically weaker compared to the change of F 1 Max at the center of the field. Therefore, the adaptive corrections subjects made to their formant trajectories were primarily a change in the shape of the trajectory, rather than a simple "translational" movement of the entire trajectory in the direction opposite to the perturbation. This is consistent with the observations of the group-average trajectories which indicate that the compensations in the
subjects' productions reflected the time-varying nature of the perturbation magnitude.
In contrast to the significant effects of the perturbations on F 1 trajectory of the triphthong, the F2 trajectory didn't show statistically significant alterations. As Fig. 6E shows, the changes
in F2Mid (the value of F2 at the time when F 1 Max occurs) across the phases were small and
unsystematic. The RM-ANOVA on F2Mid indicated neither a significant GroupxPhase interaction (p>O.1) nor a significant main effect of Phase in either group (p>0.05).
The analyses discussed so far are only concerned with the spatial (magnitude) aspects of the formant trajectories, and are not directly concerned with the temporal properties of the /iau/ trajectory. We also analyzed whether any change in the relative timing of the trajectory peak as it passes through the target region for /a/ was elicited by the perturbations. As Fig. 6F shows, A-Ratio, which quantifies the relative timing of the peak F1 in the triphthong (see definition in Fig.
6A), didn't show systematic changes across the experimental phases in either group. The
GroupxPhase interaction for A-Ratio was very weak and non-significant (p>0.9), and so was the main effect in both groups (p>0.5). In fact, given the very small magnitude of the changes in A-Ratio (<2% normalized time) in both groups, it can be seen that the relative timing of the F 1 peak was preserved rather strictly when the compensatory responses occurred.
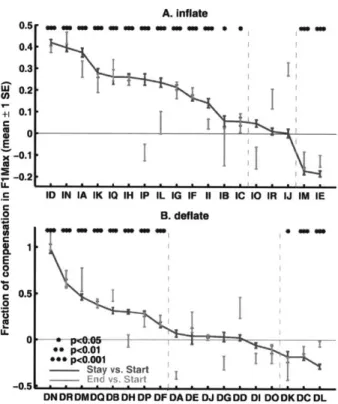
A. Inflate aS as uS a aS minu uSa me W 0.2. +10.1 C E 1-0.1 V_-0.2 , ID IN IA IK 10 IH IP IL IG IF 11 IB IC 10 IR IJ IM IE C .C B. deflate 1 110 6W *0 6W 61 1 * E 8 S 0 0T 00 <0.01 ** p<.001 - Stay vs. Start - End vs. StartI DN DR DMDQ DB DH DP DF DA DE DJ DGDD DI DO DK DC DL
Figure 8. Amount of adaptation for the training vowel liaul in individual subjects under the
Inflate and Deflate perturbations in Experiment 1. Fractions of compensation in F1Max with
respect to the auditory perturbations are shown. The upper and lower panels show the subjects in the Inflate and Deflate groups, respectively. Positive values in both panels indicate compensatory changes, i.e., changes in productions in the direction opposite to the auditory perturbations. A value of 1.0 corresponds to complete compensation. In each group, the subjects are shown in descending order. The error bars show mean±1 SEM across the trials. The asterisks show significance Stay-phase changes from the Start phase (two-sample t-test). Most of the subjects who showed significant compensatory responses in the Stay phase demonstrated a significant after-effect of these responses in the early End phase, as indicated by the gray bars. In each panel, the vertical dashed gray lines divide the subjects into three subgroups: a group that showed significant adaptation in FlMax, a group that showed no change, and a group that followed the auditory perturbation in their F1 Max.
The F1-F2 trajectories and the temporal profiles in Fig. 6 show group-average trends in adapting to the auditory perturbations. To illustrate the variability of responses among individual subjects to the time-varying auditory perturbation, Fig. 8 shows fractions of compensation to the FIMax perturbations in the Stay phase for each subject. Fraction of compensation is defined as the fraction of the auditory perturbations that was counteracted (i.e., cancelled) by the
compensatory changes in production. In both panels of Fig. 8, positive values indicate
compensatory adjustments to productions, while negative ones correspond to production changes
thatfollowed the perturbations. The subjects in these plots are arranged in descending order of
the fraction of compensation. The plots show that there is substantial variability of compensatory responses among the subjects. In the Inflate group, 13 of the 18 subjects showed significant adaptations to the perturbation in the Stay phase; three did not show significant Stay-phase responses; while two other subjects showed articulatory changes that followed the direction of the perturbation (t-test of the values of F1Max in the Start and Stay phases, a=0.05 uncorrected). It can also be seen from the gray bars in Fig. 8A that almost all of the Inflate-group subjects who compensated for the perturbation in the Stay phase demonstrated significant after-effects in the early End phase. A similar pattern was seen in the Deflate group, in which eight of the 18
subjects compensated for the perturbation in the Stay phase; seven showed no changes; and three others followed the perturbation in their productions. As in the Inflate group, all but one of the Deflate subjects who showed significant Stay-phase compensation showed significant
after-effects in the early End phase. The average fraction of Stay-phase compensation in the Inflate and Deflate groups were 15.7% and 16.1%, respectively (approximately equal).
3.2. Experiment 1: Transfer of the adaptive responses to the test utterances under the F1
perturbation
To study the pattern of generalization of the auditory-motor adaptation trained with the triphthong /iau/ to other vowels, the production of utterances containing /iau/ were interleaved with utterances containing the vowels /iau/, /iau5 1/, /uai/, /a/, /ia/, /au/, and /iou/, which were produced only under auditory masking. Because the test of generalization requires significant adaptation on the training vowel /iau/ as a precondition, the subsequent analyses included the data from only the 21 subjects (13 Inflate, 8 Deflate, see Fig. 7) who showed significant Stay-phase compensation. Figure 9 illustrates the relationships between these test vowels and the
training vowel by showing the frequency-normalized Start-phase trajectories of plotted in the same F1-F2 plane. For comparison, the trajectory of the training vowel /iau/ (pronounced without masking noise) is plotted in the same figure as the thick solid curve.
lau (training) au uai cm 0.8 - a U- u 0.6 E 0.4 0
Zo0.
2 -0.5 0 0.5 1 Normalized F1Figure 9. The relations of the test vowels to the training vowel in formant space (Experiment 1). Data in this plot are from the baseline (i.e., Start-phase) productions of all the 21
subjects (13 Inflate, 8 Deflate) who showed significant compensatory adjustment to the auditory perturbation in the training utterances (see Fig. 7). The average Start-phase trajectories of the vowels in the test utterances are plotted in the same formant plane to illustrate their relationship to the trajectory of the training vowel /iau/.
It can be seen that the locations and shapes of the average trajectories of /iau/ and /iau5lI/ in the test utterances closely resembled that of /iau/ in the training utterances. Furthermore, the trajectory of the triphthong /uai/, the serially reversed version of /iau/, nearly overlapped the trajectories of the /iau/-type triphthongs. The two diphthongs /ia/ and /au/ had formant
trajectories partially overlapping those of the /iau/-type triphthongs near the regions of /i/ and /u/, which are the beginning and end points of these two diphthongs, respectively. However, their trajectories had slightly higher F1 values in the /a/ portions than the triphthongs, which is not unexpected because /a/, a via-point for /iau/, is an end point for each of the diphthongs. For a similar reason, the monophthong /a/ had a greater F1 than the FIMax of iau/. The trajectory of the triphthong /iou/ (in the leftmost part of Fig. 9) had a curved shape that resembled the bow
shape of the trajectory of /iau/. In particular, /iou/ has a monotonically decreasing F2 similar to that of /iau/ and a rise-fall trend in F1. However, the absolute F 1 values at all the three
components of /iou/ were lower than those of /iau/, making it the test vowel most distant from the training vowel (/iau/) in F 1 -F2 space.
A three-way RM-ANOVA was performed on the FIMax measure for all the test vowels.
This RM-ANOVA included one between-subject factor Group, and two within-subject factors, namely Phase ({Start, Stay, End-early and End-late}) and Vowel ({/iaul, /iau5i/, /uail, /a/, ia/, /au/, /iou/}). The only significant main effect was Vowel (F(6,114)= 170.6, p~O), which was not surprising given the distinct peak F1 values in the different test vowels (see Fig. 9). The two-way interaction GroupxPhase reached significance (F(3,57)=4.45, p<0.02), indicating that under the between-group comparison, when all the test vowels are considered as a whole, there was significant generalization of the adaptations from the training vowel /iau/. Within the individual groups, the main effect of Phase was significant in the Deflate group (F(3,21)=4.26, p<0.05) but was not significant in the Inflate group (p>0.2). Therefore, it can be seen that the generalization of the adaptation is statistically less significant than the adaptation itself (see Section 3.1)
To reveal the fine structure in the generalization patterns, we next examined the
generalization to each of the individual test vowels. The perturbation-induced changes in the time-normalized F1 trajectories of the test vowels are summarized in the curve plots in Fig. lOB-H. For comparison, the average Start- and Stay-phase F1 trajectories of the training vowel /iau/
from the 21 subjects are plotted in Fig. 1 OA. Because these subjects constituted the subgroups that showed significant adaptations, the differences between the average Start- and Stay-phase trajectories in Fig. 1OA are larger than the whole-group results shown in Fig. 6B and D. The test
vowel /iau/ (Fig. 1 OB) was the same vowel as the training vowel, but was produced under masking noise. Compared to the changes in the training vowel /iau/ shown in Fig. 1 OA, the test vowel /iau/ showed smaller changes from baseline in the Stay phase (Fig. 1 OB). The main effect of Phase approached significance in the Deflate group (p=0.056), and failed to reach significance in the Inflate group (p>O. 1). However, there was a significant GroupxPhase interaction
significance for both the Stay and End-early phases (Fig. lOB). Therefore, although the
adaptation was transferred only partially from the unmasked training condition to the masked test condition, the transfer was significant if the between-group difference was considered.
A. /lau (training) B. /lau
- Start (Meent1 SEM)
1 Ste 0.5 Inflate (N=13) deflate (N=S) D. /ual/ 4=2) inflate (N=13) deflate (N.1) E Start StayEnrd-eartyEnd-late E. /a/ F. /la/ W 40 1d5 ,-Inlate S Sdetlate G20./uHlu 0 Inflate (N=13) deflate (N=B) Star StayEnd-eaiEnd-tate G. Iau/ F H. AoWd 40 -10 30 -10
Inflate (N=13) deflate (N=$) Inflate (N.13) deflate (N=8) -20
0 0.2 0.4 0.6 0.8 0 02 0.4 0.6 0.8 1 0 Start StayEnd-early End-late 0 0.2 0.4 0.8 08 0 0.2 0.4 0.8 0.8 1 Start Stay
End-eartyEnd-Normalized time Norm~alized time
Figure 10. Generalization of the auditory-motor adaptation to the test utterances in Experiment 1. Data from the 13 subjects in the Inflate group and the eight subjects in the Deflate group who showed significant Stay-phase adaptation in the training utterance. Panel A shows the average time- and frequency-normalized F1 trajectories of the training vowel /iau/ from the Inflate (Left) and Deflate (right) groups in the Start and Stay phases. The right-hand plot in Panel A shows the average FlMax changes from baseline in the Stay phase and early and late parts of the End phase. The format of this plot is the same as Fig. 3.4B, in which brackets with filled dots show significant within-group, between-phase changes, and gray shading with asterisks show significant between-group differences. Panels B-H have the same layout as A; they show the data from the seven test vowels: /iau/, /iau51/, /uai/, /a/, /ia/, lau/, and /iou/. The dashed vertical lines in
panel E show the time intervals from which F1 Max was calculated. Note the varying vertical scales.
The generalization across the tonal difference is illustrated in Fig.