Development and Implementation of the
SPHERES-Slosh Experiment
by
Dustin Luke Hayhurst
B.S., Astronautical Engineering (2012)
United States Air Force Academy
MASSACHUSETTS INW-fR7TE OF TECHNOLOGY
JUN 16 2014
LIBRARIES
Submitted to the Department of Aeronautics and Astronautics
in partial fulfillment of the requirements for the degree of
Master of Science in Aeronautics and Astronautics
at the
MASSACHUSETTS INSTITUTE OF TECHNOLOGY
June 2014
This material is declared a work of the United States Government and
is not subject to copyright protection in the United States
Auo-Signature
redacted
Author ...
"Department of Aeronautics a'ndisonautics
Certified by...
Signature redacted
May 22, 2014
Accepted by...
Alvar Saenz-Otero
Principal Research Scientist
Thesis Supervisor
Signature
redacted-Paulo C. Lozano
Associate Professor of Aeronautics and Astronautics
Chair, Graduate Program Committee
Disclaimer: The views expressed in this thesis are those of the author and do not reflect the official policy or position of the United States Air Force, the United
Development and Implementation of the SPHERES-Slosh
Experiment
by
Dustin Luke Hayhurst
Submitted to the Department of Aeronautics and Astronautics on May 22, 2014, in partial fulfillment of the
requirements for the degree of
Master of Science in Aeronautics and Astronautics
Abstract
Understanding fluid slosh in a microgravity environment has the potential to make liquid-fueled spacecraft more effective. The SPHERES-Slosh Experiment gathers benchmarking data that can be used to validate computational fluid dynamics models for microgravity environments. This thesis discusses the design of the SSE hardware and the control theory used on the International Space Station during test sessions. This thesis proposes future control theory and design work.
Thesis Supervisor: Alvar Saenz-Otero Title: Principal Research Scientist
Acknowledgments
Contents
1 Introduction 13
1.1 M otivation . . . . 13
1.2 Literature Review . . . . 14
1.3 O utline . . . . 16
1.3.1 Chapter Two: SPHERES-Slosh Experiment Design . . . . 16
1.3.2 Chapter Three: ISS Operations . . . . 17
1.3.3 Chapter Four: Proposed Control Theory and Design . . . . . 17
1.3.4 Chapter Five: Conclusions and Future Work . . . . 17
2 SPHERES-Slosh Experiment Design 19 2.1 Requirements . . . . 19 2.1.1 Functional Requirements . . . . 20 2.1.2 Form Requirements . . . . 21 2.2 System Design . . . . 23 2.2.1 System Overview . . . . 23 2.2.2 Camera System . . . . 26 2.2.3 Tank . . . . 31
2.2.4 SSE Avionics Box . . . . 33
2.2.5 Structure . . . . 36
2.3 Safety Analysis . . . . 39
3 Control Theory and Design Implemented during International Space Station Operations
3.1 System Identification . 3.1.1 Purpose ... 3.1.2 Theory ...
3.1.3 Results and Analysis
3.2 Open-Loop Controller . . .
3.2.1 Purpose . . . .
3.2.2 Theory . . . .
3.2.3 Results and Analysis
3.3 Summary . . . .
4 Control Theory and Design
4.1 Proportional, Proportional-Derivative, Controllers . . . . 4.1.1 Purpose . . . . 4.1.2 Theory . . . . and Proportional-Integral-Derivative . . . . 65 . . . . 65 . . . . 66 4.1.3 Application to SPHERES . . . . 4.1.4 Proposal for the SPHERES-Slosh Experiment 4.2 Simple Adaptive Controller . . . .
4.2.1 Purpose . . . . 4.2.2 Theory . . . . 4.2.3 Simulated Results . . . . 4.3 Control Theory and Design Summary . . . .
5 Conclusions and Future Work
49 49 50 50 54 55 56 56 57 63 65 72 79 88 88 89 93 95 97 . . . . . . . .
List of Figures
2-1 Characteristics of various testing environments which have been used
for SPHERES projects. Credit: Bryan McCarthy. . . . . 22
2-2 The SSE mounted on air carriages. Credit: FIT. . . . . 25
2-3 iDS UI-5580CP camera augmented with Navitar lens and mount -side view. Credit: FIT. . . . . 27
2-4 Camera mounted on SSE structure using sliding dovetail and pin with attached Ethernet and power cables. Credit: FIT. . . . . 28
2-5 Deployed baffles - side view. Credit: FIT. . . . . 29
2-6 Backdrop with covered LED strip shown - front view. Credit: FIT. 30 2-7 Hood with non deployed baffles - front view. Credit: FIT. . . . . 31
2-8 40%-filled SSE tank - front view. Credit: FIT. . . . . 32
2-9 40%-filled SSE tank - bottom view. Credit: FIT. . . . . 33
2-10 SSE avionics box - top-front view. Credit: FIT. . . . . 35
2-11 SSE avionics box - bottom-back view. Credit: FIT. . . . . 35
2-12 SSE center hub - bottom view. Credit: FIT. . . . . 37
2-13 SSE center hub - side view. Credit: FIT. . . . . 38
2-14 SSE frame arm - side view. Credit: FIT. . . . . 39
2-15 High-level control structure for SSE. . . . . 42
2-16 Selected loop in technical system. . . . . 43
2-17 Information sent on communication links . . . . 45
3-1 The SSE floats in the microgravity environment of the ISS during the successful checkout test session. Credit: NASA. . . . . 50 3-2 The SSE floats in the microgravity environment of the ISS during the
successful Science 1 test session. Credit: NASA. . . . . 55 3-3 Open-loop x translation maneuver from aft view. Credit: FIT. . . . . 59
3-4 Empirical results from SSE science 1 test session: index number 7; primary SPHERES satellite. . . . . 60 3-5 Empirical results from SSE science 1 test session: index number 7;
secondary SPHERES satellite. . . . . 61
4-1 The local reference frames of the SPHERES satellites and SSE in stan-dard configuration. Credit: FIT . . . . . 79
4-2 Root locus of plant with PD controller H(s) . . . . 90
4-3 Root locus of the augmented plant Ga(s) . . . . 91
4-4 Block diagram representation of the adaptive control strategy . . . . 93
4-5 Step response of plant with adaptive controller. Solid lines = nominal, dashed = uncertain. . . . . 94 4-6 Step response of plant with PD controller C(s). Solid lines = nominal,
dashed = uncertain. . . . . 94 4-7 Step response of plant under an unkownn perturbation with adaptive
controller. Solid lines = nominal, dashed = uncertain. . . . . 95
4-8 Step response of plant under an unknown perturbation with PD con-troller C(s). Solid lines = nominal, dashed = uncertain. . . . . 95
List of Tables
2.1 Camera specifications. . . . . 26
2.2 Meanings and colors of SSE SAB LED lights. . . . . 34
2.3 Control actions and hazards. . . . . 46
3.1 Table of test runs during the SSE science 1 test session. * denotes an
unconfirmed value. . . . . 58
4.1 Maximum and minimum inertia matrix values (kgm2), centers of grav-ity (m), and mass (kg) of fluid in 40%-filled tank. . . . . 80
4.2 Maximum and minimum inertia matrix values (kgm2), centers of grav-ity (m), and mass (kg) of fluid in 20%-filled tank. . . . . 80
List of Acronyms and Initialisms
AFS - Aurora Flight Sciences
ASPR - Almost Strictly Positive Real
CFD - Computational Fluid Dynamics
DARPA -Defense Advanced Research Projects Agency
DOF - Degree of Freedom DSP - Digital Signal Processor
EKF - Extended Kalman Filter
ESA - European Space Agency
FIT - Florida Institute of Technology
FTDI - Future Technology Devices International GMS - Global Metrology System
GSP - Guest Scientist Program
GUI - Graphical User Interface
InSPIRE - International Space Station SPHERES Integrated Research Experiments ISS - International Space Station
JEM - Japanese Experiment Module
LED -Light Emitting Diode
LIIVe - Low Impact Inspection Vehicle MIT - Massachusetts Institute of Technology
NASA -National Aeronautics and Space Administration
PADS - Position and Attitude Determination System
PD - Proportional-Derivative
PID - Proportional-Integral-Derivative RGA -Reduced Gravity Aircraft
RINGS -Resonant Inductive Near-field Generation System
SAB - Slosh Avionics Box
SPHERES - Synchronized Position Hold Engage and Reorient Experimental Satellites
SAC - Simple Adaptive Controller
SSE - SPHERES-Slosh Experiment
SSL - Space Systems Laboratory
STAMP -Systems-Theoretic Accident Model and Processes
STPA -Systems-Theoretic Process Analysis
UART - Universal Asynchronous Receiver/Transmitter UMD - University of Maryland
US - Ultra Sound
VAS - VERTIGO Avionics Stack
Chapter 1
Introduction
1.1
Motivation
Fluid slosh can have a markedly negative impact on the control of spacecraft in a microgravity environment. Specifically, Gangadharan points out that "Energy loss through the movement of the liquid fuel in the fuel tank affects the gyroscopic stability of the spacecraft and leads to nutation (wobble) which can cause devastating control issues." [1] Examples of the detrimental effects of fluid slosh on spacecraft include the mission failure of the ATS-V spacecraft in 1969[2], the unexpected behavior of the Intelsat IV series spacecraft, and multiple problems with ESA spacecraft. Even under nominal circumstances, such as during the orbital injection of a spacecraft using a liquid-fueled upper stage, fuel slosh has a considerable impact on attitude control. Despite a history of problems caused by fluid slosh and its longstanding influence on many control challenges, predicting slosh motion continues to present a considerable difficulty. [3] Burke further emphasizes the relevance of fluid slosh when she states, "Propellant fluid slosh in spacecraft can couple into the dynamics of the vehicle leading to performance degradation in the propulsion and attitude stabilization sub-systems. [...] Understanding the dynamics of this fluid slosh is essential to the design of mitigation techniques such as attitude control, fluid baffles, etc." [4]
One way to work towards a better understanding of the behavior of fluids in microgravity and the mitigation of the associated detrimental behavior is to create
models of fluid slosh in microgravity. These models may take the form of scaled model testing, heuristic methods such as neural networks and other learning algorithms, or computational fluid dynamics (CFD) models. One promising aspect of CFD models is that they could potentially be used in both simulations and operational controllers. While CFD models have been applied to fluid slosh, they have not been fully matured in their application to capillary-dominated regimes. [31 One reason for this lack of maturity is that the scientific and engineering community lacks a substantial set of pertinent benchmarking data with which to validate microgravity CFD models. According to the Phase III 'Slosh' proposal submitted by FIT to a.i. solutions, the SPHERES-Slosh Experiment (SSE) will "provide the first data set from long duration tests in low-gravity that can be directly used to benchmark CFD models, including the interaction between the sloshing fluid and the tank/vehicle dynamics." [5]
1.2
Literature Review
Consider the interface layer between some fluid and gas. The fluid molecules would have some attraction to the other like-molecules in the fluid, cohesion, as well as some attraction to the unlike-molecules in the gas, adhesion. The interplay of these attractive forces forms the surface tension of the fluid which is a property of the interface. Surface tension may be defined as the magnitude, F, of the force exerted parallel to the surface of a liquid divided by the length, L, of the line over which the force acts, shown as
F
= (1.1)
and measured in L. For example, consider the surface tension of water when inter-faced with air at the room temperature of 20 degrees Celsius. In this case, the surface tension, -y, is .073 .
Now, consider some soap bubble of radius, R, with an internal pressure, P, and an external pressure, P,. Assume that the static soap bubble is acted upon by no external
forces such that the equation of motion of the soap bubble may be represented by
EF = 0 (1.2)
If this theoretical bubble could be cut in half and the right hemisphere made into a free body diagram, it would be seen that the difference of the internal pressure and the external pressure acts as an outward radial force in which all of the force components not pointing to the right are canceled out. Therefore, the aggregate force would be the product of the inner pressure and the projected area of the right hemisphere. Along the circular edge of the hemisphere, the attractive force of the left hemisphere would act on the inner and outer side of the soap bubble shell. Therefore, the aggregate force pulling to the left would be the product of the soap bubble circumference and the surface tension of the fluid - this term must be multiplied by two to account for the inner and outer side of the soap bubble and will be given a negative value for convention since the force points to the left. The balance of forces equation may therefore be shown as
F = Fsuriace tension + Fressure = 0 (1.3)
- 2-(27rR) + AP(7rR2
) = 0 (1.4)
Therefore, the pressure difference may be shown as
AP = 4- (1.5)
R
In the case of a droplet instead of a bubble, only the outer side of the circular edge need be considered. Therefore, for a droplet, the pressure difference may be shown as
AP = 2- (1.6)
R
[6] Now, consider a droplet of water interfaced with air at room temperature and
sphere,
V 7rr3 (1.7)
3
this droplet would have a radius of R = .075m and a diameter of D = .150m. There-fore, the pressure difference between the inside and the outside of the droplet would be 1.9467Pa. In seeking the minimal energy configuration, this pressure difference will attempt to hold the droplet in the shape of a sphere. Given that the surface area of a sphere is
A = 47rr2 (1.8)
the surface area of this sphere will be .0707m2 and the total force imparted by the pressure difference over the entire shell will be .1376N. Given that the mass of this sphere of water is 1.7672kg, an Earth-like gravity of 9.81 will impart a force of
17.3362N on this drop of water. It is easy to see how a sphere of water this size will
not hold its shape in a 1G environment. It is also easy to see how smaller droplets, with less mass and smaller radii, could hold their spherical shapes more effectively.
There exist three hydrodynamic regimes: gravity dominated, inertia dominated, and capillary dominated. The SSE will conduct research in the capillary dominated regime. In this regime, even large drops of water will naturally form spheres. Previous studies have used drop towers, reduced gravity aircraft (RGA) flights, or magnetic ef-fects to induce a weightless environment. These approaches have limited effectiveness because they do not produce weightlessness for a long duration of time or because the zero-g simulation they create is not perfect. [7] The satellite Sloshsat FLEVO has conducted research in the microgravity environment over the course of two weeks for a total experiment time of of approximately 24 hours.[8]
1.3
Outline
1.3.1
Chapter Two: SPHERES-Slosh Experiment Design
This chapter will discuss the requirements presented to the SSE Team and the rea-soning behind those requirements. This chapter will also discuss the design features
of the SSE and explain why these design features were integrated into the creation of the SSE. Additionally, this chapter will present the application of a new safety analysis technique on the SSE.
1.3.2
Chapter Three: ISS Operations
This chapter develops system identification and open-loop control methods for the
SSE and relates how those methods were implemented on the ISS.
1.3.3
Chapter Four: Proposed Control Theory and Design
This chapter develops the framework for closed-loop control on the SSE and proposes how that closed-loop control could be achieved.
1.3.4
Chapter Five: Conclusions and Future Work
This chapter will discuss the takeaways from this thesis and give ideas for the path ahead.
Chapter 2
SPHERES-Slosh Experiment
Design
This chapter will discuss the requirements presented to the SSE Team and the rea-soning behind those requirements. This chapter will also discuss the design features of the SSE and explain why these design features were integrated into the creation of the SSE. Additionally, this chapter will present the application of a new safety analysis technique on the SSE.
2.1
Requirements
This section discusses the requirements that were presented to the SSE Team at the onset of Phase III (the beginning of substantial MIT involvement) of the SSE project. This section will relate the reasons for why these requirements were established. The overall requirement of the project was to acquire long-duration, low-gravity slosh data which could be used to calibrate computational fluid dynamics (CFD) models for coupled fluid-vehicle behavior. Beyond this overall mission requirement, several other functional and form requirements had also been established by the beginning of Phase III.
2.1.1
Functional Requirements
Video Image Collection
The collection of video images will allow for the validation of the CFD models. These images need to be high definition quality and collected under constant lighting so that the exposure of the cameras remains the same. Although, it should be noted that some of the tests were conducted with the light box hood removed and the cameras set to auto exposure. The requirement for the frequency of images taken was not specified based on capturing a certain order of effects or a certain level of fidelity of the fluid. Rather, FIT simply wanted to maximize the frequency based on the limitations of the hardware, specifically, the VERTIGO avionics stack and the associated operating system with its software. FIT wanted to maximize the quantity of images taken based on the available storage space on the SSE hard drives. The cameras used for the flight units were different from the earlier ground prototypes of earlier phases.
Collection of Inertial Measurement Unit Data
The collection of gyroscope and accelerometer data provides critical information for the development of the Computational Fluid Dynamics (CFD) models. Additionally, this data can be used to conduct system identification actions such as characterizing the forces of the thrusters and determining the values of the inertia tensor of the SSE.
Transfer of Data to Earth
The data being collected from the SSE and sent to Earth has no real time or near real time use as this data is used for post-processing. However, the post-processing of this data gives insight into the effectiveness of the associated test session. Lessons can be learned from the post-processing and applied to the next test session in order to increase the effectiveness of the SSE operations. For this reason, the data must reach the appropriate party on Earth, namely, a.i. solutions within the operational time frame of the SSE project as a whole. Therefore, this data should be received by
a.i. solutions no later than one week after the test session.
Moving Liquid in Known Way
To provide effective benchmarking data for the creation of accurate CFD models, the SSE tests should be conducted in such a way that the inputs to the system, the system itself, and the outputs from the system are thoroughly understood. Unknown entities will likely influence known entities and will probably be wrongly accounted for in analysis. For example, if there exist variable wind currents of significant mag-nitude in the ISS JEM, the SSE may be pushed further than nominal distance during the thruster characterization tests. This will lead to inaccurate system identification and will ultimately cause trouble during the analysis tasks by associating an inac-curate force with an observed liquid behavior. Another example, which comes from the system sphere, might be structural flexibility that introduces unwanted dynam-ics into the experiment and corrupts the science results. Therefore, the design and implementation of the system must ensure that the inputs, system, and outputs are known so that the liquid slosh behavior is being caused and captured in a known way.
2.1.2
Form Requirements
Liquid Capacity
The SSE has various fill levels and compositions (liquid water versus solid mass repli-cator) in three different tanks. These fill levels and compositions (20% liquid-filled, 40% liquid-filled, and a 40% solid mass replicator) were chosen so that fluid slosh could be observed at different partial fill levels for the validation of CFD models, fluid-vehicle coupling behavior could be observed and analyzed, and the solid mass tank could be utilized if desired in order to better isolate the impact of the fluid slosh. The tank designs had already been established at the onset of Phase III.
Interface with SPHERES Platform
The SPHERES system provides a unique platform of computing, actuation, sensing, and estimation that can be used, in conjunction with hardware augmentations, to gather the desired data.
Operate in the International Space Station
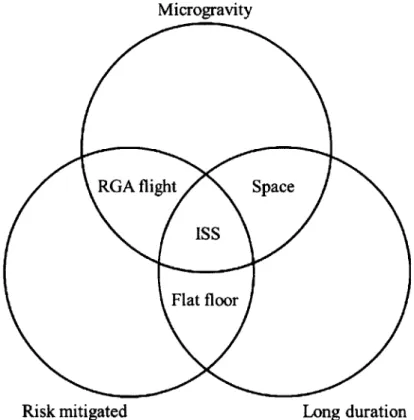
The ISS provides a unique operating environment integral to the successful completion of this science endeavor. The singular value of the ISS as a testing environment may be summarized by Figure 2-1.
Microgravity
RGA flight Space
ISS
Flat floor
Risk mitigated Long duration
Figure 2-1: Characteristics of various testing environments which have been used for SPHERES projects. Credit: Bryan McCarthy.
The three characteristics outlined in Figure 2-1 are each very important. Micro-gravity gives the testing legitimacy in terms of providing useful benchmarking data for the development of CFD models. Risk mitigation preserves the SSE and allows
for repeated tests thus driving down the costs of development and replacement while also ensuring a large amount of data is collected. Long duration testing allows for the comprehensive capture of the fluid dynamics. There are certain time constants which determine the fluid behavior. Therefore, in order to adequately cause and observe a complete set of behaviors under a certain condition, long duration testing is necessary. It is worth noting that this necessity cannot be overcome by increasing the capability of the actuators.
2.2
System Design
This section will discuss the design features of the SSE and will explain why these design features were included; this discussion will provide traceability back to the requirements. This section will give a holistic overview of the SSE, will identify and explain interfaces to established systems, and will examine each of the individual parts unique to the SSE.
2.2.1
System Overview
The SSE uses a distributed computing architecture wherein parts of the computation are contained within the SPHERES satellites and parts of the computation are con-tained within the Vertigo avionics stacks (VAS). The SPHERES computation handles communications with the SPHERES graphical user interface (GUI), commands the actuation of the SSE, and executes the estimation processes of the SSE. The VAS computation handles the payload sensors, the storage of the associated data, and sends information to the VERTIGO GUI.
Each SPHERES satellite is mechanically interfaced with its respective VAS using four thumbscrews which connect the version 2 SPHERES expansion port to the VAS. Power and data exchange capability is achieved through a fifty pin connector. The two components are designed not to exchange power and do not exchange power in any meaningful way. However, the VERTIGO battery has powered up certain light emitting diodes (LEDs) on its respective SPHERES satellite when the satellite was
powered off - a curious anecdote for future users and designers. The communication data between the SPHERES satellites and their respective VASs takes the form of serial communication. This communication is used primarily to populate the VER-TIGO GUI through backdoor communication and so that the SPHERES satellites and VASs can effectively coordinate the execution of tests.
The user can communicate with the VAS through the backdoor communication provided by the SPHERES satellites or by plugging an Ethernet cable directly into the Slosh Avionics Box (SAB) for direct 1 Gbps communication. As of the time of this writing, WiFi has not yet been enabled on station which would provide a third avenue by which to communicate with the VAS.
Each of the SPHERES satellites is independently powered by its own set of two packs of eight AA batteries. The rest of the electronics in the SSE are powered by the two Nikon Li-ion VERTIGO batteries (EN-EL4a). These batteries have a power capacity of 2500mAh at 11.1 V. Each VERTIGO batteries power half of the electronics aside of the SPHERES satellites including one VAS, one SAB, one camera, and one
LED power strip.
All of the actuation capability is contained in the 24 cold gas carbon dioxide
thrusters of the SPHERES satellites.
The radiation protection and thermal management systems of the SSE are compa-rable to ground systems because the International Space Station (ISS) has Earth-like properties with respect to temperature (about 21.5 degrees Celsius[9]) and radiation exposure. The VAS does have a fan to keep its computer cool. The main thermal consideration on the SSE encompasses the carbon dioxide tanks. As carbon dioxide is expended to actuate the SSE, the pressure inside the carbon dioxide tank drops. As the pressure of the tank drops, the temperature drops as well. If enough carbon dioxide is expended in a given amount of time, the ensuing temperature drop will cause the liquid carbon dioxide inside of the carbon dioxide tank to freeze. This will result in a loss of actuation capability.
The Japanese Experiment Module (JEM) of the ISS has five ultra sound (US) beacons at known locations. These US beacons are triggered by infrared transceivers
on the SPHERES satellites and emit US pulses at different known times after the infrared pulse. These US pulses are detected by the 24 US sensors on each satellite and used in conjunction with an Extended Kalman Filter (EKF) and body mounted gyroscopes to determine the states of the SPHERES satellites. Each satellite also has three accelerometers which are not used in the estimation process. For more infor-mation on the SPHERES satellites, the reader should refer to the SPHERES Guest Scientist Program documentation.[10] The primary hardware instruments added as part of the SSE are the two cameras mounted to the structure and the additional Inertial Measurement Units (IMU) components inside of the SAB.
The structure of the SSE houses a tank partially filled with water dyed green. With the exception of this water and the carbon dioxide, the SSE is a rigid structure.
This rigidity is provided by the anodized aluminum SSE frame.
2.2.2
Camera System
Cameras
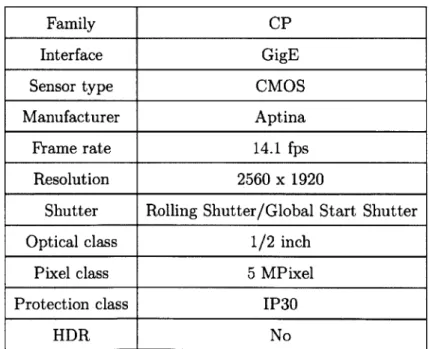
The iDS UI-5580CP cameras allow the SSE to collect the video images of the fluid slosh inside the tank. The cameras are set to constant exposure when the light box is closed and are set to auto exposure when the light box hood has been removed. The cameras pass these images to the Slosh avionics box (SAB) in the form of Ethernet data. The cameras are augmented with Navitar lenses and mounted onto the vertical frame arms of the center hub and secured using sliding dovetail mechanisms and pins. Table 2.1 shows the specifications of these cameras which meet the requirements. [11]
Family CP
Interface GigE
Sensor type CMOS
Manufacturer Aptina Frame rate 14.1 fps
Resolution 2560 x 1920
Shutter Rolling Shutter/Global Start Shutter Optical class 1/2 inch
Pixel class 5 MPixel
Protection class IP30
HDR No
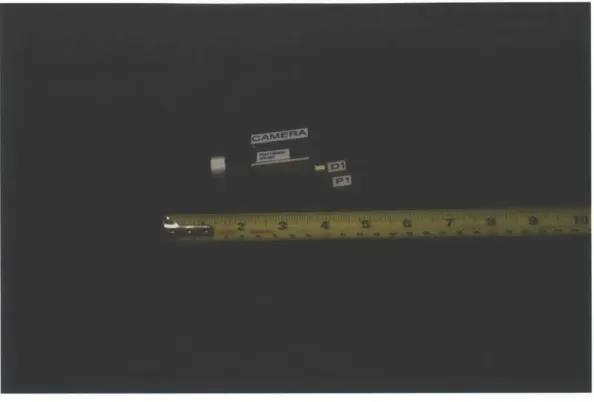
Figure 2-3: iDS UI-5580CP camera augmented with Navitar lens and mount
-
side
view. Credit: FIT.
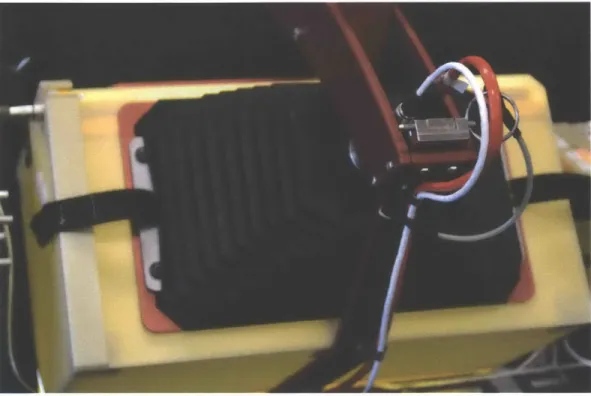
Figure 2-4: Camera mounted on SSE structure using sliding dovetail and pin with
attached Ethernet and power cables. Credit: FIT.
Baffles
The baffles provide a light seal between each camera and the light box so that the
lighting conditions remain constant when the video images are being collected. That is, the baffles prevent external light sources from lighting the fluid.
Figure 2-5: Deployed baffles - side view. Credit: FIT.
Light Emitting Diodes
The light emitting diodes (LEDs) provide the internal source of constant lighting so that video images may be collected of the water under constant exposure. There are two strips of LED lights that are covered with a semi opaque covers which increase the uniformity of the distribution of light within the light box. One of the strips is located at the top of the hood and runs along the corner. The other strip is located at the bottom of the backdrop and runs along the corner.
Figure 2-6: Backdrop with covered LED strip shown - front view. Credit: FIT.
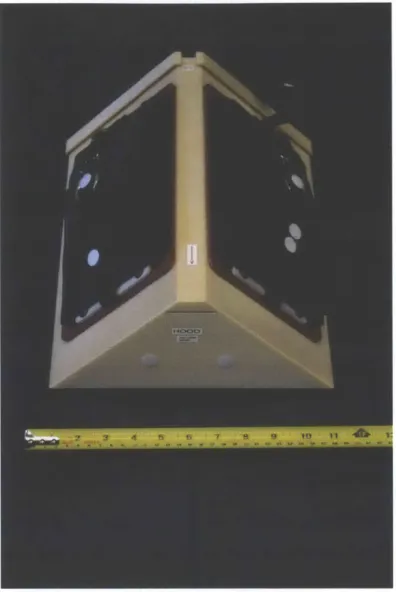
Light Box
The light box is composed of two major pieces including the hood and the backdrop. The hood forms the top half of the light box and the backdrop forms the bottom half of the light box. They are fitted together with cylindrical protrusions on one piece which are inserted into cylindrical holes of the other piece and held together
by friction/clamping force. This light box protects the relatively weaker tank from
structural damage, serves as a flammability barrier which protects the tank, and pre-vents external light source from impacting the lighting conditions of the water when
video images are being collected. The light box pieces are created with 3D printed
ULTEM which gives the light box considerable durability and thermal resistance.
Figure 2-7: Hood with non deployed baffles
-
front view. Credit: FIT.
2.2.3
Tank
The SSE has three tank options: a 40% liquid filled tank, a 20% liquid filled tank,
and a 40% solid mass replicator. The mass of the liquid/solid mass in each of the 40%
tanks is 1.7672 kg (1.7672 liters for volume in the case of the liquid) and the mass of
the liquid in the 20% filled tank is .8836 kg (.8836 liters for volume). The dry mass
of the SSE is 21.1359 kg. Therefore, in the 40% filled scenario the liquid/replicator
material accounts for 7.72% of the mass in the SSE. In the 20% filled scenario, the liquid accounts for 4.00% of the mass in the SSE.
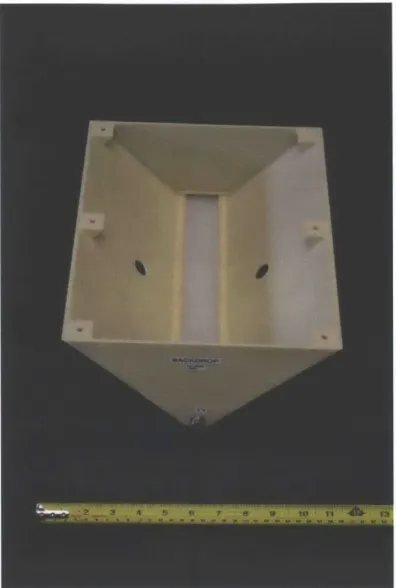
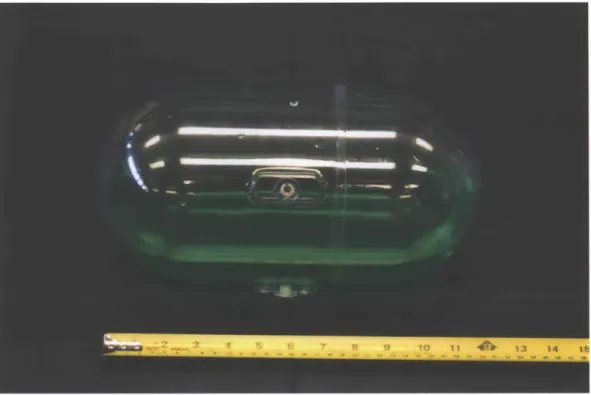
Each tank consists of two pieces of 3D printed Lexan which have been polished, glued together, filled with the appropriate level of liquid, and sealed. The trans-parency of the polished Lexan allows video images of the fluid to be taken. The tank is cylindrical with spherical end-caps.[121 The salient dimensions of the tank are the dimensions which provide the boundaries of the fluid. These dimensions in-clude the inner diameter of the cylinder (156.35 ± 0.25mm), the length of the cylinder
(150.01 ± 0.25mm), and the inner radius of the half-spheres (78.17 ± 0.25mm).[13]
Figure 2-9: 40%-filled SSE tank
-
bottom view. Credit: FIT.
2.2.4
SSE Avionics Box
The SSE avionics box (SAB) is secured mechanically to the VERTIGO avionics stack
(VAS) using four thumb screws. The SAB and VAS exchange power and data through
a 50 pin connector. Each SAB passes along video images through Ethernet
commu-nication from one of the cameras to the VAS where the video images are stored on
the SSE hard drives. Each SAB contains a set of IMUs which include
accelerom-eters and gyroscopes. Specifically, the IMUs are contained inside of a CHR-UM6
or CH Robotics UM6 Ultra-Miniature Orientation Sensor. This UM6 device creates
IMU data in serial Universal Asynchronous Receiver/Transmitter (UART) form and
passes the data along to an FT232RLSSOP Future Technology Devices International
(FTDI) chip which converts the data from serial to Universal Serial Bus (USB) form.
This data is passed through the 50 pin connector and stored in the SSE hard drives
inside of the VAS. Each SAB has two UM6 devices and two FTDI chips.
operating system. The SAB contains ultra sound (US) sensors which are disconnected and unused. Accompanying these US sensors are AD8567 operational amplifiers which would be used to do signal conditioning. The SAB contains an Si4946 transistor and an LTC4365 overvoltage, undervoltage, and reverse supply protection controller that help manage the 12 V power supply. The SAB contains power filters for the 5 V lines which power the chips in the SAB and for the 12 V lines which power external components such as the LED lights housed in the light box and the cameras. The 12 V lines also use a DC to DC converter. The SAB draws all of its power from the VERTIGO battery mounted inside of the VAS.[14]The SAB shell was created by assembling pieces of 3D printed ULTEM.
The SAB also contains its own set of external LEDs which communicate to human users the behavior of the SAB. The LEDs are designated as 1-8. Table 2.2 shows the meanings and color of the eight LED lights.
Number Meaning Color
1 The SAB has received 5 V regulated Green power
2 The SAB has received 12 V regulated Green power
3 The SAB has received 5 V unregulated Red power
4 The SAB has received 12 V unregu- Red lated power
5 IMU 1 has sent a packet of data Yellow
6 IMU 1 has received a packet of data Blue
7 IMU 2 has sent a packet of data Yellow
8 IMU 2 has received a packet of data Blue
Figure 2-10: SSE avionics box - top-front view. Credit: FIT.
2.2.5
Structure
The structure of the SSE provides rigidity, proper alignment, the ability for astronauts to safely hold and move the system, limited protection, and mass symmetry to the experiment. The rigidity is sufficient to ensure that (with the exception of the water and the carbon dioxide) the SSE may be modeled as a perfectly rigid system. The proper alignment ensures, among other things, that the thrusters fire in the desired direction. The physical interface allows for manual maneuvers to be conducted by the astronauts. The mass symmetry allows for key simplifications during control design. Within the structures subsystem exists the center hub and two frame arms.
Center Hub
At the bottom of the center hub exists the base. This center base provides the physical interface to the two frame arms which can be attached in standard or nonstandard configuration to the bottom of the base. The center hub base also supports the two vertically aligned arms which are attached to the top of the base.
Figure 2-12: SSE center hub -bottom view. Credit: FIT.
These vertically aligned arms contain the thumb screws which are screwed into the protrusions of the SSE tank and keep the tank and light box secure. These vertical arms also contain the two dovetail bases and two pins which secure the cameras to the SSE structure. Fasteners are attached to these vertical arms which secure the camera Ethernet and power cables to the SSE structure. The vertical arms support the two arches.
These two arches support the counterweight. Together these arches and counter-weight provide mass symmetry for the SSE. This symmetry ensures that the center of gravity of the SSE aligns with the designated geometric center of the SSE.
Addition-ally, this symmetry produces, within the inertia tensor, on-diagonal values which are significantly greater than the off-diagonal values. Several screws of various sizes are located throughout the entire SSE structure and have not been explicitly mentioned.
Figure 2-13: SSE center hub - side view. Credit: FIT.
Frame Arms
The two frame arms attach to the center hub using two thumb screws each. The frame arms are mounted with 3D printed ULTEM saddles which are used to secure the SPHERES satellites in place. At the end of each frame arm there exists a screw which can be used to tighten the component which holds the carbon dioxide tank of
the satellite. Each frame arm has fasteners which secure the power cable that is used
to power the LED strips inside the light box.
Figure 2-14: SSE frame arm
-
side view. Credit: FIT.
2.3
Safety Analysis
This safety analysis used the Systems-Theoretic Process Analysis (STPA) which is a
new hazard analysis technique based on Systems-Theoretic Accident Model and
Pro-cesses (STAMP).[15] STPA and STAMP were developed by Professor Nancy Leveson.
This section encompasses the application of the STPA to the SSE. This section
con-tains a subset of the comprehensive analysis which can be conducted on the SSE using
this method and provides a framework for developing a more exhaustive analysis.
High level functional goals of the SSE:
1. Execute predetermined open-loop maneuvers in a microgravity environment to
simulate fuel slosh in the partially filled fuel tank of a spacecraft.
system during the open-loop maneuvers.
3. Collect images of the fluid slosh during the open-loop maneuvers.
4. Post process the collected data to provide benchmarking results for models which simulate the behavior of fluids in microgravity.
Potential losses (Accidents):
1. The SSE collides with astronaut or physical structure in the ISS hurting the
astronaut, damaging the Slosh system, or damaging the ISS.
2. The SSE experiences electrical damage resulting from an improperly controlled current input.
3. The SSE experiences fluid damage after being impacted by water.
4. The SSE experiences carbon dioxide.
5. The SSE experiences
ture in the system.
fluid damage after being impacted by excessive levels of
thermal damage resulting from a rapid drop in
tempera-Hazards:
1. (Maps to accident 1) The SSE translates and/or rotates at a rate which would
hurt a human or cause physical damage on impact.
2. (Maps to accident 2) A battery pack is inserted into a SPHERES satellite while its power switch is turned on.
3. (Maps to accident 2) A battery pack is removed from a SPHERES while its
power switch is turned on.
4. (Maps to accident 3) The fluid tank becomes unsealed and releases its water
5. (Maps to accidents 4 and 5) The carbon dioxide tank which provides fuel for
the SSE cold gas thrusters rapidly outputs a large quantity of carbon dioxide outside of the nominal pathways.
High-level functional and safety requirements/constraints: High-level safety constraints:
1. (Maps to hazard 1) The SSE must not translate or rotate too quickly.
2. (Maps to hazard 2) The battery pack will not be inserted into the SPHERES while the power switch is on.
3. (Maps to hazard 3) The battery pack will not be removed from the SPHERES
while the power switch is on.
4. (Maps to hazard 4) The fluid tank will not be removed from its protective shell during maneuvers unless supervised.
5. (Maps to hazard 5) The o-ring and valve thread will not be damaged during
handling.
High-level safety requirements:
1. (Maps to constraint 1) The SSE will maintain an angular velocity lower than 1 radian per second and will be kept inside of the JEM test volume during
translation to prevent momentum accumulation.
2. (Maps to constraints 2 and 3) The power subsystem door will remain closed while the power switch is 'on'.
3. (Maps to constraint 4) The fluid tank will be kept inside of the protective shell
consisting of the backdrop and hood during maneuvers or will be consistently supervised by an astronaut.
4. (Maps to constraint 5) The carbon dioxide tanks will be secured into the SPHERES regulators (without inducing a kick load) at a 90 degree angle such that the threads mesh.
High-level control structure:
Ground Personnel participating in ISS Test Session Two way communication
between the entire ground personnel element
-I--Observations and questions about the experiment General communication
"I-I
Start and atop test commands
Physical changes to the composition and location of the system (carbon dioxide, battery packs, system assembly, initial positioning
of system. moving system,
etc.)
Universal Serial Bus Communication Radio Frequency 868 MHz Communication Visual feedback Inflared Pulses Guidance on procedures and live test decisions Communicatio/battery/
carbon dioxide status. Test and maneuver status.
Universal Serial Bus Communication
Radio Frequency 868 MHz Communication
I-I-Ulrasound Pulses
Microgravity Controls Test Bed Sensor/Actuator Suite
Figure 2-15: High-level control structure for SSE.
Selected loop in technical system:
(only to xaT In~d~ *uy tora Live streaming video images from JEM module oflSS I A
Segment ofDetaled Diagram
Start and stop test commands
Universal
Serial
Bus CommunicationRadio Frequency 868 MHz Communication
Simplified Version of Segment
Visual feedback
Communication/battery/ carbon dioxide status. Test
and maneuver status.
--
-Universal Serial Bus Communication Radio Frequency 868 MHz Communication Physical changes to the composition and location of the system (carbon dioxide, battery packs, system assembly, initial positioning of system, moving system, etc.)
Infrared Pulses Ultrasound Pulses
Microgravity Controls Test Bed Sensor/Actuator Suite
Comnmnication/battery/
Start and stop test carbon dioxide status. Tes
commands. and maneuver status. Visual
Physical changes. feedback (astronaut can see
the mache I. I I I I I / I I I 1 I I 1 / I I I I / I I I I I I
Figure 2-16: Selected loop in technical system.
Responsibilities of the astronaut:
1. Read test procedures and set up SSE.
2. Read the test plan and select which test to run.
3. Command the test to start using the graphical user interface (GUI).
4. Monitor the SSE as it executes the test (Manual tests require additional astro-naut input).
5. Let the test finish or stop the test when appropriate to avoid damage or wasting
time on a useless test.
6. Reposition the SSE and repeat the testing process as many times as necessary.
7. Refill the consumables on the SSE as necessary.
8. Disassemble and stow the SSE.
'-I-I----snal feMha
-k , I, ro I I a t It MEN
I F )1,
Process model of the astronaut:
1. State of SSE.
(a) Position: x, y, z axes.
(b) Velocity: x, y, z axes.
(c) Quaternionions: q1, q2, q3, q4.
(d) Angular rates: x, y, z axes.
2. Carbon dioxide levels in the SPHERES satellites.
3. Battery levels of the SPHERES satellites.
4. Battery levels of the VERTIGO batteries.
5. SPHERES test status. 6. SPHERES maneuver status. 7. SSE communication status.
8. Guidance from MIT/FIT.
9. Communication with NASA. 10. Test procedure instructions. 11. Test plan instructions.
12. Test overview instructions and notes. Responsibilities of the SSE:
1. Execute open-loop maneuvers.
2. Collect IMU data from gyroscopes and accelerometers.
3. Collect video images of water slosh.
Process model of the SSE:
1. State of the SSE.
(a) Position: x, y, z axes.
(b) Velocity: x, y, z axes.
(c) Quaternions: q1, q2, q3, q4.
(d) Angular rates: x, y, z axes.
2. Avionics status.
3. Video images collection status.
4. Consumable status
5. Target state, state error, forces/torques, thruster on/off times
Information sent on communication links:
Model of the Astronaut and the SSE Control Process
S=ar and stop test
Commands. Physical changes and movements.
Communication/battery/ carbon dioxide status. Test and maneuver status. Visual
feedback (astronaut can se
the machine)
, , SSE Comprehensive System
Target State - iiiii - State Error +
.EI II Forces and Torquesoresan Trqe
Observed State
Figure 2-17: Information sent on communication links.
MEN
Table 2.3: Control actions and hazards.
Safety constraints/requirements:
1. The test must be stopped before the maneuver causes the Slosh system to
impact a human or physical structure.
2. The test must be started only when the system is in the correct location.
3. The test must not be stopped while the system is using its actuators in a stable
loop to stop itself.
4. The system must be completely set up before the test is started.
Causes, fixes, and requirements:
1. Unsafe control action 1: The SSE impacts a human or physical structure before
the stop command is sent.
(a) Cause 1: The laptop transceiver breaks after the start command is sent but before the stop command is sent.
i. Fixes: Determine the mass of the system, the force of the thrusters, and the number of thrusters which can produce the same force or torque. Calculate the acceleration of the system. Determine the amount of time the thrusters would have to be on in order to cre-ate enough impulse for the system to be dangerous on impact. Limit
Control action Not providing Providing causes Too early, too late, Stopped too soon/
causes hazard hazard wrong order applied too long
Run test N/A Test is started The run command Commands are
dis-when system is in is sent before the crete: N/A the wrong location system is properly
set up and posi-tioned
Stop test A test which is go- The test is stopped The SSE impacts Commands are dis-ing to cause the sys- before the system a human or physi- crete: N/A
tem to hit some- can stop itself with cal structure before thing is not stopped its actuators the stop command
the run time of the test maneuvers as well as the fuel stored in the carbon dioxide tanks to prevent the system from reaching dangerous velocities.
ii. Requirement: The test maneuvers shall be no longer than 180 seconds. iii. Requirement: The carbon dioxide tank shall hold no more than 300
grams of carbon dioxide.
(b) Cause 2: The astronaut does not pay attention to the experiment and does
not stop the test in time.
i. The two fixes and requirements identified above will provide a fix/control for this cause as well.
2. Unsafe control action 2: The run command is sent before the system is properly set up and positioned.
(a) Cause 1: The test procedures were ineffective in communicating safe in-structions to the astronaut.
i. Fixes: Place watchdogs in the software that will prevent a maneuver from starting when the hardware is not assembled correctly. Place additional instructions in the test overview located in the GUI of the
SSE.
ii. Requirement: The watchdog will terminate the test whenever the SPHERES DSP cannot make contact with the VAS computer system. iii. Requirement: The test overview will quantitatively and qualitatively
illustrate the initial location of the system for the start of the test.
(b) Cause 2: The astronaut makes a mistake in following the instructions in
the test procedures.
i. The two fixes and requirements identified above will provide a fix/control for this cause as well.
The software design of the SSE carried out some of these requirements to improve the effectiveness of the SSE: the watchdog was used, the test overviews provided
information to the astronauts that allowed the astronauts to carry out the tests, and the run time of the SPHERES satellite thrusters was limited.
2.4
Design Summary
The SSE aggregates hardware from different projects including SPHERES and
VER-TIGO and uses its own equipment to achieve its objective. It uses the SPHERES
thrusters or manual maneuvers from the astronauts to move the SSE around and induce motion in the fluid. The motion of the SSE is captured in the gyroscopes and accelerometers and the motion of the fluid is captured by the cameras.
Chapter 3
Control Theory and Design
Implemented during International
Space Station Operations
This chapter will discuss control theory and design that has been developed for the
SSE. These developments were implemented on the International Space Station (ISS)
during two ISS test sessions. The first test session served as the checkout session for the SSE and the second session served as 'Science 1' for the SSE.
3.1
System Identification
System identification was one of the chief objectives of the SSE ISS checkout test session.
Figure 3-1: The SSE floats in the microgravity environment of the ISS during the successful checkout test session. Credit: NASA.
3.1.1
Purpose
System identification characterized the SSE in terms of actuator capability and prin-cipal axis inertia values. This characterization allows the correct amount of impulse to be applied to the SSE when using set thruster firing times during open-loop control. System identification also allows for the development of effective control gains when using closed-loop control. Finally, this characterization allows for the creation of ef-fective baseline control gains when developing a simple adaptive controller. These baseline control gains are based on nominal operating conditions according to the results of the system identification.
3.1.2
Theory
In conducting system identification on the SSE, the first step is to determine the force each thruster produces. There exist two paths to achieving this goal - each with
advantages and disadvantages.
The first path begins by choosing a combination of thrusters which will attempt to produce pure translation (preferably along one axis) with approximately zero rotation of the SSE. These thrusters should not be impinged or at least equally impinged. This situation is governed by Newton's second law:
F = ma (3.1)
The mass of the system should be known by weighing the SSE flight hardware on the ground. The acceleration can be determined using data from the accelerometers on the SPHERES satellites which are capable of measuring the forces produced by the SPHERES thrusters and saturate at .03 G's. Alternatively, the velocity components can be pulled from the state vector (when using the global metrology system) and differentiated to determine linear acceleration. This time differentiation can be done
by simply taking the slope of velocity plotted against time.
The total force is then divided by the number of thrusters to determine the force each thruster produced. This approach is simpler, relies on fewer measurement in-struments, and inertia values need not be included in the calculations. However, the force of an individual thruster may vary based on how may other thrusters are open. (This may actually be an advantage since characterizing one thruster and then using multiple thrusters might produce unintended results due to thruster variation. That is, it may be effective to characterize only thruster combinations and then use those combinations during maneuvers. This, however, will severely constrain the flexibility of the maneuvers.) Also, it may be difficult to produce purely linear translation.
The second path tests each thruster individually and produces both a translational and rotational motion for each thruster. As Deb states, "The motion of a rigid body is a combination of translational motion of the center of mass and rotation around the center of mass", that is, "Every possible motion of a rigid body can be represented as a combination of translational motion of the center of mass and rotation about an axis through the center of mass. This is true even when the center of mass accelerates,
so that it is not at rest in any inertial frame." [16] MITOpenCourseWare provides the the derivations and explanations for this concept.[17 This situation is governed by
FTotal = FLinear + FTorque (3.2)
where
FLinear = maGC (3.3)
such that
aGC
aGC
= a2 GC: x ± a2c GC: y +, a2GC: z0 (3.4)aGC: x = a,: x + a2:x
d
2 Pl: x + P2: x (35)2 dt2 ( 2
}
aGC: y= a1: y+
a2: y _ (P1:+P2:)
(3.6) aG: z+
a2: z _d
P: z +
P2:z
aG. =2
dt
2(
2
z and FTorque = F2 + F + F2 (3.8) such that I - I , + (Izz - Iyy)wywz = - x (3.9)iyyc4 y + (IXX - Izz)WzWX (3.10)
= IZZWZ + (IYY - IXX)WXWY (3.11)
rz
The mass, m, is known by weighing. The acceleration values, a, are determined using the accelerometers. Alternatively, the position values, p, are determined using the global metrology system. The time differentiation can be done by simply taking the slope of position plotted against time to determine velocity and then taking the slope of that velocity plotted against time to determine acceleration. If the analysis requires a more technically rigorous approach, the second difference may be taken since the
measurements are discrete.[18] Use
d
2x
A
2x
_ x(t + At) - 2x(t) + x(t - At)(3.12)
dt2 At2 - (At) 2 where 11x(t + At) = x(t) + Atx'(t) + 1At2x" (t) + ±AtX"'(t) ... (3.13)
26
and
11
x(t - At) = X(t) - Atx'(t) + IAt2x"(t) - ±tX"( ... (3.14)
26
The angular velocity values, w, can be determined using the gyroscope measurements. The angular acceleration values, denoted by c, may be determined by time differen-tiating the gyroscope measurements. The distance values, denoted by r and based on the local reference frame, are known based on thruster geometry. The subscripts of the F and r terms require some discussion since they are, to a degree, misnomers. The subscripts are meant only to associate their variables with the respective torque value. Obviously, the T, value is associated with rx and F. or r. and Fx. The par-ticular combination is unique to each thruster and for the sake of brevity, this paper has used the aforesaid misnomers. Fortunately, the analysis process is simplified by the fact that, due to thruster geometry, two-thirds of the thrusters produce a torque about only one axis, one-third of the thrusters produce a torque about two axes, and none of the thrusters produce a torque about all three axes. The inertia values are based on computer models. It is worth noting that any use of the global metrology system in this analysis will add a degree of difficulty since the thrusters cannot fire while the beacons are being used since the thruster firings will severely degrade the capability of the ultrasound beacons. The user will need to create a thruster firing scheme that allows the estimation and actuation phases to work together effectively and does not invalidate the above process.
Once the thruster forces have been characterized, the inertia tensor values may be determined empirically. Euler's equations of motion may be simplified by conducting pure rotation about one axis. This will be further discussed in Section 4.1.3 - the same
simplification is made but by assuming that the on-diagonal inertia tensor values are approximately equal. These linearized versions of Euler's equations of motion can be used to determine the inertia tensor values because the force values and thruster geometry have been determined empirically and the angular acceleration values can be determined by time differentiating the gyroscope measurements. Of course, the empirically determined inertia tensor values may be different from the inertia tensor values determined using computer models and utilized in the force characterization equations. Therefore, the inertia tensor values gathered from empirical results must be plugged back into the force characterization equations to produce new force values. These new force values will then be plugged into the inertia determination equations to determine new inertia values. This process must be iterated until the inertia tensor values converge.
3.1.3
Results and Analysis
a.i. solutions used the first method to achieve thruster values and inertia tensor values. Shown below is the range of values calculated for the thruster forces by a.i. solutions.
F = [.066 - .17]N (3.15)
Shown below are the ranges of inertia values calculated for each principal axis of inertia by a.i. solutions.
[.145 - .410]
I.410 [1.186 - 3.360] . kgm2 (3.16)
[1.096 - 3.104]
Different results over different test runs caused the large range of thruster values and the large ranges of inertia tensor values. a.i. solutions believed that these different results were caused by thruster variations or failed thrusters. a.i. solutions instructed FIT and MIT to use the numbers predicted by the computer models since those numbers were approximately the same as the average of the values achieved by a.i.
solutions. [19]
3.2
Open-Loop Controller
The execution of effective open-loop control was one of the chief objectives of the first
SSE ISS science test session.
Figure 3-2: The SSE floats in the microgravity environment of the ISS during the successful Science 1 test session. Credit: NASA.