ORIGINAL PAPER
Monthly trends and the corresponding altitudinal shift
in the snowfall/precipitation day ratio
Gaëlle Serquet&Christoph Marty&Martine Rebetez
Received: 11 November 2012 / Accepted: 22 January 2013 / Published online: 15 February 2013 # Springer-Verlag Wien 2013
Abstract A better understanding of the impact of changing temperatures on snow amounts is very important for the ski industry, but it is difficult to measure, particularly at differ-ent times of the snow season and not only on an annual or seasonal basis. Here, we analyze the snow day vs precipita-tion day ratios on a monthly basis from November to April in Switzerland and at 52 meteorological stations located between 200 and 2,700 m above sea level over a 48-year time span. Our results show that the conditions measured in the 1960s in November and March correspond to the present ones in December, January, and February.
1 Introduction
A decrease in snow precipitation and snow cover, including its seasonal variation, would strongly impact mountainous regions, not only for hydrological impacts but also for winter tourism and the leisure industry in winter ski resorts. However, the impact of changing temperatures on snowfall amounts is difficult to measure precisely because of the large natural variability of precipitation. In addition, the impact of increasing temperatures varies, depending on region and altitude (Xu et al. 2008; Scherrer and Appenzeller 2006; Scherrer et al. 2004; Wielke et al.2004).
A general decreasing trend in snow cover has been clearly demonstrated in the Northern Hemisphere (IPCC2007). It has also been shown for mountain regions (e.g., Micu2009; Ke et al.2009; Morin et al.2008; Xu et al.2008), in particular for the European Alps (Wielke et al. 2004; Hantel and Hirtl-Wielke2007; Schoner et al.2009), including the Swiss Alps (Scherrer et al.2004; Marty2008; Laternser and Schneebeli 2003; Wielke et al.2004; Scherrer and Appenzeller2006). A slight decrease has also been observed in the annual maximum snow depth and snowfall (Marty and Blanchet 2012). The decrease in snow cover is mostly significant since the early 1980s or late 1970s (Laternser and Schneebeli2003; Hantel and Hirtl-Wielke2007; IPCC2007). However, particularly in the European Alps, the high interannual variability in precip-itation amounts and the impact of the NAO index have created difficulties in quantifying the impact of temperature increase on snow cover (Scherrer and Appenzeller2006; Scherrer et al. 2004; Marty2008; Schoner et al. 2009; Morin et al. 2008; Durand et al.2009). No significant changes could be found in the frequency of precipitation days in Switzerland except for some stations in winter (Schmidli and Frei2005), although trends could be shown in precipitation extremes (Schmidli and Frei 2005), including in the frequency and persistence of drought episodes in Southern Switzerland (Rebetez1999).
The impact of the observed increasing trend in tempera-ture has usually been investigated on a seasonal basis only. On a monthly basis, the relationship between this increase in temperature and snowfall is more difficult to quantify. Of particular concern are the autumn and spring months and variations with altitude. Serquet et al. (2011) have devel-oped a method to analyze the proportion of snowfall days relative to precipitation days. This method can be used to assess the impact of changing temperatures on snowfall while minimizing the impact of variations in precipitation frequency and intensity. It does not require high-quality snow water equivalent data or estimates of the phase change
G. Serquet
:
M. RebetezWSL Swiss Federal Research Institute, Neuchatel, Switzerland G. Serquet
:
M. Rebetez (*)Institute of Geography, University of Neuchatel, Espace Louis-Agassiz 1,
2000 Neuchatel, Switzerland e-mail: [email protected] C. Marty
WSL Institute for Snow and Avalanche Research SLF, Davos, Switzerland
based on temperature. Marty and Meister (2012) demon-strated with this method that the annual snowfall/precipita-tion day ratio is decreasing even at 2,500 m above sea level (asl) and that this observed decrease was mainly due to a decline in the spring months.
Here, we apply the method of Serquet et al. (2011) to characterize more precisely the impact of increasing temper-atures on snowfall frequency, stratified by month and ele-vation. We chose Switzerland for this analysis to take advantage of its particularly dense network of snow, tem-perature, and precipitation stations at various elevations and regions in the Alps.
2 Data and methods
We used daily snowfall and precipitation data, as well as monthly average temperature values, from 52 Swiss meteo-rological stations located between 200 and 2,700 m asl. Snowfall was manually measured by the Federal Office of Meteorology and Climatology (MeteoSwiss) and/or the WSL Institute of Snow and Avalanche Research SLF and compared to nearby precipitation and temperature data col-lected by MeteoSwiss.
We manually checked the data for inhomogeneities, tak-ing metadata (relocation of stations) into account. When both MeteoSwiss and SLF had snowfall measurements corresponding to the same meteorological station, we chose the series that was closer, that had the fewest missing data, or that was more homogeneous. For some locations, we used data from SLF and MeteoSwiss, successively. We excluded series with more than 10 % data missing during the time interval that we analyzed (1961–2008) or that ended before 2005.
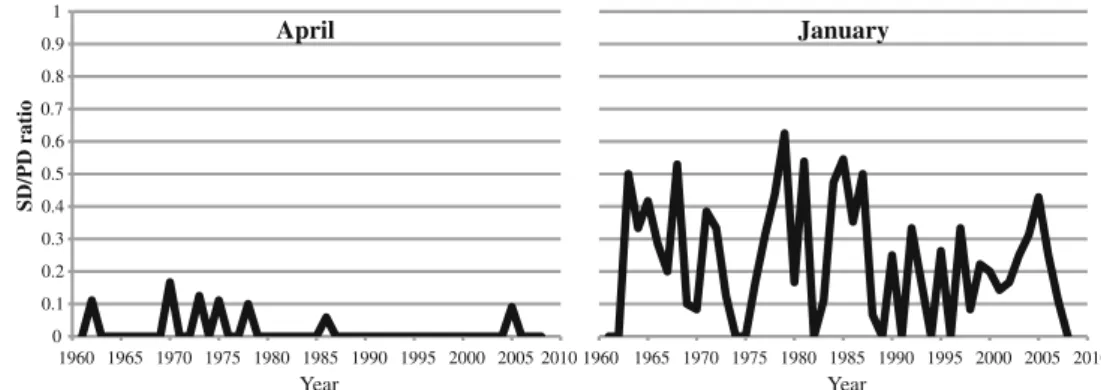
Following Serquet et al. (2011), we computed the month-ly sum of precipitation days (PD) and the monthmonth-ly sum of snowfall days (SD). Following common practice, we chose a threshold of 1 mm of total precipitation to define a PD and 1 cm of snow to define a SD. We considered all days with at least 1 cm of snow (that is, all SDs), as also being PDs, even in cases where the total precipitation was missing or recorded as less than 1 mm. Thus, SDs are a subset of PDs. We computed the SD/PD ratio of every meteorological station for each common snow month from November to April. For each month, we excluded the stations that had a mean SD/PD ratio over the analysis period (1961–2008) of less than the arbitrarily chosen threshold of 20 %, because too frequent zero values prevent a meaningful trend analy-sis; these only make sense if there is a minimum amount of snowfall over the period. Figure 1shows the data for two stations with less than 20 % SD/PD average ratios in order to illustrate why stations and months with too frequent zero values cannot be considered in this analysis. The months
without precipitation (neither snowfall nor rain) were con-sidered as unavailable. Figures 2, 3, and 4 only take into account stations with at least 20 % mean SD/PD ratios. Additionally, Fig. 3 only uses stations with available tem-perature data, i.e., maximum 45 stations. Due to these cri-teria, every month shows a different number of stations in Figs.2,3, and4.
For each station and each month, we calculated the long-term logistic regression trends in the SD/PD over the anal-ysis period (1961–2008). We chose logistic regression as our data are discrete and bounded. Logistic regression is a special case of a generalization of regression techniques (the generalized linear models (McCullagh and Nelder1989). It is appropriate for dealing with number counts (percentages) and probabilities, for which the assumptions of linear re-gression with uniform variance and Gaussian residuals are not satisfied.
In a first step, we then compared the fitted regression values for the beginning and end of the period (1961 and 2008), to calculate the percentage changes in SD/PD over the interval (48 years). In a second step, we analyzed the impact of the ambient temperature on these SD/PD changes. We correlated the monthly SD/PD changes at each station with the corresponding monthly temperature, av-eraged over the decade surrounding the beginning of the analysis interval (i.e., 1956 to 1965). The best correla-tion corresponded to a second-order fit. We character-ized the monthly baseline temperature for each station using this decadal average rather than the individual year 1961 in order to minimize the effects of interan-nual variability in the temperature data. Due to limita-tions in the available temperature records, these monthly baseline temperatures could only be defined for 46 of the 52 stations. Additionally, we correlated the monthly SD/PD changes at each meteorological station with the station’s altitude in meter above sea level.
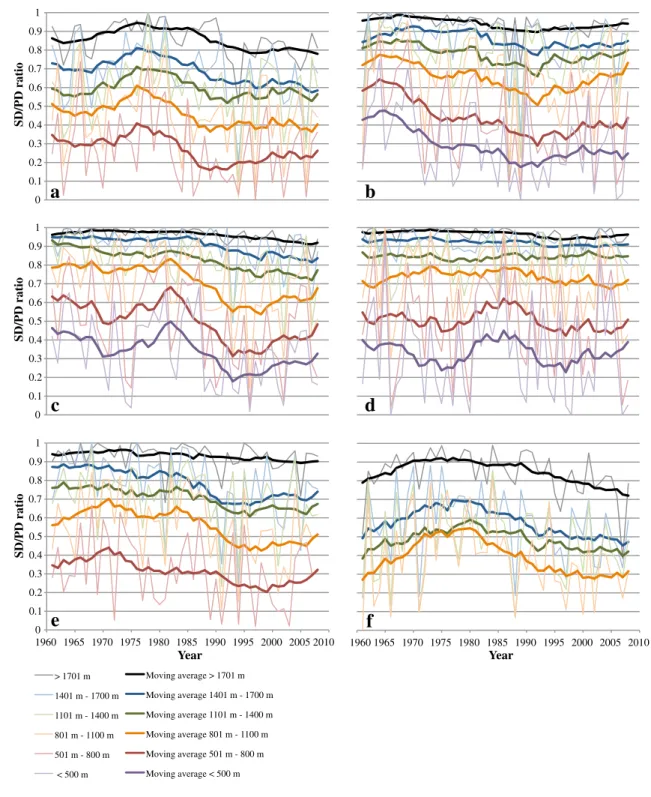
We grouped the stations into six altitude classes (<500, 501–800, 801–1,100, 1,101–1,400, 1,401–1,700, and >1,701 m asl) so that we could examine in more details the impact of altitude on the SD/PD ratio’s evolution for each month. Figure2 shows the average SD/PD ratio, cal-culated whenever there were at least three stations per alti-tude group. The number of stations per altialti-tude class was on average 8, with a standard deviation of ±2.
We then computed the linear regression slopes of each altitude class and for each month. We also computed the fitted regression values for the beginning and end of the period (1961 and 2008). We compared the resulting fitted values using two thresholds, i.e., above 90 % SD/PD ratio (corresponding to a month with non-important rainfall) and above 50 % SD/PD ratio (corresponding to a month with a majority of snow days), which enabled us to analyze the evolution of the SD/PD ratio through time.
3 Results
All months show a general decreasing trend in SD/PD. For each month, the SD/PD decreased at a minimum of 90 % of the stations over the interval 1961–2008, ex-cept in February (76 %). All regions and all altitudes are affected, with 58 % of the trends being statistically significant (p<0.05) in January, 34 % in March, 30 % in December, 25 % in November, 24 % in April, and 6 % in February.
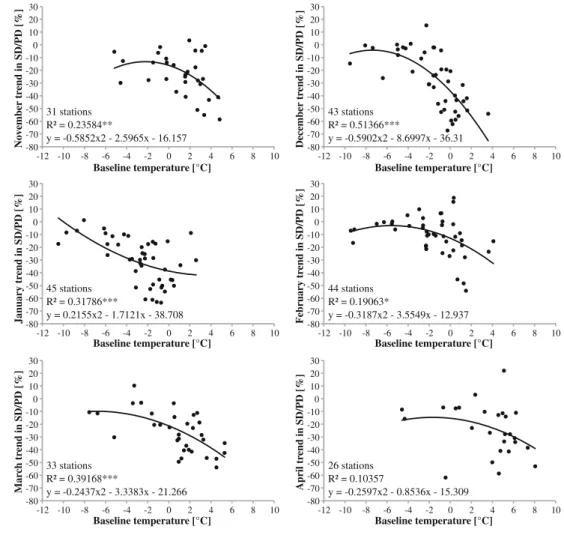
The correlations between SD/PD changes based on logistic trend analysis and the stations’ baseline temperatures were all significant (p<0.05) or highly significant (p<0.001), except in April (Fig.3). February’s and November’s SD/PD changes show the lowest significance to baseline temperature; base-line temperature only explains 17 % (November) and 13 % (February) of the SD/PD changes. For the other months with significant correlations, baseline temperature explains 32 % (January) up to 45 % (December) of the changes.
The correlations between SD/PD changes and station altitude were significant (p<0.05) or highly significant (p< 0.001) for all months (Fig.4). The decrease was larger at lower altitudes. February’s SD/PD changes show the lowest dependence on altitude; elevation only explains 11 % (February) of the SD/PD changes. For the other months, elevation explains 24 % (April) to 75 % (December) of the changes.
In Table1, we show the slopes of the linear regression of SD/PD ratios over the observed period for each month and altitude class. Fifty percent of the SD/PD slopes in each altitude class were significant (p<0.05). January was the month with the largest decreasing slopes (between −1.3 and−6 % SD/PD per decade) compared to the other months, and all slopes of each altitude class were significant (p< 0.05). In contrast, February shows the smallest slopes
(be-tween −0.4 and −2 % SD/PD per decade) in all altitude
classes. In November, February, and April, the SD/PD slopes are smallest in the altitude class 1,101–1,400 m asl, and in December, January, and March, in the altitude class of >1,701 m asl.
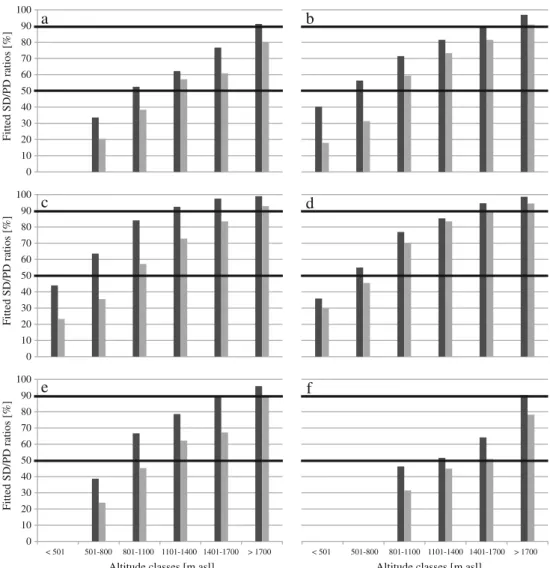
At the beginning of the analysis period (1961), the fitted SD/PD ratios were larger than 90 % for altitude classes
above 1,100 m asl in January (Fig. 5). In December,
February, and March, this 90 % threshold was reached at altitude classes above 1,400 m asl, and in November and April, above 1,700 m asl. In 2008, the fitted SD/PD ratios were larger than 90 % one or two altitude classes higher than in 1961, for all months except in February.
The results look similar for the 50 % threshold. In 1961, the fitted SD/PD ratios were larger than 50 % at altitude classes above 500 m asl in December, January, and February. In November and March, this threshold was only reached at altitude classes above 800 m asl, and in April, at altitude classes above 1,100 m asl (Fig. 5). In 2008, the relationship between the threshold and altitude shifted by one altitude class for all months.
January shows the largest 1961 fitted SD/PD ratios at all altitude classes, and April, the smallest compared to the other months. However, the monthly ratios all show very high values above 1,700 m asl. In 2008, February had the largest values at all altitude classes, and April, the smallest. The monthly values are generally more homogeneous at higher altitudes.
During the observation period, the mean annual temper-ature in Switzerland over the interval 1961 to 2008, calcu-lated from the 12 MeteoSwiss reference stations with
homogenized temperature records (Begert et al. 2005;
Rebetez and Reinhard 2008), increased by 1.82 K, while mean November temperature increased by 0.70 K; December, by 2.00 K; January, by 2.10 K; February, by 1.33 K; March, by 2.47 K; and April, by 1.44 K.
4 Discussion
There was a general decrease in SD/PD for all months during the interval 1961–2008. The decrease in SD/PD was more pronounced at lower elevations and at higher baseline temperatures. The largest decrease was observed for the altitude class 501–800 m asl and not below. This is in good agreement with Scherrer et al. (2004) and Hantel and 0 0.1 0.2 0.3 0.4 0.5 0.6 0.7 0.8 0.9 1 1960 1965 1970 1975 1980 1985 1990 1995 2000 2005 2010 SD/PD ratio April 1960 1965 1970 1975 1980 1985 1990 1995 2000 2005 2010 January Year Year
Fig. 1 Example of the April data in Neuchatel which had to be excluded due to SD/PD average ratios lower than 20 %, compared to the January data at the same station
Hirtl-Wielke (2007), who found maximum decreasing trends in the number of snow days at 600 and 740 m asl, respectively. This results from the frequent zero values at the lowest altitude stations, which left no potential for a large
decrease in SD/PD ratios. Figures 3 and 4 show a high
variability for some months and baseline temperature
(Fig. 3) as well as for some months and altitudes (Fig. 4); for example, in February, the lower altitudes stations have highly variable trends. Three stations lower than 500 m asl measured the highest positive trends in SD/PD, whereas the lowest negative trends were also measured at lower alti-tudes. These highly variable trends correspond to baseline
0 0.1 0.2 0.3 0.4 0.5 0.6 0.7 0.8 0.9 1 SD/PD ratio 0 0.1 0.2 0.3 0.4 0.5 0.6 0.7 0.8 0.9 1 1960 1965 1970 1975 1980 1985 1990 1995 2000 2005 2010 SD/PD ratio 1960 1965 1970 1975 1980 1985 1990 1995 2000 2005 2010 0 0.1 0.2 0.3 0.4 0.5 0.6 0.7 0.8 0.9 1 SD/PD ratio Moving average > 1701 m Moving average 1401 m - 1700 m Moving average 1101 m - 1400 m Moving average 801 m - 1100 m Moving average 501 m - 800 m Moving average < 500 m > 1701 m 1401 m - 1700 m 1101 m - 1400 m 801 m - 1100 m 501 m - 800 m < 500 m Year Year
a
b
d
c
f
e
Fig. 2 Monthly (a November, b December, c January, d February, e March, f April) mean ratio of snowfall versus precipitation days (SD/ PD) by altitudinal categories from 1961 to 2008. Bold lines are
unweighted moving averages with an 11-year window (with uncorrect-ed 5-year uncorrect-edges using the available points)
temperature values around 0 °C in February. This is proba-bly due to the proximity to the melting point. Note that not all stations have temperature data so that some of them may appear in Fig.4and not in Fig.3.
R2is higher for the fit with altitude (Fig.4) than that for the fit with temperature (Fig.3). One reason is the different measurement intervals of temperature and precipitation/s-now. The daily mean temperature values are based on mea-sured values between two midnights, whereas the daily precipitation/snow values are based on a 24-h interval be-tween 7 a.m. and 7 a.m. the previous day.
Despite the general increase in observed temperature in the region since the 1960s, higher locations still generally have temperatures much lower than the melting point during the winter months. As a result, there is little or no impact on the snowfall part of precipitation during the cold season (Serquet et al.2011). Our results do not show any regional differences. The altitudinal factor is clearly dominant at this scale.
At all altitude classes, the decrease was least pronounced
in February (between −0.4 and −2 % SD/PD per decade).
This is probably due primarily to lower baseline temper-atures but may also be because the mean temperature in
February has increased less than in other months. These reasons may also explain the lower dependence of February’s SD/PD changes on baseline temperature and altitude. Mean November temperatures have increased even less than in February, but as the baseline temperatures are closer to the melting point than in February, the decrease was more pronounced (between−1.1 and −3.4 % SD/PD per decade). Consequently, February is currently the month with the highest SD/PD ratios in all altitude classes, whereas at the start of our observation period, it was in January. In April, most baseline temperatures were above 4 °C, which explains the nonsignificant correlation.
Snowfall is currently guaranteed (>90 % of SD/PDs) in February at altitude classes above 1,400 m asl. In December, January, and March, it is guaranteed above 1,700 m asl, whereas in 1961, the same threshold was reached at one (or two, in January) lower altitude classes. A similar transfer in elevation of one altitude class has been detected for the threshold of 50 % of fitted SD/PD ratios for all months. At the altitude class 801–1,100 m asl, the 2008 fitted SD/PD ratios for December (59 %) and January (57 %) now corre-spond to the 1961 November ratio (53 %). Furthermore, the -80 -70 -60 -50 -40 -30 -20 -10 0 10 20 30 -12 -10 -8 -6 -4 -2 0 2 4 6 8 10 -80 -70 -60 -50 -40 -30 -20 -10 0 10 20 30 -12 -10 -8 -6 -4 -2 0 2 4 6 8 10 -80 -70 -60 -50 -40 -30 -20 -10 0 10 20 30 -12 -10 -8 -6 -4 -2 0 2 4 6 8 10 -80 -70 -60 -50 -40 -30 -20 -10 0 10 20 30 -12 -10 -8 -6 -4 -2 0 2 4 6 8 10 -80 -70 -60 -50 -40 -30 -20 -10 0 10 20 30 -12 -10 -8 -6 -4 -2 0 2 4 6 8 10 -80 -70 -60 -50 -40 -30 -20 -10 0 10 20 30 -12 -10 -8 -6 -4 -2 0 2 4 6 8 10 45 stations R² = 0.31786*** y = 0.2155x2 - 1.7121x - 38.708 * p <0.05 ** p <0.01 *** p <0.001 44 stations R² = 0.19063* y = -0.3187x2 - 3.5549x - 12.937 33 stations R² = 0.39168*** y = -0.2437x2 - 3.3383x - 21.266 26 stations R² = 0.10357 y = -0.2597x2 - 0.8536x - 15.309 31 stations R² = 0.23584** y = -0.5852x2 - 2.5965x - 16.157 43 stations R² = 0.51366*** y = -0.5902x2 - 8.6997x - 36.31 Baseline temperature [°C] Baseline temperature [°C] Baseline temperature [°C] Baseline temperature [°C] Baseline temperature [°C] Baseline temperature [°C] Mar ch tr end in SD/PD [%] April tr end in SD/PD [%] November tr end in SD/PD [%] January tr end in SD/PD [%] December tr end in SD/PD [%] February tr end in SD/PD [%]
Fig. 3 Changes in monthly SD/ PD (in percent) during the study period 1961–2008 as a function of monthly baseline
temperature at the start of the study period
2008 fitted February SD/PD ratio (70 %) now corresponds to the 1961 March ratio (67 %), and the 2008 fitted March ratio (45 %), to the 1961 April ratio (46 %). The same process can be observed at all other altitude classes. This means that the beginning and end of the ski season (November and March and April, respectively) in the 1960s now corresponds to the situation in the core ski season (December to February and March, respectively) in respect to the SD/PD ratio.
5 Conclusions
For all months (November to April), our results show clear decreasing trends in snowfall days relative to precipitation days during the study period 1961–2008. This decrease was least pronounced in February, probably because the monthly mean temperatures in February are still mostly below the melting point and because they have increased less than in other months, with the exception of November. Particularly
Table 1 Linear regression slopes (in percent per year) of the evolution in snowfall/pre-cipitation day ratios from 1961 to 2008 at different altitude classes (in meter asl]
*p<0.05; **p<0.01; ***p< 0.001 Slopes (%) Month <501 501–800 801–1,100 1,101–1,400 1,401–1,700 >1,700 November −0.28 −0.30 −0.11 −0.34* −0.24* December −0.47* −0.53* −0.26 −0.18 −0.17 −0.13* January −0.44* −0.60* −0.57** −0.42*** −0.30** −0.13*** February −0.13 −0.20 −0.15 −0.04 −0.11 −0.09* March −0.31 −0.46* −0.35* −0.47** −0.12 April −0.31 −0.14 −0.28 −0.26* -80 -70 -60 -50 -40 -30 -20 -10 0 10 20 30 0 500 1000 1500 2000 2500 3000 -80 -70 -60 -50 -40 -30 -20 -10 0 10 20 30 0 500 1000 1500 2000 2500 3000 -80 -70 -60 -50 -40 -30 -20 -10 0 10 20 30 0 500 1000 1500 2000 2500 3000 -80 -70 -60 -50 -40 -30 -20 -10 0 10 20 30 0 500 1000 1500 2000 2500 3000 -80 -70 -60 -50 -40 -30 -20 -10 0 10 20 30 0 500 1000 1500 2000 2500 3000 -80 -70 -60 -50 -40 -30 -20 -10 0 10 20 30 0 500 1000 1500 2000 2500 3000 * p <0.05 ** p <0.01 *** p <0.001 51 stations R² = 0.10004* y = -5E-06x2 + 0.0204x - 23.326 38 stations R² = 0.31395*** y = -3E-06x2 + 0.0253x - 50.416 29 stations R² = 0.22051* y = -2E-05x2 + 0.0833x - 94.009 36 stations R² = 0.35771*** y = -1E-05x2 + 0.0597x - 71.171 50 stations R² = 0.74873*** y = -2E-05x2 + 0.0805x - 84.045 52 stations R² = 0.54146*** y = -5E-06x2 + 0.0338x - 59.011 Altitude [m asl] Altitude [m asl] Altitude [m asl] Altitude [m asl] Altitude [m asl] Altitude [m asl] Mar ch tr end in SD/PD [%] December tr end in SD/PD [%] February tr end in SD/PD [%] April tr end in SD/PD [%] November tr end in SD/PD [%] January tr end in SD/PD [%]
Fig. 4 Changes in monthly SD/ PD (in percent) during the study period 1961–2008 as a function of altitude (in meter asl)
at this monthly scale, the observed trends are of course superimposed by large fluctuations. This means that al-though the general trends are sound, we must be very careful when entering into details or making extrapolations. Consequently, February is presently the month with the highest SD/PD ratios at all altitude classes, in contrast to five decades ago when January was the month with the highest ratios. In addition, snowfall is currently guaranteed (>90 % of SD/PDs) in February at an altitudinal class of 1,401–1,700 m asl and above, and 1,700 m asl in December, January, and March. For these 3 months, the snowfall guar-antee was transferred upwards by at least one altitude class from 1961 to 2008. For all months, the threshold with one out of two precipitation days consisting of rainfall only (i.e., without measurable snowfall) has also increased by one altitude class on average.
Our analysis shows that the current SD/PD ratios for December, January, and February are similar to the 1960s SD/PD ratios for November and March. This means that with an expected temperature increase during the coming decades
at least similar to the temperature rise of recent decades, we can assume another similar altitudinal transfer of SD/PD ratios. The current situation in November and March could thus become the future situation in December, January, and February. During the coming decades, the December, January, and February SD/PD ratios for the altitude class 1,101– 1,400 m asl would gradually reduce to approximately 50 %. For ski resorts with a base below 1,400 m asl, December, January, and February will be problematic, because at least one out of two precipitation days will consist of rainfall only. The beginning and end of the ski seasons (November and March–April) will also be affected by the transfer in altitude of snowfall, as currently already approximately every second precipitation day consists of rain up to 1,400 m asl in November and March and up to 1,700 m asl in April.
These SD/PD ratio changes will also result in a decrease in the amount of snow available for water storage and runoff during the spring and summer months, because more and more winter precipitation will directly contribute to runoff. 0 10 20 30 40 50 60 70 80 90 100 0 10 20 30 40 50 60 70 80 90 100 0 10 20 30 40 50 60 70 80 90 100 1961 2008
a
f
e
d
c
b
Fitted SD/PD ratios [%] Fitted SD/PD ratios [%] Fitted SD/PD ratios [%]Altitude classes [m asl] Altitude classes [m asl]
< 501 501-800 801-1100 1101-1400 1401-1700 > 1700 < 501 501-800 801-1100 1101-1400 1401-1700 > 1700 Fig. 5 Monthly (a November,
b December, c January, d February, e March, f April) fitted snowfall/precipitation day ratios (in percent) for 1961 and 2008 at different altitude classes. Bold lines, 50 and 90 % thresholds
Impacts can also be expected on the alpine vegetation, which will experience a shorter snow season, independent of variability or changes in precipitation.
Acknowledgments This work was supported in part by the Forest Investigation Programme, a joint project between the Swiss Federal Office for the Environment and the Swiss Federal Institute for Forest, Snow and Landscape Research (WSL), and by Canton Vaud, Vaud regional associations (ADAEV, ADNV, ADPE, ARDA, Nyon Region) and OTV, Switzerland. We are grateful to MeteoSwiss for providing the data and to John Innes for his useful comments and suggestions.
References
Begert M, Schlegel T, Kirchhofer W (2005) Homogeneous temperature and precipitation series of Switzerland from 1864 to 2000. Int J Climatol 25(1):65–80. doi:10.1002/joc.1118
Durand Y, Giraud G, Laternser M, Etchevers P, Merindol L, Lesaffre B (2009) Reanalysis of 47 years of climate in the French Alps (1958– 2005): climatology and trends for snow cover. J Appl Meteorol Climatol 48(12):2487–2512. doi:10.1175/2009jamc1810.1
Hantel M, Hirtl-Wielke LM (2007) Sensitivity of Alpine snow cover to European temperature. Int J Climatol 27(10):1265–1275. doi:10.1002/joc.1472
IPCC (2007) Climate Change 2007. The physical science basis. IPCC, Cambridge
Ke CQ, Yu T, Yu K, Tang GD, King L (2009) Snowfall trends and variability in Qinghai, China. Theor Appl Climatol 98(3–4):251– 258. doi:10.1007/s00704-009-0105-1
Laternser M, Schneebeli M (2003) Long-term snow climate trends of the Swiss Alps (1931–99). Int J Climatol 23(7):733–750. doi:10.1002/ joc.912
Marty C (2008) Regime shift of snow days in Switzerland. Geophys Res Lett 35(12):L12501. doi:10.1029/2008gl033998
Marty C, Blanchet J (2012) Long-term changes in annual maximum snow depth and snowfall in Switzerland based on extreme value statistics. Clim Change 111(3–4):705–721. doi: 10.1007/s10584-011-0159-9
Marty C, Meister R (2012) Long-term snow and weather observations at Weissfluhjoch and its relation to other high-altitude observato-ries in the Alps. Theor Appl Climatol 110(4):573–583. doi:10.1007/s00704-012-0584-3
McCullagh P, Nelder JA (1989) Generalized linear models, vol 37, 2nd edn, Monographs on statistics and applied probability. Chapman and Hall, London, UK
Micu D (2009) Snow pack in the Romanian Carpathians under chang-ing climatic conditions. Meteorol Atmos Phys 105(1–2):1–16. doi:10.1007/s00703-009-0035-6
Morin J, Block P, Rajagopalan B, Clark M (2008) Identification of large scale climate patterns affecting snow variability in the east-ern United States. Int J Climatol 28(3):315–328. doi:10.1002/ joc.1534
Rebetez M (1999) Twentieth century trends in droughts in southern Switzerland. Geophys Res Lett 26(6):755–758. doi:10.1029/ 1999GL900075
Rebetez M, Reinhard M (2008) Monthly air temperature trends in Switzerland 1901-2000 and 1975-2004. Theor Appl Climatol 91(1–4):27–34. doi:10.1007/s00704-007-0296-2
Scherrer SC, Appenzeller C (2006) Swiss Alpine snow pack variabil-ity: major patterns and links to local climate and large-scale flow. Clim Res 32(3):187–199
Scherrer SC, Appenzeller C, Laternser M (2004) Trends in Swiss Alpine snow days: the role of local- and large-scale climate variability. Geophys Res Lett 31(13):L13215. doi:10.1029/2004gl020255
Schmidli J, Frei C (2005) Trends of heavy precipitation and wet and dry spells in Switzerland during the 20th century. Int J Climatol 25(6):753–771. doi:10.1002/joc.1179
Schoner W, Auer I, Bohm R (2009) Long term trend of snow depth at Sonnblick (Austrian Alps) and its relation to climate change. Hydrol Process 23(7):1052–1063. doi:10.1002/hyp.7209
Serquet G, Marty C, Dulex J-P, Rebetez M (2011) Seasonal trends and temperature dependance of the snowfall/precipitation-day ratio in Switzerland. Geophys Res Lett 38:L07703. doi:10.1029/ 2011GL046976
Wielke LM, Haimberger L, Hantel M (2004) Snow cover duration in Switzerland compared to Austria. Meteorol Z 13(1):13–17. doi:10.1127/0941-2948/2004/0013-0013
Xu CC, Chen YN, Li WH, Chen YP, Ge HT (2008) Potential impact of climate change on snow cover area in the Tarim River basin. Environ Geol 53(7):1465–1474. doi:10.1007/s00254-007-0755-1
![Table 1 Linear regression slopes (in percent per year) of the evolution in snowfall/pre-cipitation day ratios from 1961 to 2008 at different altitude classes (in meter asl]](https://thumb-eu.123doks.com/thumbv2/123doknet/14844884.626840/6.892.268.817.81.613/linear-regression-percent-evolution-snowfall-cipitation-different-altitude.webp)