WATER USE IN LCA
Taking into account water use impacts in the LCA
of biofuels: an Argentinean case study
Mireille Faist Emmenegger&Stephan Pfister&
Annette Koehler&Luca de Giovanetti&
Alejandro Pablo Arena&Rainer Zah
Received: 26 November 2010 / Accepted: 3 August 2011 / Published online: 25 August 2011 # Springer-Verlag 2011
Abstract
Purpose The assessment of biofuels has until now mainly focused on energy demand and greenhouse gas emissions. Only little attention has been given to other impacts, although the general importance of water use for the life cycle assessment (LCA) of agricultural products has been recognized in recent publications. The aim of this work is to assess in detail the water consumption along a biofuel production chain taking into account irrigation efficiencies, levels of water scarcity, and type of feedstock, and to integrate those results in a full LCA. Furthermore, we compare the results for biofuels from various feedstocks and regions with conventional petrol.
Methods We calculate the water consumption and overall life cycle assessment results in a case study for the production of methyl ester from irrigated and non-irrigated rapeseed. The results are compared with other irrigated and non-irrigated biofuels based on different feedstocks.
Results and discussion Water consumption in biofuel production chains based on non-irrigated crops does not vary greatly and is in the same range as for fossil fuel. In contrast, as a consequence of irrigation, agricultural water consumption dominates the overall results of all irrigated crops. Consequently, the level of water scarcity plays a key role for the LCA results. In our case study, the environ-mental impacts of methyl ester from irrigated rapeseed in a water-scarce region, measured in aggregated Eco-Indicator 99 scores, are almost doubled by water consumption. Variations in irrigation efficiency, however, are of little influence on the results, as the assessment method used here is based on consumptive water, which depends mainly on the evapotranspiration of the crop.
Conclusions The focus on greenhouse gas emissions of the main regulatory schemes neglects other relevant environ-mental impacts and may provide the wrong incentives. Water consumption may thus become a major concern, offsetting the benefits of biofuel use with respect to climate change.
Keywords Argentina . Biofuels . Life cycle assessment . Rapeseed . Water consumption . Water scarcity
1 Introduction
The assessment of the environmental impacts of biofuels’ life cycles has until now mainly focused on the emissions of greenhouse gases and on fossil energy use. Only a few studies (e.g., Zah et al. 2007) take a more comprehensive approach and consider the overall environmental impacts of biofuels. Water use in biofuel production has only been considered by very recent papers, without relating the results to overall environmental impacts (Chiu et al.2009; Responsible editor: Thomas Koellner
Electronic supplementary material The online version of this article (doi:10.1007/s11367-011-0327-1) contains supplementary material, which is available to authorized users.
M. Faist Emmenegger (*)
:
L. de Giovanetti:
R. Zah Technology and Society Lab, Empa,8600 Dübendorf, Switzerland e-mail: [email protected] S. Pfister
:
A. Koehler:
L. de GiovanettiInstitute of Environmental Engineering, ETH Zurich, 8093 Zurich, Switzerland
A. P. Arena
Facultad Regional Mendoza, Universidad Tecnologica Nacional, Buenos Aires, Argentina
De Fraiture and Berndes 2009; Dominguez-Faus et al.
2009; Service 2009). However, this step is very important for a comprehensive assessment of biofuels. This is illustrated in one recent publication which showed that the assessment of water consumption in the life cycle assess-ment (LCA) of cotton production strongly influences the results, especially in water-scarce regions. The contribution of water consumption to the total aggregated damage also indicated substantial regional variability (Pfister et al.
2009).
The promotion of biofuels through regulatory schemes such as the European Renewable Energy Directive (European Parliament 2009) or the Californian Low Carbon Fuel Standard (California Environmental Protection2009) mainly aims at reducing the greenhouse gas emissions of the transport system. These regulations do not include a comprehensive assessment of all environmental impacts along the entire value chain of biofuels. In contrast, the Swiss regulation on tax exemption for biofuels (MinöStV
2008) requires a life cycle assessment of biofuels and their entire value chains, including water use. However, this regulation affects only a very small market. Leaving the focus of most regulatory schemes on one climate change indicator may result in unwanted shifts of environmental impacts.
The main goal of this work was therefore to assess in detail the water consumption along a biofuel production chain taking into account irrigation efficiencies, levels of water scarcity and type of feedstock and to integrate those results in a full LCA. This allowed us to evaluate the importance of the different production steps related to water consumption. Furthermore, the method developed by Pfister et al. (2009) is applied to obtain insights into possible trade-offs between water consumption and other environmental impacts as measured in aggregated Eco-Indicator 99 scores. The study is based on site-specific data for irrigated rapeseed cultivation in a water-scarce region and for non-irrigated cultivation in a water-rich area of Argentina. We compare the results of the case study with other biofuels from various feedstocks and regions as well as with conventional petrol.
2 Methods
2.1 Functional unit and fossil fuel reference
The results are calculated over the whole life cycle of the different fuels. The functional unit is 1 person ×kilometer (1 pkm), transported in a car achieving the European emissions standard EURO 3 (European Parliament2000).
The system boundaries include the production (cultiva-tion and processing for biofuels, extrac(cultiva-tion and refining for
fossil fuels), transport, and final use of the fuels. The co-products are taken into account using economic allocation except where flows can be attributed to a physical causality (e.g., transport flows are allocated by mass).
We calculate the fossil reference dataset using the ecoinvent data set“transport, passenger car, petrol, EURO3” (Jungbluth et al.2007).
2.2 Inventory of rapeseed cultivation in Argentina
The inventory for the cultivation phase is based on the data collected in the water-scarce region of Mendoza (irrigated rapeseed cultivation) and the water-rich region Entre Rios, Argentina (non-irrigated rapeseed), between February and May 2008. Data for water use, fertilizer, pesticide applica-tion, and machine use are based for irrigated rapeseed on interviews of rapeseed experts of the region of Mendoza (Colomer et al. 2008) and for non-irrigated rapeseed on interviews of agricultural experts of national institutions (Donato and Iriarte 2008). Furthermore, agricultural man-agement data were used (Alturria2008; Donato et al.2008; Iriarte 2002). An average yield of 2,700 kg/ha for both regions was assumed (Donato et al. 2008). Emissions (ammonia, dinitrogen oxide, nitrogen oxides, and pesti-cides) related to agricultural production are calculated according to the models used in the ecoinvent database (Nemecek and Kägi 2007). The ecoinvent models for nitrate and phosphate emissions apply only to Swiss conditions; in this case, we use the simplified models as developed in the “sustainability quick check for biofuels (SQCB)” (Faist Emmenegger et al.2009). The heavy metal emissions in soil are calculated by subtraction of the heavy metal uptake of the plant from the inputs through fertilizers. For this calculation, we rely on literature data from the ecoinvent database (Nemecek and Kägi2007). The energy use of irrigation pumps retrieving groundwater is calculated with the electricity mix for Argentina (Arena et al.2002).
The complete inventory data are shown in detail in the
Electronic Supplementary Material.
2.3 Inventory of post-farm production steps
For the production of rapeseed methyl ester (oil pressing and esterification processes), we use the inputs and outputs from a similar production in Europe (Jungbluth et al.2007), as no specific data for Argentina are available. This approximation has however very little influence on the overall LCA results because of the low importance of the processing step in the life cycle of biofuel, as shown by Zah et al. (2007).
We include the transport of the biofuel from esterifica-tion plants in Argentina to Europe with standard distances according to Frischknecht et al. (2007). The data for
background processes are taken from the ecoinvent data-base (www.ecoinvent.org). The LCA calculations were performed with the Simapro v7.1.5 software (PRé Consultants
2006).
2.4 Water consumption of rapeseed cultivation in a water-scarce region of Argentina
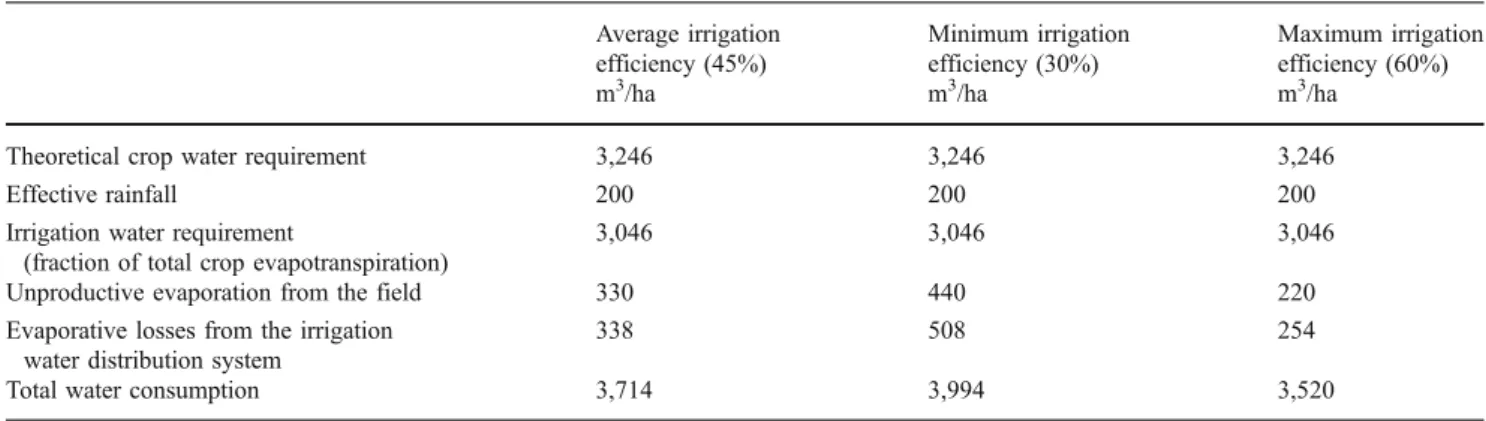
In crop cultivation, the effective water consumption is the sum of the irrigation requirements caused by plants’ evapotranspiration during growth and the unproductive evaporation water losses in the irrigation water supply system. The irrigation water requirement, representing the crop evapotranspiration share supplied by irrigation water, is calculated by subtracting the amount of precipitation from the crop water require-ment, which was calculated using CropWat 4 (FAO
2008) on the basis of the total evapotranspiration (ETo) in Mendoza during the planting period. The effective rainfall is calculated averaging the results of the FAO and the USDA formula, which are quoted in the
Electronic Supplementary Material.
Irrigation efficiency is the quotient of the irrigation water requirement and the total amount of irrigation water supplied. As the irrigation system in Mendoza does not allow one to do any flow measurements, we calculate different scenarios, based on the interviews of four experts in Mendoza, by assuming a minimum (30%), a maximum (60%), and an average irrigation efficiency (45%), which represents a typical range of efficiency for the crop considered and low-tech irriga-tion facilities. The irrigairriga-tion efficiency affects the amount of unproductive evaporation as well as the losses of the distribution system, which are calculated with the total irrigation water.
The unproductive evaporation of irrigation water on the field is not considered in the irrigation water requirement. To account for this, we assume that during most of the
cultivation period, water is mainly captured in the soil, and only 5% of the 2 mm/day of ETo evaporated. To this average value, we add 8 days of irrigation on totally moisturized surfaces, with an unproductive evaporation of 2 mm/day (ETo). We assume that the total unproductive evaporation increases and decreases by 33% for the minimum and maximum irrigation efficiency, respectively. The distribution network is estimated to cause a 5% loss of total irrigation water supplied due to surface evapora-tion and unproductive evapotranspiraevapora-tion due to seepage along the channels (Rodríguez 2008; Table 1), while seepage to groundwater is not considered as water consumption. The total irrigation water supply is calculated by dividing the irrigation requirement with the irrigation efficiency.
Based on the interviews of four experts in Mendoza, we assume irrigation water to be withdrawn by 90% from river and 10% from ground water. The latter is used during the irrigation channel revisions, which are done once each year.
2.5 Comparison of biofuels produced in various climatic regions
We compare the water use and the environmental impacts of the rapeseed methyl ester from Argentina with other biofuels from non-irrigated (soy bean methyl ester and sugar cane ethanol from Brazil) and from irrigated feed-stocks (ethanol from US corn and Chinese sweet sorghum). The data for these calculations stem from the ecoinvent 2.01 database (www.ecoinvent.org; Jungbluth et al.2007). For corn and sorghum, data on average irrigation water consumption were taken from Pfister et al. (2011). The data are based on the CropWat 4 model (FAO 2008) including spatially distributed data of high resolution for climate conditions and irrigation. The data refer to the average corn grown in the USA and the average sorghum produced in China.
Table 1 Water consumption in rapeseed cultivation taking into account crop water requirement, flood irrigation, and losses in the water distribution system Average irrigation efficiency (45%) Minimum irrigation efficiency (30%) Maximum irrigation efficiency (60%)
m3/ha m3/ha m3/ha
Theoretical crop water requirement 3,246 3,246 3,246
Effective rainfall 200 200 200
Irrigation water requirement
(fraction of total crop evapotranspiration)
3,046 3,046 3,046
Unproductive evaporation from the field 330 440 220
Evaporative losses from the irrigation water distribution system
338 508 254
For the assessment of water consumption taking into account water scarcity, we use the method of Pfister et al. (2009). This method evaluates only consumptive water use while the ecoinvent datasets consider the total water withdrawal. Consumptive water use for sweet sorghum and corn was estimated similarly to rapeseed with a typical flood irrigation efficiency ranging from 30% to 60%, with an average of 45% (Table2).
Water use in fuel processing and in background processes is only partially consumptive. In industry, about 5–25% of the water is consumed (Shiklomanov and Rodda
2003). The calculation of water consumption in the background processes relies on the ecoinvent database, whose number of datasets is far too large to determine the consumptive water use of each individual background or industrial process. We therefore estimate the consumptive water use in cooling and industrial production with 10% of the total water withdrawals given in the underlying datasets. The water consumption of hydropower that accounts for evaporated water from reservoirs is assumed to be 10% of the turbined water. For run-of-the-river hydropower no consumption is accounted for.
2.6 Life cycle impact assessment
We use the Eco-Indicator 99 method for the overall impact assessment (Goedkoop and Spriensma2001). The impacts of water consumption are assessed with the method of Pfister et al. (2009), which is fully compatible with Eco-Indicator 99, considering cause–effect chains of damages to the three areas of protections “human health,” “ecosystem quality,” and “resources.” The impact assessment for human health considers the water stress and socio-economic indicators to derive DALYs from malnutrition due to lack of water in agriculture, while ecosystem quality impacts are derived from climatic constraints to plant growth and
annual precipitation. Resource depletion is assessed through overuse of sustainable water availability, applying the concept of a backup technology to compensate for the water consumed.
The rapeseed dataset is calculated with the impact factors for the Mendoza water scarcity in the region of Mendoza; for China and the USA, we use the impact factors for the country average, as the ecoinvent data sets do not refer to a specific region. The impact factors for the different regions rely on the method of Pfister et al. (2009). In order to make these factors more accessible to practitioners, we have made them available as Google Earth maps (http://www.ifu.ethz.ch/ ESD/data/Impact_factors_Water_LCA_pfister_et_al.kmz) based on the Supporting Information in Pfister et al. (2009), which provides a GIS-compatible format. In this paper, we use the specific characterization factors for the Mendoza region by localizing Mendoza on the google map and taking over the corresponding factors.
We calculate two scenarios for the fossil fuel reference: the first using the impact factors of Mendoza to simulate a water-scarce region and the second with the average impact factors of the USA to simulate a low-scarcity region.
3 Results and discussion
3.1 Water consumption of biofuels production in various production regions
The consumptive use of water can be divided according to its origin as water from wells, from surface water bodies, and from reservoirs for hydropower production. We further distinguish water for cooling purposes according to the categories in ecoinvent (Table 3). The overall figures include the water consumed in the different steps of the Table 2 Water consumption in sorghum (China) and corn (USA) cultivation taking into account crop irrigation water requirement (evapotranspiration), unproductive evaporation from irrigation, and losses in the water distribution system
Sorghum (China) Corn (USA)
Average irrigation efficiency (45%) Minimum irrigation efficiency (30%) Maximum irrigation efficiency (60%) Average irrigation efficiency (45%) Minimum irrigation efficiency (30%) Maximum irrigation efficiency (60%)
m3/ha m3/ha m3/ha m3/ha m3/ha m3/ha
Irrigation water requirement (fraction of evapotranspiration)
386 386 386 1,881 1,881 1,881
Unproductive evaporation from the field 89 118 59 433 577 288
Evaporative losses from the irrigation water distribution system
43 64 32 209 314 157
Total water consumption 475 505 445 2,314 2,458 2,169
biofuel production as well as in the background processes. The results for non-irrigated crops do not vary greatly and range between 1.9–2.6 kg water consumed per pkm. The greatest consumption occurs for surface water and reservoir water. For the non-irrigated biofuels, water is mainly used in fertilizer production, electricity generation (primarily evaporation of reservoir water), and metal production. Water consumption values in the petrol production chain are on the same range as for non-irrigated biofuels.
Water consumption of biofuels produced from irrigated crops, however, varies by a factor of eight between 12 kg/pkm for sweet sorghum-based ethanol and 96 kg/pkm for rapeseed-based biodiesel (average values). In the case of biodiesel produced from irrigated rapeseed in Argentina, overall consumptive water use is about 50 times higher than for the non-irrigated crops. As a consequence of irrigation, agricul-tural water consumption (mainly surface water) dominates the overall water consumption figures of all biofuels produced from irrigated crops. Variations in irrigation efficiency, which were here calculated with a minimum of 30% and a maximum of 60%, result only in a variation of about 5% in overall water consumption. Indeed, the water consumption of the crop
depends mainly on the evapotranspiration, which varies according to the crop and the climate, whereas irrigation efficiency only influences evaporation on the field and losses in the distribution system (see also Tables1,2, and3).
3.2 Selected environmental damages of the biofuels production life cycle
The effects of water consumption on ecosystem quality are relevant to crops with high water consumption. In the case of biodiesel from irrigated rapeseed in Argentina, the impact of water consumption accounts for 35% of total potentially disappeared fraction (PDF; Fig. 1). The vari-ability of the water consumption damages is however rather low amounting to only 4–6% of total PDF, similarly to the figures of water consumption (see Table 3). Nevertheless, the ecosystem impacts for the other biofuels chains are dominated by land use. The high impacts of soybean methyl ester produced in Brazil, for instance, result from the underlying assumption that about 3% of the cultivation area is transformed from the Cerrado ecosystem, which is wooded grassland in the area of the Brazilian Central Table 3 Overall consumptive water use of various biofuel and petrol production over the whole life cycle
Biofuel Production
region
Well water for industrial production and irrigation
Surface water for industrial production and irrigation Surface water for cooling purposes Reservoir water for hydropower generation Total kg/pkm kg/pkm kg/pkm kg/pkm kg/pkm Irrigated crops Rapeseed methyl ester Average irrigation efficiency Argentina 9.6 86.0 0.1 1.0 96.7 Maximum irrigation efficiency to minimum irrigation efficiency 9.0–10.2 81.1–91.9 0.1–0.1 1.0–1.0 91.2–103.2 Corn ethanol Average irrigation efficiency USA 0.2 50.2 0.2 1.6 52.1 Maximum irrigation efficiency to minimum irrigation efficiency 0.2–0.2 47.1–53.3 0.2–0.2 1.6–1.7 49.0–55.3
Sweet sorghum ethanol Average irrigation efficiency China 0.4 10.7 0.1 0.9 12.1 Maximum irrigation efficiency to minimum irrigation efficiency 0.4–0.4 10.1–11.3 0.1–0.1 0.9–0.9 11.5–12.7 Non-irrigated crops
Rapeseed methyl ester Argentina 0.1 0.7 0.1 1.0 1.8
Soybean methyl ester USA 0.1 0.7 0.1 1.1 1.9
Sugar cane ethanol Brazil 0.1 1.6 0.1 0.8 2.6
Fossil fuel
Petrol 0.0 0.6 0.1 0.8 1.5
Plateau and about 2% from forest land. This land transforma-tion represents an interventransforma-tion of relatively severe ecological damage due to great losses of biodiversity.
These results indicate that there may be a trade-off between land use and water consumption. The use of marginal arid land for cultivation reduces land use impacts but induces a higher demand for irrigation, which finally compensates for the environmental benefits. As the eco-indicator method does not provide any land use category for marginal arid land with related impact factors, it is not possible to explore in detail the possible trade-offs between land use and water consumption in such a case, where the land use impacts might be lower, especially compared to transforming productive land.
In addition to land use and water consumption, acidifi-cation and eutrophiacidifi-cation also contribute their impacts in biofuel production chains with minor shares of less than 5% to the overall ecosystem damage. These impacts are caused by the emissions of nitrogen compounds. However, for the case of the Mendoza biofuels production, acidification is an
impact which has no influence due to the high buffering capacity of the soils and may therefore be discounted.
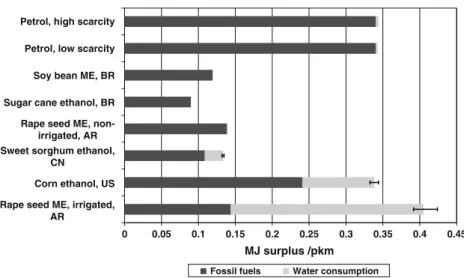
Figure 2 shows the abiotic resource depletion of the different fuel production chains. When the irrigation level is high, as it is in the Mendoza region, the impacts on resource use resulting from water consumption are higher than those resulting from fossil fuels and cover about 60% of total abiotic resource depletion. For the other biofuels produced from irrigated crops (sweet sorghum, corn) and obviously for petrol, the fossil fuel use represents the main impact of resource use.
As is the case of ecosystem quality damages, the variability of the results is small, amounting only to 4–6% of the total MJ of surplus energy.
The effects of water consumption on human health as calculated with the method of Pfister et al. (2009) are rather small, as they have minor relevance in most of the countries considered here. The impacts of water consumption on human health are about a hundred times lower than the respiratory effects of inorganic substances in the biofuels’ life cycles.
0 0.1 0.2 0.3 0.4 0.5 0.6 0.7 0.8 Rape seed ME, irrigated, AR
Corn ethanol, US Sweet sorghum ethanol, CN Rape seed ME, non-irrigated, AR Sugar cane ethanol, BR Soy bean ME, BR Petrol, low scarcity Petrol, high scarcity
PDF*m2yr/pkm
Acidification / Eutrophication Land use Water consumption
Fig. 1 Selected indicators con-tributing to the damage category “ecosystem quality” (acidifica-tion/eutrophication, land-use, water consumption) in the bio-fuels’ assessment using the Eco-Indicator 99 (H,A) method-ology combined with the method of Pfister et al. (2009). The ranges for the water consumption damages represent the minimum and maximum irrigation water consumption
0 0.05 0.1 0.15 0.2 0.25 0.3 0.35 0.4 0.45 Corn ethanol, US
Sugar cane ethanol, BR Soy bean ME, BR Petrol, low scarcity Petrol, high scarcity
MJ surplus /pkm Fossil fuels Water consumption Rape seed ME,
non-irrigated, AR Sweet sorghum ethanol,
CN
Rape seed ME, irrigated, AR
Fig. 2 Selected indicators con-tributing to the damage category “abiotic resources” (fossil fuels, water/resource) of biofuels’ assessment using the Eco-Indicator 99 (H,A) combined with the method of Pfister et al. (2009). The ranges of the minimum and maximum water consumption damages represent the minimum and maximum irrigation water consumption
3.3 Total environmental impacts of the biofuels’ production life cycle
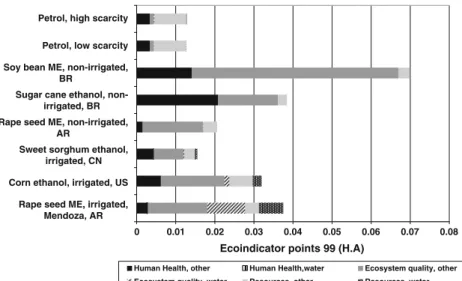
The total environmental impact assessment of the different biofuels’ pathways shows very different results depending on the feedstock and the biofuel production chains. In all cases, the overall environmental score is higher than for the fossil reference petrol, independently of the water scarcity (Fig.3).
In the case of irrigated rapeseed biodiesel, the impacts due to irrigation account for half of the single score. For the sweet sorghum ethanol, the water use impacts are only about 6% of the aggregated results. In all cases studied, the impacts on human health of water consumption were very small compared to other impacts and do not appear in the diagram.
In general, changing from petrol to biofuels results in a shift of environmental burdens from fossil–fuel resource depletion to ecosystem quality damages. Our results demonstrate that using average national characterization factors for water consumption instead of regional charac-terization factors may significantly bias the assessment. This is particularly the case when the repartition of the water in a country is very heterogeneous, as it is the case in Argentina. The overall environmental impacts of irrigated rape methyl ester are three times as high as for petrol when calculated taking into account the water scarcity of the Mendoza region (Fig.4). However, using the average water scarcity in Argentina would reduce these results almost by one third. It is therefore crucial to assess water consumption in the context of the regional hydrological situation and with impact factors reflecting regional water availability and scarcity. The availability of the regional factors as a Google Earth layer facilitates greatly the use of specific factors for a given region, as these can be directly read off
the map and prove applicability of spatially explicit characterization for foreground system.
Figure 4 also illustrates very clearly the trade-off that appears for several biofuels of the first generation. While these often achieve a reduction in global warming potential impacts, the overall environmental impacts, here evaluated with the Eco-Indicator 99 method, are higher than the fossil fuel reference. Furthermore, crop cultivation for biofuels in marginal arid areas increases even more the environmental impacts as a consequence of irrigation water consumption given that land use impacts are not further adapted.
The results show that irrigation in water-scarce countries has a great influence on the overall results of the LCA. The main effects are due to water resource depletion and the impact on water-dependent ecosystems, while human health impacts remained negligible in all areas considered. However, if biofuel production is extended to arid regions in developing countries, this might no longer be true, reflecting the competition between biofuels and food production.
0 0.01 0.02 0.03 0.04 0.05 0.06 0.07 0.08 Corn ethanol, irrigated, US
Petrol, low scarcity Petrol, high scarcity
Ecoindicator points 99 (H.A)
Human Health, other Human Health,water Ecosystem quality, other Ecosystem quality, water Resources, other Resources, water
Soy bean ME, non-irrigated, BR
Sugar cane ethanol, non-irrigated, BR Rape seed ME, non-irrigated,
AR
Sweet sorghum ethanol, irrigated, CN
Rape seed ME, irrigated, Mendoza, AR
Fig. 3 Single score results of biofuels’ assessment using the Eco-Indicator 99 (H,A) com-bined with the method of Pfister et al. (2009), taking into account the respective water scarcity on regional (irrigated rapeseed) and national (all other biofuels) level. The two scarcity scenarios for petrol are calculated with factors for the USA (low scarcity) and for Mendoza, Argentina (great scarcity)
Petrol, low scarcity
0% 50% 100% 150% 200% 250% 300% 350% 0% 20% 40% 60% 80% 100% 120%
Global Warming Potential
Ecoindicator points 99 (H.A)
Rape seed ME, irrigated, Mendoza, AR
Rape seed ME, irrigated, average AR Rape seed ME,
non-irrigated, AR
Fig. 4 Single score results of rapeseed methyl ester assessment using the Eco-Indicator 99 (H,A) combined with the method of Pfister et al. (2009) versus their global warming potential (calculated using the same method) in comparison to a fossil fuel reference (petrol)
It is important to note that the environmental impacts in regions of water scarcity such as Mendoza/AR can be very different from the average values of the respective country. We therefore recommend strongly the use of regionalized factors on the level of watershed, as they are available on the Google Earth layer for the assessment of water consumption. These results also suggest using regionalized characterization factors for land use, the dominant impact in the single score assessment. However, inventory data on a regional level is far more difficult to provide.
A drawback of the water use method is the focus on consumptive water: indeed, water consumption varies only slightly when considering different irrigation efficiencies. Although inefficient irrigation might not lead to significant additional evaporation in a watershed, it might lead to local water scarcity due to competition for available water in the irrigation network. Consequently, the results of this assessment may fail to give incentives for an increase in efficiency.
4 Conclusions
This study evaluates the consumptive water use along the whole production chain of biofuels including not only the production of the biofuel itself, but also background processes such as fertilizer production or water use for cooling systems. Moreover, due to the full compatibility of the method of Pfister et al. (2009) with the Eco-Indicator 99 method, we are able to put the impacts of water consumption in an LCA context and assess end-point damages as well as do an aggregated single score assessment .
Consumptive water use depends on the crop and on the climate in the region. The total water consumption of biofuels is on the same range as that for the fossil reference, when no irrigation occurs. However, in the case of high levels of irrigation, agricultural water use dominates the overall water consumption of the overall production pathway. Our study shows that producing biofuels can reduce the fossil fuel use and greenhouse gas emissions when compared to a fossil reference. It is important to notice, however, that higher impacts in other categories in the biofuels studied here lead to a shift in environmental problems, mainly towards impacts on ecosystem quality. On the reverse, possible environ-mental benefits on land use impacts, which might occur when expanding into arid land, cannot be assessed, as the corresponding land use category does not exist in the Eco-Indicator 99 method. In such a case, a trade-off could be said to exist between such benefits and the increased impacts of water consumption due to irriga-tion in a water-scarce country.
Up to now, biofuels have mainly been evaluated with respect to the reduction they bring in greenhouse gas emissions, while the potential increase in water use has received only minor attention. Consequently, most regula-tory schemes which strive for the promotion of biofuels do not set any requirements concerning sustainable water use in this context. However, neglecting to consider relevant environmental impacts may provide misleading incentives. In fact, water use, in addition to land use, could become a major concern, offsetting the benefits of biofuels. A comprehensive view of the advantages and drawbacks of biofuels is therefore needed more than ever, especially under the current perspective of increased demand for agricultural outputs.
Acknowledgments We thank the Civil Service Authorities in
Switzerland for their support of the project.
References
Alturria L (2008) Cultivos energéticos: estimación de costos de producción. Oral presentation, 9 May 2008. Facultad de Ciencias Agrarias, UNCuyo., Mendoza, Argentina
Arena AP, Canizo JR, Sanchez BM (2002) Perfil ambiental de la generación termoeléctrica en la Argentian en el cuatrienio 1997– 2000. Avances en Energías Renovables y Medio Ambiente 6 (2):7–12
California Environmental Protection Agency (2009) Proposed regula-tion to implement the low carbon fuel standard—volume I. Staff report: initial statement of reasons
Chiu Y-W, Walseth B, Suh S (2009) Water embodied in bioethanol in the United States. Environ Sci Technol 43(8):2688–2692 Colomer JS, Emili L, Castillo X, Kristich C (2008) Personal
communications collected in interviews with Ing Dr. Jorge Silva Colomer (INTA Junin), Luis Emili (UNCuyo), Ing Xavier Castillo (INTA La Consulta), Ing. Carlos Kristich (Municipality Alvear)
De Fraiture C, Berndes G (2009) Biofuels and water. In: Howarth RW, Bringezu S (eds) Biofuels: environmental consequences and interactions with changing land use: proceedings of the Scientific Committee on Problems of the Environment (SCOPE) Interna-tional Biofuels Project Rapid Assessment, 22–25 September 2008, Gummersbach, Germany. Cornell University, Ithaca, pp 139–153
Dominguez-Faus R, Powers SE, Burken JG, Alvarez PJ (2009) The water footprint of biofuels: a drink or drive issue? Environ Sci Technol 43(9):3005–3010
Donato L, Huerga I, Hilbert J (2008) Principales Insumos en la Producción de Biocombustibles. Un Análisis Económico. Balance Energético de los cultivos potenciales para la producción de biocombustibles. . Instituto Nacional de Tecnología Agropecuaria (INTA)—Istituto de Ingenieria Rural–CIA–CNIA., Castellar, Argentina
Donato L, Iriarte L (2008) Personal communications collected in interviews with Ing. Lidia Donato (INTA Castellar) and Ing. L. Iriarte (INTA Barrow)
European Parliament (2000) Directive 98/69/EC of the European Parliament and of the Council of 13 October 1998 relating to measures to be taken against air pollution by emissions from motor vehicles and amending Council Directive 70/220/EEC
European Parliament (2009) Directive 2009/28/EC of the European Parliament and of the Council of 23 April 2009 on the promotion of the use of energy from renewable sources and amending and subsequently repealing Directives 2001/77/EC and 2003/30/EC. vol COM(2008)0019–C6-0046/2008–2008/0016(COD) Faist Emmenegger M, Reinhard J, Zah R (2009)
SQCB—sustainabil-ity quick check for biofuels. Second draft, 18th February 2009— intermediate background report. With contributions from T. Ziep, R. Weichbrodt, Prof. Dr. V. Wohlgemuth, FHTW Berlin and A. Roches, R. Freiermuth Knuchel, Dr. G. Gaillard, Agroscope Reckenholz-Tänikon. Empa, Dübendorf, Switzerland
FAO (2008) CROPWAT 4.3 Decision Support System (Food and Agriculture Organization)
Frischknecht R, Jungbluth N, Althaus H-J, Doka G, Heck T, Hellweg S, Hischier R, Nemecek T, Rebitzer G, Spielmann M, Wernet G (2007) Overview and methodology. Ecoinvent report No. 1. Swiss Centre for Life Cycle Inventories, Dübendorf
Goedkoop M, Spriensma R (2001) The Eco-Indicator 99: a damage oriented method for life cycle impact assessment: methodology report. Publikatiereeks produktenbeleid; nr. 36A. Ministerie van Volkshiusvesting, Ruimtelijke Ordening en Milieubeheer, Den Haag Iriarte LB (2002) Colza: cultivares, fechas de siembra, fertilizacion. Instituto Nacional de Tecnología Agropecuaria (INTA), Chacra Experimental Integrada Barrow, Tres Arroyos, Argentina Jungbluth N, Chudacoff M, Dauriat A, Dinkel F, Doka G, Faist
Emmenegger M, Gnansounou E, Kljun N, Schleiss K, Spielmann
M, Stettler C, Sutter J (2007) Life cycle inventories of bioenergy. Ecoinvent report no. 17. Swiss Centre for Life Cycle Inventories, Dübendorf
MinöStV (2008) Mineralölsteuerverordnung (MinöStV), Änderung vom 30. Januar 2008
Nemecek T, Kägi T (2007) Life cycle inventories of Swiss and European agricultural production systems. Final report ecoinvent V2.0 No. 15a
Pfister S, Bayer P, Koehler A, Hellweg S (2011) Environmental impacts of water use in global crop production: hotspots and trade-offs with land use. Environ Sci Technol 45(13):5761– 5768
Pfister S, Koehler A, Hellweg S (2009) Assessing the environmental impacts of freshwater consumption in LCA. Environ Sci Technol 43(11):4098–4104
PRé Consultants (2006) Simapro 7
Rodríguez P (2008 ) Oral communication by Ing. Patricio Rodríguez, Departamento de Irrigación, 12.03.2008
Service RF (2009) Another biofuels drawback: the demand for irrigation. Science 326(5952):516–517
Shiklomanov IA, Rodda JC (eds) (2003) World water resources at the beginning of the 21st century. International hydrology series. Cambridge University Press, Cambridge
Zah R, Böni H, Gauch M, Hischier R, Lehmann M, Empa PW (2007) Ökobilanz von Energieprodukten: Ökologische Bewertung von Biotreibstoffen. BfE/BAFU/BLW, Bern, Switzerland