INVITED REVIEW
Computed tomography in acute ischemic stroke
Karl-Olof Lövblad
&Alison E. Baird
Received: 16 February 2009 / Accepted: 16 November 2009 / Published online: 2 December 2009
# Springer-Verlag 2009
Abstract Stroke remains the third most important cause of
mortality in industrialized countries; this has prompted
research for improvements in both diagnostic and
thera-peutic strategies for patients with signs of acute cerebral
ischemia. Over the last decade, there has been a parallel in
progress in techniques in both diagnostic and therapeutic
options. While previously only used for excluding
hemor-rhage, imaging now has the possibility to detect ischemia,
vascular occlusion, as well as detect tissue at risk in one
setting. It should also allow to monitor treatment and
predict/exclude therapeutic complications. Parallel to
advances in magnetic resonance imaging of stroke,
com-puted tomography has improved immensely over the last
decade due to the development of CT scanners that are
faster and that allow to acquire studies such as CT
perfusion or CT angiography in a reliable way. CT can
detect many signs that might help us detect impending
signs of massive infarction, but we still lack the experience
to use these alone to prevent a patient from benefitting from
possible therapy.
Keywords Stroke . Computed tomography .
Perfusion imaging . Thrombolysis
Introduction
Acute stroke is an important cause of morbidity and
mortality in all industrialized nations. For a long time, it
was considered a hopeless situation with at best the
prospect of lengthy rehabilitation periods for the affected
patients. However, due to an impressive investment in
energy during the decade of the brain in the 1990s, this
purely attentive attitude has now been overcome, and over
the last decade, thrombolysis has become an established
standard of care [
1
–
6
]. This has been due to the
simultaneous development of both new diagnostic and
therapeutic strategies that have changed completely our
vision of the disease.
According to the AHA guidelines, the first aim of global
assessment of a patient with suspected stroke is to exclude
another possible cause of symptoms (such as hemorrhage)
[
7
,
8
] (Fig.
1
).
Indeed, signs of acute neurological dysfunction referable
to stroke can be caused by a number of conditions. These
so-called stroke mimics can be caused by a number of
conditions such as epilepsy, brain tumors, or event
infections/inflammatory diseases of the central nervous
system. The aims of neuroimaging are manifold [
9
]: (1)
rule out hemorrhage (and also demonstrate its cause, hence
CT angiography, see below); (2) demonstrate the presence
of ischemia since the non-absence of hemorrhage is not
enough to make a diagnosis of stroke; (3) show the
presence of hemodynamically compromised tissue (tissue
at risk or penumbra); (4) demonstrate the underlying cause
(vascular occlusion or embolus, carotid stenosis, or even
cardiac source); in addition to this imaging must allow to
monitor treatment (demonstrate success by showing
reper-fusion or demonstrating failure and or complications such
as emboli or bleeding); and, finally, (6) to allow follow-up
K.-O. Lövblad (*)Department of Neuroradiology, Department of Imaging and Medical Informatics, HUG–Geneva University Hospital, Geneva University Medical School,
24 Micheli-du-Crest, 1211 Geneva, Switzerland e-mail: [email protected] A. E. Baird
Cerebrovascular Disease and Stroke, SUNY Downstate Medical Center,
450 Clarkson Avenue, Box 1213, Brooklyn, NY 11203, USA DOI 10.1007/s00234-009-0633-5
imaging that correlates well with clinical status. Where one
must be careful in the interpretation of these findings, be it
with CT or MRI, is that the concept of the ischemic penumbra
has evolved a lot since its original description and has moved
from one of thresholds in intracellular energies to one of
demonstrations of areas of relative hypoperfusion: While both
these concepts are intimately and ultimately related, they do
not represent the same concept, and it had been shown that
vessel recanalization by any means even if effective does not
always represent revascularization and a potential positive
effect on brain tissue.
The accepted time window for intravenous therapy has
now increased to 4.5 h. While in the acute setting nuclear
medicine techniques have moved to the background on the
stage of neuroimaging for the moment, we momentarily
rely on techniques such as magnetic resonance imaging and
computed tomography to image the brain for ischemia.
Imaging must of course not interfere with treatment
options. Depending on local availabilities, both modalities
may be equally used, but often, CT has remained the
workhorse of acute stroke imaging. Magnetic resonance
allows acquiring images of diffusion and perfusion that
have been proven useful in acute stroke [
10
–
13
]. While MR
is considered equivalent for the detection of hemorrhage
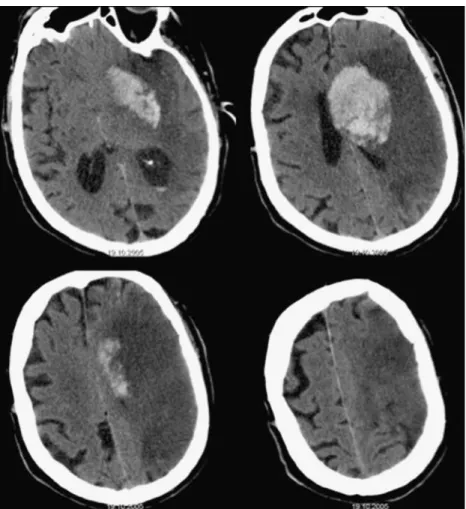
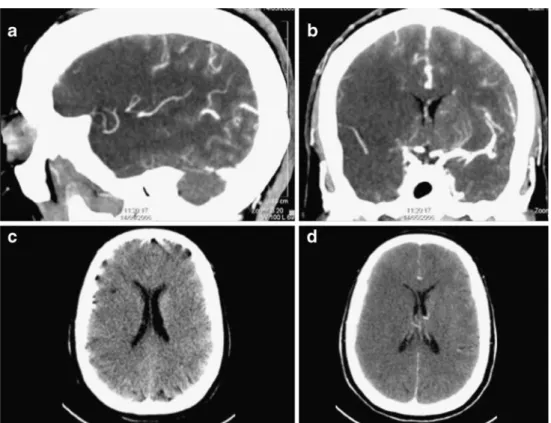
Fig. 1 Patient with hemorrhagicstroke; there is a visible hematoma in the basal ganglia with edema. This is a left MCA stroke with hemorrhagic transformation
[
14
] and superior for ischemia [
15
], CT still remains at the
forefront. MRI will be clearly superior for the detection of
small cortical infarcts and for small lacunar lesions located
deep in the brain. However, for purposes of detecting large
lesions, CT still has a power of detection that is almost
equivalent in trained eyes.
Early signs The typical early signs that are looked for are
the dense artery sign at the level of any cerebral artery, loss
of gray/white matter differentiation, beginning hypodensity,
sulcal effacement, and mass effect that are all due to the
presence of beginning edema. These early CT signs have
been found alone or in combination to be present in up to
92% of cases [
16
]. Von Kummer et al. [
17
] also found that
early changes were often associated with poor outcome
especially if swelling was present. There has been found a
good inter-observer agreement for these signs [
18
].
The dense artery sign This represents visualization of the
thrombus on unenhanced CT in the affected vessel (Figs.
2
,
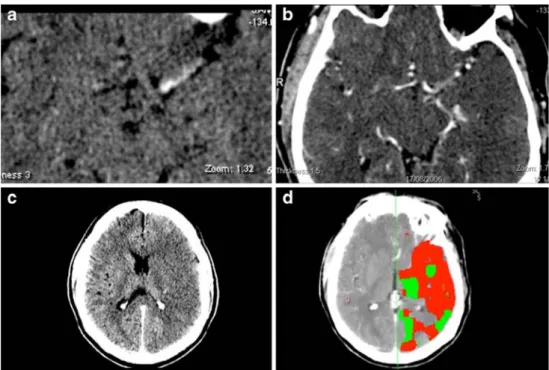
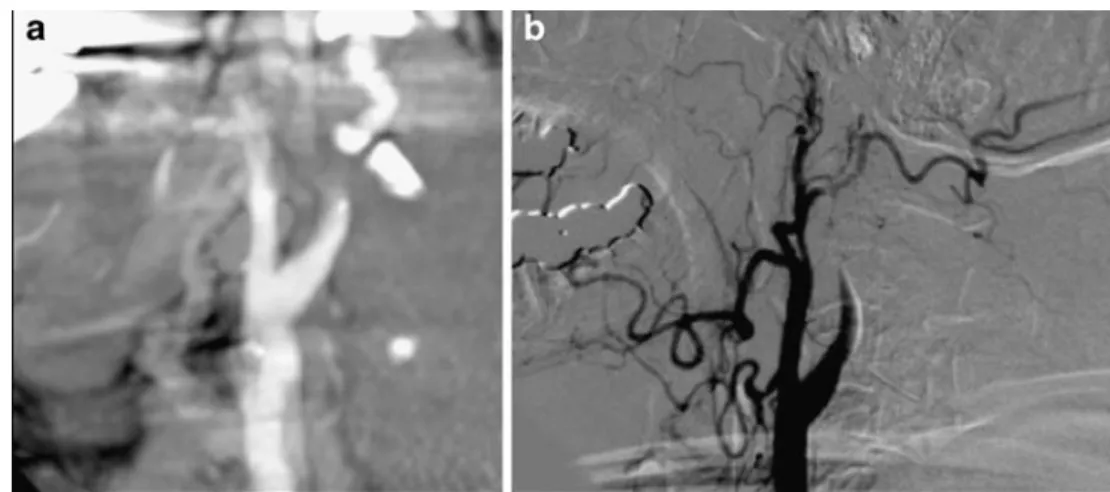
Fig. 3 Left-sided dense MCAsign (a). CT angiography shows occlusion of the left M1 seg-ment of the MCA (b), while there is beginning left MCA hypodensity (c) and severe hypoperfusion (d)
Fig. 4 Hyperdense basilar artery sign in a patient with signs of brain stem dysfunction. The unenhanced CT (a) shows hyperdensity of the vessel with no enhancement after contrast administration (b). There is a stop of the contrast column on vertebral angiography (c) and the posterior cerebral arteries are not visible. After thrombolysis, the vessel is no longer hyperdense (d)
3
,
4
,
5
, and
6
). It is present in 35% to 67% [
19
] and is
known to disappear after recanalization. The dense artery
sign has been associated with a poorer outcome in most
studies [
20
–
23
]. When such an occlusion is seen in a small
middle cerebral artery (MCA) branch, it is referred to as the
dot sign [
24
,
25
]. False positives are known to occur in
cases with vascular calcification, patients with a high
hematocrit. This sign can be visible in any affected cerebral
artery. Von Kummer et al. [
17
] found it to have a 32%
positive predictive value (PPV) for fatal clinical outcome.
Brain swelling with sulcal effacement This is one of the
earlier signs that may appear and is due to the mass effect
caused by beginning water accumulation (Figs.
7
and
8
). It
was found to be present in 38% of cases and to have a 70%
PPV for fatal outcome [
17
]. In a study of only 14 patients
where it was found to be isolated, it was, however, not
found to represent severe ischemic damage [
26
].
Hypodensity Brain density, or rather the presence of
hypoen-sity in the affected vascular territory, has been widely used as a
negative selection criterion for thrombolysis. Computed
tomography shows differences in tissue composition due to
the absorption of X-rays by the tissue. This is directly
influenced by water content. In acute stroke, there is the early
development of cytotoxic edema which, after a time, leads to
infarction. CT is able to differentiate gray from white matter
due to the slight differences in water content. The water
Fig. 5 Hyperdense rightposterior cerebral artery (a, arrow). There is severe hypoperfusion in the right PCA territory
Fig. 6 Dot sign in the right sylvian fissure (arrow)
concentration in gray matter is normally of 85% and 75% in
the white matter. In acute stroke, as water accumulates, this
leads to a decrease in Hounsfield units [
27
] with visual
homogenization of brain tissue at first: This leads to the loss of
gray/white differentiation that leads to the disappearance of the
basal ganglia (Fig.
9
), the cortical, and insular ribbons as well.
The method used is the one of the third of the affected
MCA territory: When a hypodensity is visible that affects one
third or more of the territory, this patient will show no benefit
of thrombolysis but an increase of having lethal hemorrhage
according to the European Cooperative Acute Stroke Study
(ECASS) criteria [
28
]. Prior, Von Kummer et al. [
17
] had
found that a hypodensity covering more than 50% of the
middle cerebral artery territory had an 85% PPV for fatal
outcome. Lev et al. [
29
] found that using variable window
settings could improve the detection of hypoattenuation.
CT perfusion imaging Perfusion imaging allows
investigat-ing the presence or absence of alterations in cerebral
perfusion in patients with suspected stroke [
30
–
35
] (Figs.
10
and
11
). One drawback at the moment is that most scanners
still only offer coverage over a few slices corresponding to
a few centimeters instead of the whole brain; this does not
always allow evaluating exact perfusion deficit volumes if
they exceed the volume studied and also does not allow
investigating areas outside the area chosen. Brain perfusion
with MR has evolved into a whole brain method that allows
full coverage of the neurocranium; this is now possible with
a few select scanners either with extensive row numbers or
with special techniques. After having found that penumbral
thresholds could be determined by CT perfusion [
36
],
Schaefer et al. [
37
] found a high correlation between CT and
MR perfusion for the determination of the penumbra. There is,
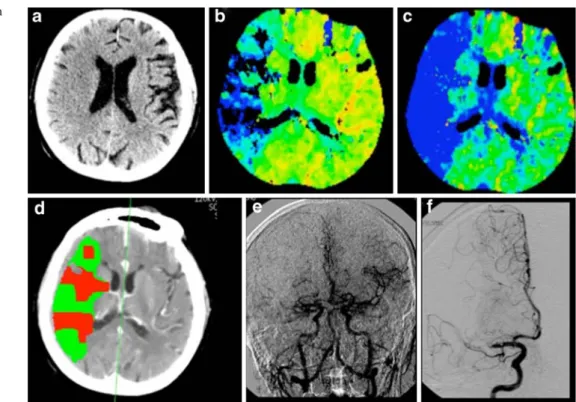
Fig. 7 Sulcal effacement: Onthe unenhanced CT, there is sulcal effacement in the right hemisphere (a); this is associated with severe hypoperfusion as seen on the MTT maps (b, c). The penumbra map shows inhomogenous perfusion (d); the angiogram shows occlusion with
hypovascularization (e) on the parenchymography overview due to M1 occlusion (f)
Fig. 8 Patient with a right-sided hand paresis: On CT, there is slight sulcal effacement in the left motor cortex (a); on diffusion-weighted MRI, the small cortical lesion lights up (b)
however, the trend for the development of CT perfusion
strategies covering more and more of the volume of the brain,
with scanners even achieving 320 slices, but these are at the
moment more prototypes. Also, the development of CT
perfusion techniques based on flat panel CT should allow
combining all axial imaging modalities (CT, CT angiography
(CTA), CT perfusion) with the interventional techniques in
order to facilitate and combine diagnostic and interventional
procedures in order to gain time.
Many CT manufacturers now provide automated or
semi-automated calculations of perfusion and penumbral
maps. While the perfusion maps are of use in the
management of therapeutic measures, the use of penumbra
maps has not been fully validated until now. We have found
that an easy way of estimating penumbra is the simple
subtraction of time to peak (TTP) area from mean transit
time (MTT) area of hypoperfusion; while this may not be
standard and may not be hemodynamically accurate, it does
function as a simple model to assess perfusion differences
[
38
]. While Wintermark et al. found that decision making
could be done as well with CT as with MRI in all cases but
one, this was not entirely supported by the findings of the
DIAS-2 Study where a difference in the decisions was
found based on CT perfusion or MR perfusion regarding
the delineation of the penumbra; this may, however, been
due also to technical and patient selection differences [
39
].
CT angiography Due to the development of faster multi-array
scanner, CTA can now cover a larger and larger area going
from the aortic arch or even the heart into the Circle of Willis
(Figs.
12
and
13
). This allows for the complete all-in-one
approach that leads to a combined neuro-cardio-radiological
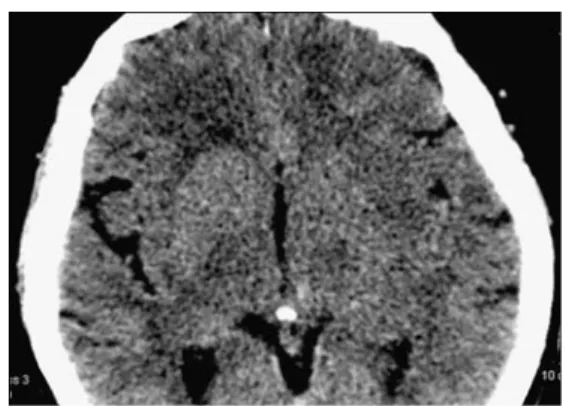
Fig. 9 Patient with left hemispheric stroke: The striatum on the left isno longer clearly visible as on the right
Fig. 10 Patient with signs of right hemispheric ischemia. There is hypoperfusion with a MTT-TTP“mismatch” (a, b); on the unenhanced CT, there is a small hypodensity (c). After thrombolysis, we see almost complete reperfusion (d, e) and a small cortical lesion on the CT (f)
workup. The presence of more distal occlusions was
associated with better outcome [
40
].
Source images Some authors have advocated using the
source images of CTA acquisitions in the assessment of
infarction (Figs.
14
,
15
, and
16
). While this gives an
improved visualization of the affected area, there is a
perfusion effect, and it should not be confused with acute
hypodensity. This was shown by both Schaefer and Rosenthal
[
41
,
42
]: In vertebrobasilar occlusion, this hypoattenuation
was found to be the best predicted by Schaefer et al. [
41
] and
for MCA infarction by Rosenthal et al. [
42
]. Camargo et al.
[
43
] found them to be more sensitive than non-enhanced
images: 70% vs 48% sensitivity for detection. When applied
to the Alberta Stroke Program Early CT score, there is also
an improvement of determination of outcome when
com-Fig. 11 Patient with massive left hemispheric stroke but no penumbra: There is a match between MTT TTP and CBF maps; the penumbra map shows almost no tissue at risk and only infarction. On the follow-up DWI, this large MCA infarction is confirmedFig. 12 Patient with left MCA stroke: Unenhanced CT shows left hyperdense MCA sign; on angio-CT, there is non-opacification of the same vessel segment, seen better on the 3D reconstructions and confirmed by DSA
pared to unenhanced images [
44
,
45
]. Schwamm et al. [
46
]
also found that the hypoattenuation on CTA images could
improve prediction of post-therapeutic hemorrhage.
Prognostic signs on imaging Overall, the presence of
hypodensity of more than one third alone is considered a
negative prognostic sign. The remaining early signs are also
considered to some degree to be of unfavorable prognostic
value [
16
].
Time window Once there has been a decrease in blood flow
due to embolus or occlusion, the timeframe available to
Fig. 13 Patient with carotidartery dissection: Reconstruc-tion of the CTA shows a flame signs, confirmed by DSA
Fig. 14 Seventy-two-year-old female patient with right hemispheric stroke. On the unenhanced CT, there is slight sulcal effacement and
ventricular asymmetry (a). This is more apparent on the angio-CT source images (b), even more on the angio-CT reconstructions (c). On DSA, there was a
Fig. 15 Patient with signs of right hemispheric stroke. The thick reconstructions of the CTA show the compromised better visualized (a, b) than the axial unenhanced slices (c, d)
Fig. 16 Patient with a left hemispheric cerebellar infarction. On the unenhanced CT, the lesion is almost not visible (a), whereas it becomes more apparent on the thick slab reconstructions (b, c). The lesion is confirmed by MRI (c–h)
treat is very short. Up until now, there was an agreement for
intravenous thrombolysis that this therapeutic window was
of 3 h for the MCA territory and longer for the posterior
circulation due to the collateralization of these territories.
ECASS 3 has recently shown that the time window has
now increased to 4.5 h [
4
]. While CT perfusion can monitor
the presence or not of revascularization, this technique
might be complemented by the use of transcranial Doppler
to follow the effect on revascularization. Also, if one is
beyond the timeframe for the accepted drugs, other
mechanical techniques might be added with benefit on
revascularization [
47
].
Reperfusion therapies Once it has been established that a
patient has a stroke and that he can be treated, imaging
should try to detect not only which cases are amenable to
treatment but also which ones should be used. While there
is no clear consensus, it is possible that density of the
thrombus will play a role. What is certain is that length of
the thrombus will play a role: A longer thrombi will
probably necessitate intravascular therapy. Vora et al. [
48
]
found that hemorrhagic infarctions were related to the CT
infarction, while parenchymal hematomas are associated
with the presence of tandem occlusions, hyperglycemia
among others, after treatment.
Follow-up imaging with CT Despite literature reporting
higher incidence of post-stroke hemorrhage, a retrospective
study of 91 patients showed only 3.6% of patients with
ischemic stroke to have hemorrhage [
49
]. After
intra-arterial thrombolysis, large hyperdense areas are often seen
on CT, and it is sometimes unclear whether this is blood,
contrast, or a mixture of both (Fig.
17
). A recent study has
tried to provide answers to this burning question: Contrast
enhancement where the blood–brain barrier (BBB) is intact
leads to hemorrhage in 20–30%, whereas contrast
extrav-asation where the BBB is broken leads to hemorrhage in
almost 100% [
50
].
Conclusions
Computed tomography still has an important role to play in
the investigation of patients with signs suggestive of acute
cerebral ischemia. It still is more easy to use for the
detection of hemorrhage since most radiologists will not be
acquainted with the early MR appearance of hemorrhage.
The problem most clinicians are nowadays confronted with
when dealing with radiology, and this is especially true
when dealing with a disease such as stroke, is to quickly
provide a precise answer to a difficult question by using a
challenging technology. Computed tomography has
remained at the forefront of imaging in acute stroke because
it is slightly faster than for example MR, and patient
handling is simpler and more secure because there are no
concerns regarding claustrophobia and magnetic fields (the
patients must not be metal-free as they should be in MRI).
This is why it is the method that has been used up until now
within the scope of the major defining drug studies for
thrombolysis (ECASS) and is the method recommended by
most guidelines [
51
,
52
]. While CT is the gold standard for
the clear-cut exclusion of hemorrhage, the use of the
remaining acute ischemic signs is lightly more open to
debate. Indeed, while most are known to be of negative
prognosis, they cannot be used alone to prevent a patient
from undergoing thrombolysis. The really established CT
criteria for thrombolysis are on the one hand the presence
or absence of hemorrhage and on the other hand the
presence of a large tissular hypodensity: Both these signs
have been demonstrated to be of use to exclude patients
from potential harmful effects of therapy. This is of course
true for the treatment that we are currently using now with
tissue plasminogen activator. However, the potential
emer-gence of new drugs or even the switch toward mechanical
Fig. 17 Patient having undergone intra-arterial thrombolysis for aleft-hemispheric stroke. The CT shows hyperdensity in the left basal ganglia corresponding to contrast
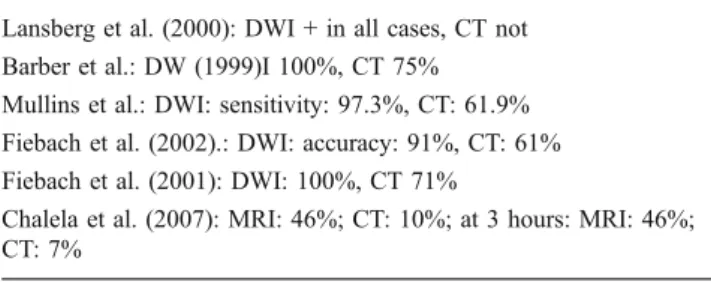
Table 1 Overview of studies comparing CT and MR in acute stroke. Lansberg et al. (2000): DWI + in all cases, CT not
Barber et al.: DW (1999)I 100%, CT 75% Mullins et al.: DWI: sensitivity: 97.3%, CT: 61.9% Fiebach et al. (2002).: DWI: accuracy: 91%, CT: 61% Fiebach et al. (2001): DWI: 100%, CT 71%
Chalela et al. (2007): MRI: 46%; CT: 10%; at 3 hours: MRI: 46%; CT: 7%
thrombectomy and vessel recanalization therapies may
render some of these signs (hypodensity) of less use for
the future.
Also, there has been great progress in scanner hardware,
and these new CT units now allow scanning the whole
brain in a few seconds. Perfusion coverage is also
improved, and while a few prototypes allow whole brain
coverage, unfortunately, most scanners can only cover a
few slices. In many centers, CT has remained the standard
for all acute stroke investigations. However, there is a shift
of paradigm in some centers due to some specific
advantages of MRI. Indeed, MRI will detect better small
cortical or lacunar infarctions. This certainly explains why
in most studies (Table
1
), MR with diffusion imaging is
seen as a clearly superior method [
53
–
57
]. Whatever
method is chosen, it is important that certain standards be
followed that are being established at the moment [
58
].
However, many of the early signs that are known can be
seen on very close inspection of scans by experienced
readers. While more difficult to interpret than the light bulb
effect we see on diffusion-weighted imaging (DWI) [
59
],
these signs are often seen and can help in the workup. Also,
despite the fact that from known literature MRI should be
equivalent in the detection of hemorrhage, CT is still the
gold standard for the exclusion of hemorrhage in the acute
phase, which is the main aim of radiology. For more
complicated studies about the behavior of the ischemic
lesion related to ischemia or neuroprotective drugs, CT will
not be as useful as MRI due to the less clear delineation of
the acute lesions. Also, whenever follow-ups are required,
in order to avoid excessive radiation doses being applied to
the patient, one might switch over to MRI which also helps
in improving final lesion volume assessment. Also, while
not yet playing a role in acute stroke management, hybrid
technologies such as PET-CT have a role for the workup of
patients with stroke who have a carotid stenosis as the
underlying cause. CT itself is in a constant flux of
development, and even more advanced methods such as
320 row detector CT units [
60
] or the advent of plat
panel-derived CT [
61
] will allow us to go faster, acquire more
tissular parameters and rendering acquisition, and evaluate
more easily without slowing down the pre-therapeutic
process.
Conflict of interest statement We declare that we have no conflict of interest.
References
1. The NINDS rt-PA stroke study group (1995) Tissue plasminogen activator for acute ischemic stroke. N Engl J Med 333:1581–1587
2. Hacke W, Kaste M, Fieschi C, Toni D, Lesaffre E, von Kummer R, Boysen G, Bluhmki E, Höxter G, Mahagne MH et al (1995) Intravenous thrombolysis with recombinant tissue plasminogen activator for acute hemispheric stroke. The European Cooperative Acute Stroke Study (ECASS). JAMA 274(13):1017–1025 3. Hacke W, Kaste M, Fieschi C, von Kummer R, Davalos A, Meier D,
Larrue V, Bluhmki E, Davis S, Donnan G, Schneider D, Diez-Tejedor E, Trouillas P (1998) Randomised double-blind placebo-controlled trial of thrombolytic therapy with intravenous alteplase in acute ischaemic stroke (ECASS II). Second European–Australasian Acute Stroke Study Investigators. Lancet 352(9136):1245–1251
4. Hacke W, Kaste M, Bluhmki E, Brozman M, Dávalos A, Guidetti D, Larrue V, Lees KR, Medeghri Z, Machnig T, Schneider D, von Kummer R, Wahlgren N, Toni D, ECASS Investigators (2008) Thrombolysis with alteplase 3 to 4.5 hours after acute ischemic stroke. N Engl J Med 359(13):1317–1329
5. Del Zoppo GJ, Higashida RT, Furlan AJ, Pessin MS, Rowley HA, Gent M, PROACT Investigators (1998) PROACT: a phase II randomized trial of recombinant pro-urokinase by direct arterial delivery in acute middle cerebral artery stroke. Prolyse in acute cerebral thromboembolism. Stroke 29:4–11
6. Lewandowski C, Frankel M, Tomsick T, Frey J, Clark W, Starkman S, Grotta J, Spilker J, Khoury J, Brott T, The EMS Bridging Trial Investigators (1999) Combined intravenous and intra-arterial r-tPA versus intra-arterial IV t thrombolysis therapy of acute ischemic stroke. Stroke 30:2598–2605
7. Adams HP Jr, del Zoppo G, Alberts MJ, Bhatt DL, Brass L, Furlan A, Grubb RL, Higashida RT, Jauch EC, Kidwell C, Lyden PD, Morgenstern LB, Qureshi AI, Rosenwasser RH, Scott PA, Wijdicks EF, American Heart Association; American Stroke Association Stroke Council; Clinical Cardiology Council; Cardio-vascular Radiology and Intervention Council; Atherosclerotic Peripheral Vascular Disease and Quality of Care Outcomes in Research Interdisciplinary Working Groups (2007) Guidelines for the early management of adults with ischemic stroke: a guideline from the American Heart Association/American Stroke Associa-tion Stroke Council, Clinical Cardiology Council, Cardiovascular Radiology and Intervention Council, and the Atherosclerotic Peripheral Vascular Disease and Quality of Care Outcomes in Research Interdisciplinary Working Groups: the American Acad-emy of Neurology affirms the value of this guideline as an educational tool for neurologists. Stroke 38(5):1655–1711 8. Adams HP Jr, Adams RJ, Brott T, del Zoppo GJ, Furlan A, Goldstein
LB, Grubb RL, Higashida R, Kidwell C, Kwiatkowski TG, Marler JR, Hademenos GJ, Stroke Council of the American Stroke Association (2003) Guidelines for the early management of patients with ischemic stroke: a scientific statement from the Stroke Council of the American Stroke Association. Stroke 34(4):1056–1083 9. Lövblad KO, Baird AE (2006) Actual diagnostic approach to the
acute stroke patient. Eur Radiol 16(6):1253–1269
10. Lövblad KO, Laubach HJ, Baird AE, Curtin F, Schlaug G, Edelman RR, Warach S (1998) Clinical experience with diffusion-weighted MR in patients with acute stroke. AJNR Am J Neuro-radiol 19(6):1061–1066
11. Lövblad KO, Baird AE, Schlaug G, Benfield A, Siewert B, Voetsch B, Connor A, Burzynski C, Edelman RR, Warach S (1997) Ischemic lesion volumes in acute stroke by diffusion-weighted magnetic resonance imaging correlate with clinical outcome. Ann Neurol 42(2):164–170
12. Baird AE, Benfield A, Schlaug G, Siewert B, Lövblad KO, Edelman RR, Warach S (1997) Enlargement of human cerebral ischemic lesion volumes measured by diffusion-weighted mag-netic resonance imaging. Ann Neurol 41(5):581–589
13. Schellinger PD, Jansen O, Fiebach JB, Hacke W, Sartor K (1999) A standardized MRI stroke protocol: comparison with CT in hyperacute intracerebral hemorrhage. Stroke 30(4):765–768
14. Kidwell CS, Chalela JA, Saver JL, Starkman S, Hill MD, Demchuk AM, Butman JA, Patronas N, Alger JR, Latour LL, Luby ML, Baird AE, Leary MC, Tremwel M, Ovbiagele B, Fredieu A, Suzuki S, Villablanca JP, Davis S, Dunn B, Todd JW, Ezzeddine MA, Haymore J, Lynch JK, Davis L, Warach S (2004) Comparison of MRI and CT for detection of acute intracerebral hemorrhage. JAMA 292(15):1823–1830
15. Chalela JA, Kidwell CS, Nentwich LM, Luby M, Butman JA, Demchuk AM, Hill MD, Patronas N, Latour L, Warach S (2007) Magnetic resonance imaging and computed tomography in emergency assessment of patients with suspected acute stroke: a prospective comparison. Lancet 369(9558):293–298
16. Tomura N, Uemura K, Inugami A, Fujita H, Higano S, Shishido F (1988) Early CT finding in cerebral infarction: obscuration of the lentiform nucleus. Radiology 168(2):463–467
17. von Kummer R, Meyding-Lamadé U, Forsting M, Rosin L, Rieke K, Hacke W, Sartor K (1994) Sensitivity and prognostic value of early CT in occlusion of the middle cerebral artery trunk. AJNR Am J Neuroradiol 15(1):9–1
18. von Kummer R, Holle R, Gizyska U, Hofmann E, Jansen O, Petersen D, Schumacher M, Sartor K (1996) Interobserver agreement in assessing early CT signs of middle cerebral artery infarction. AJNR Am J Neuroradiol 17(9):1743–1748
19. Schuknecht B, Ratzka M, Hofmann E (1990) The“dense artery sign”—major cerebral artery thromboembolism demonstrated by computed tomography. Neuroradiology 32(2):98–103 (Erratum in: Neuroradiology 1991;33(1):94)
20. Ricci S, Caputo N, Aisa G, Celani MG, Chiurulla C, Mercuri M, Guercini G, Scaroni R, Senin U, Signorini E (1991) Prognostic value of the dense middle cerebral artery sign in patients with acute ischemic stroke. Ital J Neurol Sci 12(1):45–47
21. Launes J, Ketonen L (1987) Dense middle cerebral artery sign: an indicator of poor outcome in middle cerebral artery area infarction. J Neurol Neurosurg Psychiatry 50(11):1550–1552 22. Grotta JC, Welch KM, Fagan SC, Lu M, Frankel MR, Brott T, Levine
SR, Lyden PD (2001) Clinical deterioration following improvement in the NINDS rt-PA Stroke Trial. Stroke 32(3):661–668
23. Manno EM, Nichols DA, Fulgham JR, Wijdicks EF (2003) Computed tomographic determinants of neurologic deterioration in patients with large middle cerebral artery infarctions. Mayo Clin Proc 78(2):156–160
24. Leary MC, Kidwell CS, Villablanca JP, Starkman S, Jahan R, Duckwiler GR, Gobin YP, Sykes S, Gough KJ, Ferguson K, Llanes JN, Masamed R, Tremwel M, Ovbiagele B, Vespa PM, Vinuela F, Saver JL (2003) Validation of computed tomographic middle cerebral artery “dot” sign: an angiographic correlation study. Stroke 34(11):2636–2640
25. Barber PA, Demchuk AM, Hudon ME, Pexman JH, Hill MD, Buchan AM (2001) Hyperdense sylvian fissure MCA“dot” sign: a CT marker of acute ischemia. Stroke 32(1):84–88
26. Na DG, Kim EY, Ryoo JW, Lee KH, Roh HG, Kim SS, Song IC, Chang KH (2005) CT sign of brain swelling without concomitant parenchymal hypoattenuation: comparison with diffusion- and perfusion-weighted MR imaging. Radiology 235(3):992–948 27. Dzialowski I, Weber J, Doerfler A, Forsting M, von Kummer R
(2004) Brain tissue water uptake after middle cerebral artery occlusion assessed with CT. J Neuroimaging 14(1):42–48 28. von Kummer R, Allen KL, Holle R, Bozzao L, Bastianello S,
Manelfe C, Bluhmki E, Ringleb P, Meier DH, Hacke W (1997) Acute stroke: usefulness of early CT findings before thrombolytic therapy. Radiology 205(2):327–333
29. Lev MH, Farkas J, Gemmete JJ, Hossain ST, Hunter GJ, Koroshetz WJ, Gonzalez RG (1999) Acute stroke: improved nonenhanced CT detection-benefits of soft-copy interpretation by using variable window width and center level settings. Radiology 213(1):150–155
30. Eastwood JD, Lev MH, Wintermark M, Fitzek C, Barboriak DP, Delong DM, Lee TY, Azhari T, Herzau M, Chilukuri VR, Provenzale JM (2003) Correlation of early dynamic CT perfusion imaging with whole-brain MR diffusion and perfusion imaging in acute hemi-spheric stroke. AJNR Am J Neuroradiol 24(9):1869–1875 31. Wintermark M, Thiran JP, Maeder P, Schnyder P, Meuli R (2001)
Simultaneous measurement of regional cerebral blood flow by perfusion CT and stable xenon CT: a validation study. AJNR Am J Neuroradiol 22(5):905–914
32. Wintermark M, Reichhart M, Thiran JP, Maeder P, Chalaron M, Schnyder P, Bogousslavsky J, Meuli R (2002) Prognostic accuracy of cerebral blood flow measurement by perfusion computed tomography, at the time of emergency room admission, in acute stroke patients. Ann Neurol 51(4):417–432
33. Wintermark M, Fischbein NJ, Smith WS, Ko NU, Quist M, Dillon WP (2005) Accuracy of dynamic perfusion CT with deconvolu-tion in detecting acute hemispheric stroke. AJNR Am J Neuro-radiol 26(1):104–112
34. Wintermark M, Meuli R, Browaeys P, Reichhart M, Bogousslavsky J, Schnyder P, Michel P (2007) Comparison of CT perfusion and angiography and MRI in selecting stroke patients for acute treatment. Neurology 68(9):694–697
35. Wintermark M, Flanders AE, Velthuis B, Meuli R, van Leeuwen M, Goldsher D, Pineda C, Serena J, van der Schaaf I, Waaijer A, Anderson J, Nesbit G, Gabriely I, Medina V, Quiles A, Pohlman S, Quist M, Schnyder P, Bogousslavsky J, Dillon WP, Pedraza S (2006) Perfusion-CT assessment of infarct core and penumbra: receiver operating characteristic curve analysis in 130 patients suspected of acute hemispheric stroke. Stroke 37(4):979–985 36. Schaefer PW, Roccatagliata L, Ledezma C, Hoh B, Schwamm
LH, Koroshetz W, Gonzalez RG, Lev MH (2006) First-pass quantitative CT perfusion identifies thresholds for salvageable penumbra in acute stroke patients treated with intra-arterial therapy. AJNR Am J Neuroradiol 27(1):20–25
37. Schaefer PW, Barak ER, Kamalian S, Gharai LR, Schwamm L, Gonzalez RG, Lev MH (2008) Quantitative assessment of core/ penumbra mismatch in acute stroke: CT and MR perfusion imaging are strongly correlated when sufficient brain volume is imaged. Stroke 39(11):2986–2992
38. Knoepfli AS, Sekoranja L, Bonvin C, Delavelle J, Kulcsar Z, Rüfenacht D, Yilmaz H, Sztajzel R, Altrichter S, Lövblad KO (2009) Evaluation of perfusion CT and TIBI grade in acute stroke for predicting thrombolysis benefit and clinical outcome. J Neuroradiol 36:131–137
39. Hacke W, Furlan AJ, Al-Rawi Y, Davalos A, Fiebach JB, Gruber F, Kaste M, Lipka LJ, Pedraza S, Ringleb PA, Rowley HA, Schneider D, Schwamm LH, Leal JS, Söhngen M, Teal PA, Wilhelm-Ogunbiyi K, Wintermark M, Warach S (2009) Intrave-nous desmoteplase in patients with acute ischaemic stroke selected by MRI perfusion–diffusion weighted imaging or perfusion CT (DIAS-2): a prospective, randomised, double-blind, placebo-controlled study. Lancet Neurol 8:151–150
40. Sims JR, Rordorf G, Smith EE, Koroshetz WJ, Lev MH, Buonanno F, Schwamm LH (2005) Arterial occlusion revealed by CT angiography predicts NIH stroke score and acute outcomes after IV tPA treatment. AJNR Am J Neuroradiol 26(2):246–251 41. Schaefer PW, Yoo AJ, Bell D, Barak ER, Romero JM, Nogueira
RG, Lev MH, Schwamm LH, Gonzalez RG, Hirsch JA (2008) CT angiography-source image hypoattenuation predicts clinical out-come in posterior circulation strokes treated with intra-arterial therapy. Stroke 39(11):3107–3109
42. Rosenthal ES, Schwamm LH, Roccatagliata L, Coutts SB, Demchuk AM, Schaefer PW, Gonzalez RG, Hill MD, Halpern EF, Lev MH (2008) Role of recanalization in acute stroke outcome: rationale for a CT angiogram-based “benefit of recanalization” model. AJNR Am J Neuroradiol 29(8):1471–1475
43. Camargo EC, Furie KL, Singhal AB, Roccatagliata L, Cunnane ME, Halpern EF, Harris GJ, Smith WS, Gonzalez RG, Koroshetz WJ, Lev MH (2007) Acute brain infarct: detection and delineation with CT angiographic source images versus nonenhanced CT scans. Radiology 244(2):541–548
44. Coutts SB, Lev MH, Eliasziw M, Roccatagliata L, Hill MD, Schwamm LH, Pexman JH, Koroshetz WJ, Hudon ME, Buchan AM, Gonzalez RG, Demchuk AM (2004) ASPECTS on CTA source images versus unenhanced CT: added value in predicting final infarct extent and clinical outcome. Stroke 35(11):2472–2476
45. Parsons MW, Pepper EM, Chan V, Siddique S, Rajaratnam S, Bateman GA, Levi CR (2005) Perfusion computed tomography: prediction of final infarct extent and stroke outcome. Ann Neurol 58(5):672–679
46. Schwamm LH, Rosenthal ES, Swap CJ, Rosand J, Rordorf G, Buonanno FS, Vangel MG, Koroshetz WJ, Lev MH (2005) Hypoattenuation on CT angiographic source images predicts risk of intracerebral hemorrhage and outcome after intra-arterial reperfusion therapy. AJNR Am J Neuroradiol 26(7):1798–1803 47. Gobin YP, Starkman S, Duckwiler GR, Grobelny T, Kidwell CS,
Jahan R, Pile-Spellman J, Segal A, Vinuela F, Saver JL (2004) MERCI 1: a phase 1 study of mechanical embolus removal in cerebral ischemia. Stroke 35(12):2848–2854
48. Vora NA, Gupta R, Thomas AJ, Horowitz MB, Tayal AH, Hammer MD, Uchino K, Wechsler LR, Jovin TG (2007) Factors predicting hemorrhagic complications after multimodal reperfu-sion therapy for acute ischemic stroke. AJNR Am J Neuroradiol 28(7):1391–1394
49. Mullins ME, Lev MH, Schellingerhout D, Gonzalez RG, Schaefer PW (2005) Intracranial hemorrhage complicating acute stroke: how common is hemorrhagic stroke on initial head CT scan and how often is initial clinical diagnosis of acute stroke eventually confirmed? AJNR Am J Neuroradiol 26(9):2207–2212
50. Yoon W, Seo JJ, Kim JK, Cho KH, Park JG, Kang HK (2004) Contrast enhancement and contrast extravasation on computed tomography after intra-arterial thrombolysis in patients with acute ischemic stroke. Stroke 35(4):876–881
51. Masdeu JC, Irimia P, Asenbaum S, Bogousslavsky J, Brainin M, Chabriat H, Herholz K, Markus HS, Martínez-Vila E, Niederkorn K, Schellinger PD, Seitz RJ (2006) EFNS.EFNS guideline on neuroimaging in acute stroke. Report of an EFNS Task Force. Eur J Neurol 13(12):1271–1283
52. Köhrmann M, Jüttler E, Huttner HB, Nowe T, Schellinger PD (2007) Acute stroke imaging for thrombolytic therapy—an update. Cerebrovasc Dis 24(2–3):161–169
53. Lansberg M, Albers G, Beaulieu C, Marks M (2000) Comparison of diffusion-weighted MRI and CT in acute stroke. Neurology 54:1557–1561
54. Barber P, Darby D, Desmond P, Gerraty R, Yang Q, Li T, Jolley D, Donnan G, Tress B, Davis S (1999) Identification of major ischaemic change: diffusion-weighted imaging versus computed tomography. Stroke 30:2059–2065
55. Mullins ME, Schafer PW, Sorensen AG, Halpern EF, Ay H, He J, Koroshetz WJ, Gonzalez RG (2002) CT and conventional and diffusion-weighted MR imaging in acute stroke: study in 691 patients at presentation to the emergency department. Radiology 224:353–360
56. Fiebach JB, Schellinger PD, Jansen O, Meyer M, Wilde P, Bender J, Schramm P, Jüttler E, Oehler J, Hartmann M, Hähnel S, Knauth M, Hache W, Sartor K (2002) CT and diffusion-weighted MR imaging inrandomized order. Diffusion-weighted Imaging results in higher accuracy and lower interrater variability in the diagnosis of hyperacute ischemic stroke. Stroke 33:2206–2210
57. Fiebach J, Jansen O, Schellinger P, Knauth M, Hartmann M, Heiland S, Ryssel H, Pohlers O, Hacke W, Sartor K (2001) Comparison of CT with diffusion-weighted MRI in patients with hyperacute stroke. Neuroradiology 43(8):628–632
58. Wintermark M, Albers GW, Alexandrov AV, Alger JR, Bammer R, Baron JC, Davis S, Demaerschalk BM, Derdeyn CP, Donnan GA, Eastwood JD, Fiebach JB, Fisher M, Furie KL, Goldmakher GV, Hacke W, Kidwell CS, Kloska SP, Köhrmann M, Koroshetz W, Lee TY, Lees KR, Lev MH, Liebeskind DS, Ostergaard L, Powers WJ, Provenzale J, Schellinger P, Silbergleit R, Sorensen AG, Wardlaw J, Wu O, Warach S (2008) Acute stroke imaging research roadmap. AJNR Am J Neuroradiol 29(5):e23–e30 59. Koroshetz WJ, Gonzalez G (1997) Diffusion-weighted MRI: an
ECG for“brain attack”? Ann Neurol 41(5):565–566
60. San Millán Ruíz D, Murphy K, Gailloud P (2009) 320-Multidetector row whole-head dynamic subtracted CT angiogra-phy and whole-brain CT perfusion before and after carotid artery stenting: technical note. Eur J Radiol. 2009 Apr 30 (in press) 61. Söderman M, Babic D, Holmin S, Andersson T (2008) Brain
imaging with a flat detector C-arm: technique and clinical interest of XperCT. Neuroradiology 50(10):863–868