Design and Evaluation of Decision Aids
for Control of High-Speed Trains:
Experiments and Model
by
Shumei Yin Askey
Submitted to the Department of Mechanical Engineering in Partial Fulfillment of the Requirements
for the Degree of DOCTOR OF PHILOSOPHY
at the
MASSACHUSETTS INSTITUTE OF TECHNOLOGY
June 1995
© Massachusetts Institute of Technology 1995 All rights reserved
<'.
Signature of Author
Certified by
Department of Mechanical Engineering May 1995
Thomas B. Sheridan Professor of Engineering and Applied Psychology Thesis Supervisor
Accepted by _ _
Ain A. Sonin i•iASAGHUSETTs G~4runP, Departmental Committee on Graduate Studies
OF TECH NOLLOGY
AUG
311995
Design and Evaluation of Decision Aids for Control of
High-Speed Trains: Experiments and Model
by
Shumei Yin Askey
Submitted to the Department of Mechanical Engineering on 23 May 1995 in partial fulfillment of the
requirements for the Degree of
Doctor of Philosophy in Mechanical Engineering
Abstract
The objective of this research was to develop computer-based decision aids for control of high-speed trains wherein the human driver is in charge, and to investigate the impact of these aids on safety and operational efficiency. In particular, this research sought to design and evaluate decision aids for drivers to compensate for human limitations in signal detec-tion and informadetec-tion processing that are hard-pressed by high-speed locomodetec-tion. Three concepts of aiding, referred to as preview aiding, predictive aiding, and advisory aiding, were proposed, then implemented in a high-speed rail system simulator as integrated cab displays with level of aid graded from low to high. The three displays are referred to as the preview display, the predictor display, and the advisor display. Each level of display in-corporated a superset of the aiding cues implemented in the next-lower level. A conven-tional high-speed train cab environment was implemented as a baseline for comparison purposes and is referred to as the basic display.
Formal human-in-the-loop experiments were conducted to evaluate effects of these displays on driver-train system performance. Preview aiding was found to improve situation
awareness-the subjects' reaction time to an unexpected signal change being reduced from 8.6 sec with the basic display to 1.4 sec with the aided displays. Predictive aiding im-proved the subjects' decision to use braking systems and, therefore, offers the promise of increased safety. The advisory aiding was found to reduce total cost (energy consumption plus a weighted schedule deviation) by up to 11% with respect to the basic display on a
simple experimental track. The display aids were also found to significantly improve both station-stopping accuracy and schedule adherence. A simulation with a rule-based driver model confirmed the improvement in performance observed with the predictor display. The extra information in the aided displays increased "head-down" time. The extra
information, however, was not found to overload subjects. In fact, subjects rated the advi-sor display as imposing the lowest overall workload and preferred it as their first choice to the basic or the predictor display.
Thesis Committee: Dr. Thomas B. Sheridan (Chairman)
Professor of Engineering and Applied Psychology Department of Mechanical Engineering
Dr. R. John Hansman
Professor, Department of Aeronautics and Astronautics Dr. Mark Jakiela
ACKNOWLEDGMENTS
I am deeply grateful to many people who contributed to the completion of this thesis. First, I would like to thank my advisor, Prof. Thomas B. Sheridan, for his patient guidance and strong support over the course of my doctoral study. I would also like to thank Prof. R. John Hansman and Prof. Mark Jakiela for their participation, comments, and suggestions that were very helpful towards the completion of this thesis. The effort and advice from Prof. R. John Hansman were especially instrumental.
The interaction and experience I received while working in the Human-Machine Systems Laboratory have been precious. I am very grateful to Dr. Jie Ren for, among countless other help and constructive discussions, the all-important low-cost reliable A/D converter that he built for this research that greatly enhanced the progress of this thesis. I very much appreciate Nicholas Patrick's sharing of his passion for flying, his keen thoughts on human models, and his proprietary routine for box-scatter plots. The interesting and deep discus-sions about research, life and everything, with Dave Schloerb, Nicholas Patrick, James Thompson, Shih-Ken Chen, Jian-Jun Hu, and Suyeong Kim has been a valuable part of my experience at MIT. Special thanks go to Mark Ottensmeyer and Thomas Chao for being brave enough to be my subjects. I very much appreciate the experience of teaming with Ed Lanzilotta on the project. That we could all ride though the rocky road of research that at times was very stressful is a triumph to both of us.
I am indebted to Makoto Shimamura and Hiroshi Nagaoka for arranging my visit to the East Japan Rail control center in Tokyo and a head-end ride on the Shinkansen. Dr. Carl Martland of the Civil Engineering Department of MIT generously lent me his book and material on railways to get me oriented with railroads in the beginning of this project. I would like to thank Wendy Chang, Grace Park, Joseph Wenish, and Jill Chen for their assistance during the experimental phases. I also wish to thank all the subjects for their participation in this research.
This research was sponsored by the U. S. Department of Transportation and Federal Railroad Administration and was performed in the John A. Volpe National Transportation Systems Center in Cambridge, Massachusetts. I am indebted to many people at Volpe for their interest and generous help. I especially wish to thank J. K. Pollard for his interest and gracious and timely assistance in building the throttle that was so crucial to the project's progress. Dr. Peter Mengert was readily available to discuss various issues on statistical analysis. Dr. Bob DiSario generously lent me books on experimental design and statistical analysis that helped me through the mass of experimental data. I would like to thank Dr. Donald Sussman and Mr. Robert Dorer for their continuing interest and participation in many discussions, and their assistance over the course of this research. Finally, I espe-cially wish to thank Dr. Judith Biirki-Cohen, who as the project manager has been a chief supporter and mentor. Her enthusiasm about this research, her style of management, and her approach to solving problems has set a role model for me to follow.
Last but not the least, I would like to thank my immediate and extended families (both in Georgia and in Texas) for their personal support over the years. Special thanks go to a great friend and civil engineer whose friendship has turned tough times at MIT to valuable memories-Camille Thomason. The inspiring discussions on research, science and life with my husband David Askey, a wonderful friend and kindred spirit, shine through this thesis. His support has been invaluable.
TABLE OF CONTENTS
Acknowledgment ... 3 Table of Contents ... 4 List of Illustrations ... 8 List of Tables ... ... 10 G lossary ... 11 1. Introduction ... 16 1.1 Issues ... 16 1.2 O bjectives ... 19 1.3 Background ... ... ... ... 201.3.1 Design of Decision Aids for Drivers of High-Speed Trains ... 20
1.3.2 Evaluation of Decision Aids Via Experiments ... 20
1.3.3 Evaluation of Decision Aids Via Model Simulation...21
1.4 Approach ... 23
1.5 Thesis Overview ... ...25
2. Design of Decision Aids ... 26
2.1 O verview ... 26
2.2 R ail Signals ... 27
2.3 A System Analysis of Driving Behavior ...30
2.3.1 Characteristics of Train Driving ... 30
2.3.2 A Paradigm of Train Speed Control ... 31
2.4 Effects of High-Speed Locomotion ... 33
2.5 Implications for Design of Decision Aids ... . ... 34
2.6 Cab Signals and The Basic Display ... 34
2.7 Preview Aiding and The Preview Display ... 38
2.8 Predictive Aiding and The Predictor Display ... ... .. 42
2.8 Advisory Aiding and The Advisor Display ... 45
2.9 Sum m ary ... .. 48
3. Evaluation of Preview, Predictive, and Advisory Aiding ... 49
3.1 Introduction ... 49
3.2.1 Experimental Design... ... 50
3.2.2 Conclusions ... 53
3.3 Experimental Design .... ... ... 54
3.3.1 Overview ... 54
3.3.2 Test Design: Routine Speed Control... 54
3.3.3 Test Design: Speed Control with Secondary Task ... 60
3.3.4 Test Design: Speed Control Under Emergency Scenario ... 62
3.3.5 Within-Subject Experimental Design ... 64
3.3.6 Subjects ... . ... 65
3.3.7 Procedure ... 65
3.3.7.1 Training ... ...65
3.3.7.2 Testing ... ... ... ... ... ...70
3.3.8 Experimental Setting ... ... ...70
3.4 Results and Discussion ... 71
3.4.1 Notation of Data Presentation ... 71
3.4.2 Speed Compliance ... 72
3.4.3 Time of Reaction to Signal Event ...72
3.4.4 Decision Making in the Case of Emergency Signal Events ... 77
3.4.5 T otal C ost ... 78
3.4.6 Station-Stopping Accuracy ... 82
3.4.7 Schedule Adherence ... 84
3.4.8 Ride Quality ... 85
3.4.9 Spare Visual Capacity ... ... 86
3.4.10 Workload: Immediate and Absolute Ratings...91
3.4.10.1 Time Pressure, Mental Effort, and Stress ...91
3.4.10.2 Sensitivity of Workload to Additional Tasks...94
3.4.10.3 Sensitivity of Workload to Operation Conditions...96
3.4.11 Overall Workload: Retrospective and Relative Ratings ... 98
3.4.12 Preference on Displays ... 99
3.5 Summary ... ... 101
4. Evaluation of Predictive Aiding by Model Simulation... 102
4.1 Introduction ... 102
4.2 Overview of The Model ... 103
5 . Conclusions ... 108
5.1 Summary ... ... ... 10... 108
5.2 Future Research ... 111
References ... 112
Appendix A The Volpe Center High-Speed Train Simulator... 116
A.1 M otivation ... ... 116
A.2 Functional Requirements ... 116
A.3 Simulator Modules ... 117
A .3.1 O verview ... 117
A.3.2 Functional Components and Instrumentation...1...19
A.3.3 Rapid Prototyping Capabilities ... 121
Appendix B Model of Train Dynamics ... 125
B. 1 Trainset Characteristics ... 125
B.2 Traction Characteristics ... 125
B.3 Dynamic Equations of Motion ... ... 126
Appendix C Obtaining the Minimum-Energy Speed Trajectory... 127
C. 1 The Optimal-Trajectory Problem ... 127
C.2 Solution by Dynamic Programming Technique ... ...129
Appendix D Results Summary and Discussion of The Preliminary Experiment ... 135
D. 1 Subjective Rating On Workload ... 135
D .2 Situation Awareness ... 136 D.3 Speed Compliance ... ... 37 D .4 Schedule Adherence ... 137 D.5 Station-Stopping Accuracy ... 137 D .6 Other M easures ... 138 D .7 Lessons Learned ... 138
Appendix E Guide to Optimal Throttle Manipulation ... 140
Appendix F Table of Stopping Distance ... ... 141
Appendix G Speed-Stopping Distance Curve ... 142
Appendix H Incentive System... 143
Appendix J In-Class Exercises ... 147
Appendix K Test for Entrance to Hands-on Training on High-Speed Train Simulator ... .. ... 149
Appendix L Test for Entrance to Experiments on High-Speed Train Simulator ... 159
Appendix M Learning Curves ... 163
Appendix N Subjective Workload Assessment (I)... 167
Appendix 0 Subjective Workload Assessment (II)... 168
Appendix P Implementation of Simulation Driver Model... 169
P. 1 Consideration of Functional Components ... 169
P.2 Implementation Aspects ... ... 172
P.3 Hierarchical Block Diagrams ... ... 173
LIST OF ILLUSTRATIONS
Figure 2.1 The 6-Block 7-Aspect Block Signal System... 29
Figure 2.2 Paradigm of Information Flow in Driver-Train Systems ... 31
Figure 2.3 The Basic Display ... 35
Figure 2.4 The Preview Display ... 41
Figure 2.5 The Predictor Display...43
Figure 2.6 Prediction of Response by Two-Time-Scale Simulation ... 44
Figure 2.7 The Advisor Display ... 47
Figure 3.1 Test Course of the Main Experiment ... 57
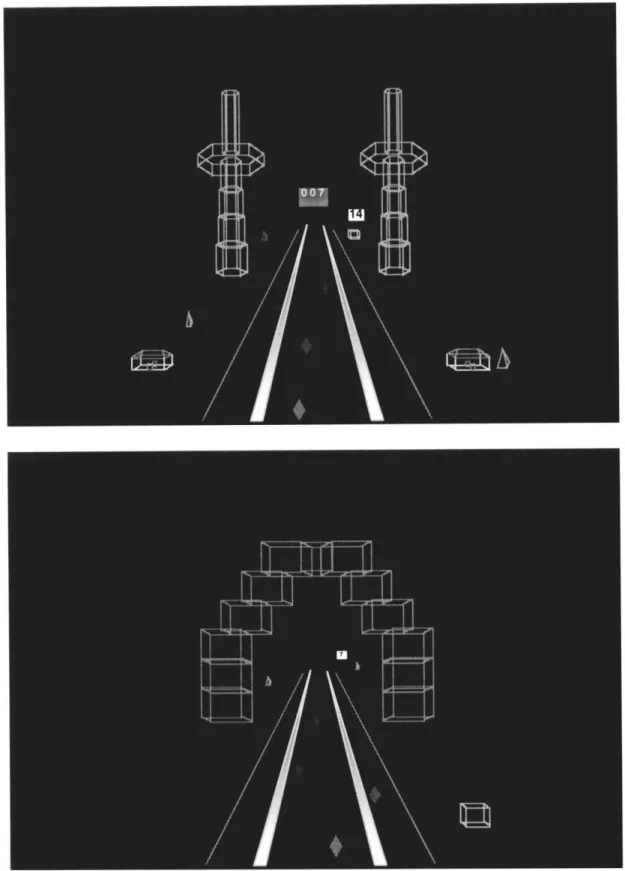
Figure 3.2 Landmarks in the Out-The-Window View ... 58
Figure 3.3 Head-Up Display for Approaching Station ... 59
Figure 3.4 The Secondary Tracking Task (in the Predictor Display) ... 61
Figure 3.5 Signal Event (at Block 6) ... 63
Figure 3.6 Display of Passenger Ride Quality-the Jerkometer...69
Figure 3.7 Box-Scatter Plot For Graphical Data Presentation ... 71
Figure 3.8 Times of Reaction to Signal Events ... 73
Figure 3.9 Sample Response to Signal Event With the Basic Display (Subject 4)...75
Figure 3.10 Sample Response to Signal Event With the Predictor Display (Subject 11) ... 76
Figure 3.11 Energy Consumption in Routine Speed Control. ... 79
Figure 3.12 The Optimal Control And a Typical Response By a Subject With the Basic Display ... 81
Figure 3.13 Station-Stopping Accuracy ... ... 82
Figure 3.14 Schedule Deviation ... 85
Figure 3.15 Comparison of Performance Between Runs of Routine Speed Control And Runs of Speed Control with Secondary Task... 89
Figure 3.16 Tracking Errors of the Secondary Task by Subject 11. ...90
Figure 3.17 Workload: (a) Time Pressure, (b) Mental Effort, and (c) Stress ...93
Figure 3.18 Comparison of Workload Between Runs of Routine Speed Control And Runs of Speed Control With the Secondary Task ...95
Figure 3.19
Figure 3.20 Figure 4.1 Figure 4.2
Comparison of Workload between Runs of Routine Speed Control
And Runs With Emergency Signal Event ... 97 Ratings on Overall W orkload...98 Integration of Two Control Strategies in the Driver Model ... 105 Responses to Dynamic Signal Event By Model With the Basic
LIST OF TABLES
Table 2.1 Table 3.1 Table 3.2 Table 3.3 Table 3.4 Table 3.5 Table 3.6 Table 3.7Signal Aspects and Signal Speeds ... 27
Sequences of Tests and Temporary Freezes ... 51
Sequences of Tests ... 64
Outcomes of Eventful Runs (Ratio to Total Events, by Display) ... 77
Average Speed at Pertinent Moments (km/h) ... 78
Ride Quality in Total Number of Jerks by All Subjects (by Display)...86
Rank Order of Maximum Tracking Errors (by Display and Subject) ... 87
Comparison of Tracking Errors Between Enroute and Approaching Station (by D isplay) ... 88
Relative Tracking Error (by Display and Subject)...88
Mean Ratings on Workload ... 92
p-Values* by Paired t-Tests Comparing Runs of Routine Speed Control to Runs with Secondary Task (By Display)...94
p-Values* by Paired t-Tests Comparing Runs of Routine Speed Control to Runs with Emergency Signal Event (By Display)...96
Rankings for the Three Displays ... 99 Table Table Table 3.8 3.9 3.10 Table 3.11 Table 3.12
GLOSSARYt
Alert system-An onboard safety system, also called a "deadman system", that generates a
warning at random periods to call for the driver's attention. Once the warning is active, a mechanism should be touched or pressed by the driver to acknowledge and silence it. The purpose of such an alert system is to monitor whether the driver is alive and mobile during the operation of the train. In this research, a keyboard key is pressed to acknowledge the alert system.
ATP-Automatic Train Protection. In general rail terminology, it is the portion of an
automatic train control system that ensures safe train movement by a combination of train detection, train separation, overspeed protection, and route interlocking. In the context of this report, it specifically refers to the portion of its function that prevents movement at speeds in excess of allowed limits.
Automatic interlocking-An interlocking controlled by circuit logic so that changes or
movements of signals, signal appliances, and track switches follow each other in proper sequence without need for manual control, thus permitting train
movements along routes only if safe conditions exist.
Block-A length of track of defined limits, the use of which by trains and engines is
governed by block signals, cab signals, or both.
Block signal-A fixed signal at the entrance of a block to govern movement of trains
entering and using that block. This signal conveys automatic block aspects (color combinations of signal lights) to train operators, thereby indicating allowed
speeds.
Cab--The section of the power car of a trainset where the driver works.
Cab signal-A signal located in the engine control compartment or cab indicating a
condition affecting the movement of train or engine and used both in connection with interlocking signals and in connection with or in lieu of block signals.
Civil speed-The maximum speed allowed in a specified section of track or guideway as
determined by physical limitations of the track or guideway structure, train design, and passenger comfort.
Dispatcher-The person who monitors and controls the routing (meets, passes, and so on)
of trains.
Dynamic braking-A method of braking in which the motor is used as a generator and the
kinetic energy of the apparatus is employed as the actuating means of exerting a retarding force.
Emergency-A condition which could cause bodily harm or severe physical injury to
persons, or serious damage to equipment, or both.
Emergency braking-Irrevocable open-loop braking to a complete stop, at the maximum
safe braking rate for the system (typically a higher rate than that obtained with a service brake application).
Emergency braking distance-The distance on any portion of any railroad which any train
operating on such portion of railroad at its current speed will travel during an application of the emergency brakes. It is measured from the point where emergency braking is initiated to the point where the train comes to a stop.
Emergency stop-The stopping of a train by an emergency brake application which, after
initiated, cannot be released until the train has stopped.
External environment-Anything external to a given trainset (e.g., wayside signal, object
on track, heavy wind, and so on).
Failure-The inability of a system or component to perform its required functions within
specified performance requirements.
Full-service braking-The maximum amount of non-emergency braking that can be applied
to the train.
Full-service braking distance- The distance on any portion of any railroad which any train
operating on such portion of railroad at its current speed will travel during a service application of the brakes. It is the distance from the point where full-service braking is initiated to the point where the train comes to a stop.
Grade crossing -A combination of two or more highways, railroad tracks, pedestrian
walkways, or other fixed guideways intersecting at the same level.
Guideway-The surface or track, and the supporting structure, in or on which vehicles
travel and which provides lateral control.
Headway-The time separation between two trains traveling in the same direction on the
same track, measured from the instant the head end of the leading train passes a given reference point until the head end of the train immediately following passes the same reference point.
High-speed-Velocity of at least 198 km/h (125 mph).
High-speed rail-A rail transportation system which operates at speeds in excess of 198
km/h (125 mph).
Interlocking-An arrangement of signals and signal appliances so interconnected that their
movements must succeed each other in proper sequence and for which interlocking rules are in effect. It may be operated manually or automatically. KP-Kilometer post. The counter of distance from the origin station in kilometers.
Maglev-Magnetic levitation. Levitation of vehicles by magnetic force either by magnetic
attraction or repulsion. The term is usually used to describe a guided transportation system using magnetic levitation and guidance.
Overspeed-In excess of maximum allowable safe command speed.
Pantograph-A current-collecting apparatus having a long contact shoe which glides
perpendicular to the underside of an overhead contact wire of the power car.
Regenerative braking-A form of dynamic braking in which the kinetic energy of the motor
and driven machinery is returned to the power-supply system.
Service braking-Any non-emergency brake application of the braking system. Speed profile-A plot of speed against distance traveled.
Switch-A pair of switch points with their fastenings and operating rods which provides
the means for changing a route from one track to another.
I hear and Iforget. I see and I remember. I do and I understand.
CHAPTER ONE
INTRODUCTION
1.1 ISSUES
High speed rail technology offers great promise for future intercity passenger
transportation. The advantages of high-speed rail systems have been demonstrated in European countries and in Japan with their successful operation for almost two decades.
1. Energy consumption per passenger-kilometer in high-speed rail is more economical than that of other forms of transportation, both road and air. While accounting for 23% of goods traffic and 9% of passenger traffic within the European Community, high-speed rail only consumes 3% of energy expended in the field of
transportation. In comparison with automobiles, high-speed trains consume half as much energy per passenger-kilometer at twice the speed. Similarly, in comparison with modem aircraft, high-speed trains consume half of the energy over similar distances (and with comparable occupation rates) [International Union of Railways
1992].
2. From an environmental standpoint, high-speed trains occupy small landtake: on average, they use between a third and a half the space required by an expressway; a two-track railway has a capacity similar to that of a six-lane highway. In addition, high-speed trains do not generate major noise disturbance, especially if the noise exposure time is taken into account.
1. Introduction
3. From the perspective of operational efficiency and social cost, high-speed rail reduces time overhead associated with travel. Time spent traveling to and from airports, which are usually located far from city centers, can be saved by the use of high-speed trains-since train stations can be located more centrally in the cities. The desire for faster means of transportation, advanced technology, and the success of existing high-speed rail systems have propelled train speeds to a high level--currently in the range of 200 to 320 km/h (124 to 199 mph); and the speeds continue to increase. Several countries have already experimented with Maglev systems with potential speeds far greater than conventional wheel-on-rail systems (up to 500 km/h, or 311 mph).
As train speeds increase, prevention of accidents gains emphasis. Higher speed means greater kinetic energy in any collision and therefore exacerbates the severity of an accident. As pointed out by a study on collision avoidance and accident survivability [DOT/FRA 1993], "...collision at high speed, over 200 km/h (125 mph), would result in severe damage to several vehicles or vehicle sections, and multiple fatalities. These results suggest that it is not possible to ensure survivability in high speed collision with any reasonable vehicle design philosophy, and the safety emphasis in High-Speed Guided Ground Transportation (HSGGT) systems must be on the avoidance of such accidents." One of the many issues to be addressed to ensure complete prevention of accidents is the human factors associated with the driver's functions within high-speed trains. Assuming a human driver is responsible for the control of the train, design of the driver-cab interface and signaling systems should deal with the following effects of high speed on human performance:
1. High speed reduces the allowable time for the driver to respond to unexpected events and, therefore, poses greater demands on the driver to anticipate or to be aware of potential dangers and be able to make quick and appropriate control decisions.
2. High speed makes it more difficult for the train driver to see any wayside signals or other objects at the wayside with other visibility factors being the same. In fact, one high-speed train operator, the French Socidtd Nationale des Chemins de Fer Franfais (SNCF), has determined that the maximum speed for accurate driver perception of wayside signals is 220 km/h (137 mph) [DOT/FRA 1991].
1. Introduction
These problems, along with minimum stopping distances of 4 to 5 kilometers (2.5 to 3.1 miles) for operation at 300 km/h (186 mph) [DOT/FRA 1991], dictates the necessity of a driver-cab system design that fully considers the impacts of human factors.
One seemingly apparent solution is to design a fully-automated system--completely replacing the human functions by automation. Although full automation of high-speed trains can be realized given the modem technology of measurement, control and computers, the human driver is still necessary in operating a high-speed train for the following reasons:
1. To handle the unexpected. It is still neither economically nor technically possible for a computer to control a train for all conditions, including unexpected events. The human is still the ultimate source capable of the reasoning and creativity necessary for handling situations that are difficult or impossible to anticipate. 2. To take over control in case of automation failure. When confronted with
predictable and repetitive situations, any human operator, no matter how
responsible, will be more fallible than an automated system. However, automation may fail; when it does, it is the human's responsibility to take over control.
3. Public anxiety. The general public is still hesitant to board a train that would run as fast as 300 km/h with no human driver. No doubt, there would be great public anxiety with driverless control in full-size high-speed trains. Driverless systems do exist, however, in the form of small-scale trains that operate within airports (e.g., Dallas -Fort Worth) or from airport to city center (e.g., the French VAL),
indicating that reflex anxiety about driverless trains may be waning.
4. Liability in case of an accident. The threat of litigation, in case of any accident in an automated system, gives developers pause.
5. Political factors. Generally associated with the legal issues and public resistance, political decisions in a democratic society usually reflect the public opinions. Therefore, human operators remain in the cab of current high-speed trains. However, keeping the human as part of the high-speed train control system requires thorough investigation of possible means for aiding the human driver (and allocating functions between human and machines) to achieve the desired safety and operational efficiency.
1. Introduction
1.2 OBJECTIVES
Two major approaches can be identified in redesigning the functions of the human driver. More automation is one option. The human operator then becomes a supervisor of the automatic system by monitoring the automation for failures and fault diagnosis. An alternative to this machine-in-charge approach is to compensate for the sensory, perceptual and cognitive limitations of the human operator with various aids, while keeping the human in control.
Both of the above approaches have potential problems. Concerns associated with increasing automation include possible loss of manual skill and possible loss of situation awareness [Endsley and Kiris 1994]. In highly automated systems, operators are likely to be out-of-the-loop and handicapped in their ability to take over manual control when automation fails or in the event of an incident. In contrast, the problem with increasing sensory, memory, and decision aids is that at some point operators may be overloaded and "killed with kindness." They would not be able to allocate their attention appropriately among all the information sources and the task at hand. As a result, their performance in signal detection and decision making deteriorates.
The objective of this research was to develop computer-based decision aids for control of high-speed trains where the human driver is in charge, and to investigate the impacts of these aids on safety and operational efficiency. In particular, this research sought to design and evaluate decision aids for drivers in order to compensate for human limitations in signal detection and information processing that are hard-pressed by high-speed locomotion. Under this objective, three concepts of preview, predictive, and advisory aiding-were proposed and realized experimentally as cab displays with increasing levels of aiding. It had been proposed to explore the effects of these displays on driver-train system
performance. In particular, the research tried to answer questions of what information should be presented and what aids should be provided to the driver in view of human limitations in performing the task of high-speed train operation. In addition, issues of how the aiding information should be organized and presented to the operator as an effective decision support were addressed via integrated cab displays whereby the aids were implemented.
1. Introduction
1.3 BACKGROUND
1.3.1
Design of Decision Aids for Drivers of High-Speed Trains
A prerequisite for achieving higher speeds in rail systems has been significant changes in signaling equipment. As such, aiding for high-speed train operators has focused on novel forms of cab signaling. In current high-speed train systems, the design of signal systems and human-machine allocation differ significantly with respect to the degree of automation implemented in these systems. Operation of the German Inter-City Express (ICE), for example, is considerably more automated than operation of the French Train & Grand
Vitesse (TGV). It is, in fact, appropriate to say that an ICE driver is more a supervisor of automation than a direct manual controller. In contrast, manual control is the prevailing operation mode on the TGV with computer monitoring and assistance [DOT/FRA 1991].
Both systems rely on some data transmission techniques to transmit information necessary for speed control from the wayside to the cab. Information transmitted to the ICE (once every second, for automated control) includes distance to next stop, braking curvet , the traveling direction, target speed in 5 km/h (3.1 mph) increments, target distance, line gradient, and civil speed restrictions. All the above information is used for automatic control under normal situations. In case of automation failure, the human would take over control [Sheridan et al. 1993].
In comparison, information on the TGV Atlantique is not as rich as that on the ICE. The signaling system on a TGV Atlantique provides to the cab the maximum speeds in the current and next blocks (block length is about 2 km), absolute stopping points, and power cable pantograph up or down commands.
1.3.2 Evaluation of Decision Aids Via Experiments
One approach to evaluating decision aids is by use of human-in-the-loop experiments, which are generally complex and difficult to design and control. One of the difficulties is the large number of parameters involved. A second difficulty is in determining which parameters should be held fixed, which ones should be varied, and over what range. A
1. Introduction
third problem is that the participation of human decision makers in the experiment precludes the execution of a large number of trials. It is clear that an evaluation study is a large and very time-consuming activity.
Few papers in the related literature can be found on designing or evaluating decision aids for high-speed train drivers. Kuehn [1992] reports a human-in-the-loop experiment evaluating effects of an Advanced Train Control System (ATCS) display on train handling and compliance with operating rules by the locomotive engineers. He compared three means of information presentation to the driver: (1) an ATCS display that constitutes a speed prediction (for one point in the future) given current control settings and the effects of grade, (2) an alternative display that does not contain prediction of speed but shows feedback on the track crossings, braking systems, and other in-train force management indications, and (3) conventional track warrants with a printed track profile. Results show that, with ATCS, subjects were less likely to exceed speed limits because of two distinctive features of the display: (a) the speed prediction and (b) an impending penalty brake
associated with the predicted speed. Haga [1991] provides practical suggestions on what to display in the cab for a moving block signaling system using satellite communication, which allows much closer distances between trains without compromising on safety. He proposed a display layout but no literature has been found on its experimental evaluation.
1.3.3 Evaluation of Decision Aids Via Model Simulation
An alternative method to human-in-the-loop experiments in evaluating decision aids is computer simulation using mathematical models of human decision making. The main advantages of simulation study of decision aids with human models are as follows: (1) They provide a precise and quantitative formulation of task aspects such as goals, system dynamics, and basic concepts of human functions. Therefore, models potentially have predictive capability, rendering a basis for selecting design alternatives. (2) Models provide a flexible tool to systematically analyze effects of aiding on system performance. (3) They allow prediction of system performance under various information displays to be achieved in shorter time and at lower cost. As such, models may be used to provide early and preliminary evaluation of competing configurations without the necessity for expensive human-in-the-loop experiments. (4) In later stages of display development, models can serve as powerful diagnostic and extrapolative adjuncts to the necessary human-in-the-loop experiments.
1. Introduction
While machine system dynamics are generally easy to obtain, creating a simulated human model that can perform the control tasks has been a challenge in the human-machine-systems research domain.
There have been numerous engineering models of the human operator. Of particular relevance are those of systems where the human is in control. Early models of the human operator in manual control tasks took the form of a servomechanism in a compensatory system. In such models, the human operator has a signal input-the difference between actual system response and the reference input. A successful model of this type in the frequency domain is the simple crossover model [McRuer et al. 1965]. These models have been used in a variety of engineering and research applications including the design of controls and displays [Sheridan and Ferrell 1974].
Few real-world situations involve just the simple manual tracking tasks with compensatory displays where the operator is assumed to observe only an error variable. In fact, the operator may be presented with both input and output variables separately and
independently, which is the so-called pursuit display. Although models of pursuit-tracking have not enjoyed as much success as those of compensatory tracking, experiments have shown repeatedly that pursuit tracking is easier to learn and generally results in smaller error than compensatory tracking [Sheridan and Ferrell 1974].
More characteristic of every day tasks than pursuit or compensatory control is preview control where the human operator has available a true display of the reference input from the present time until some time into the future. Preview tracking has been modeled by dynamic programming [Sheridan 1966] and by optimal control techniques [Miller 1967, Tomizuka 1973].
A systematic and extensive effort in the optimal control-theoretic approach of modeling the human operator can be found in a series of studies conducted by Baron and his colleagues
[Baron and Kleinman 1969], and has been applied to manned-vehicle systems [Elkind et al. 1968, Kleinman et al. 1971]. The basic optimal control structure has been extended to multivariable systems with monitoring and decision-making tasks [Baron 1976; Kleinman and Curry 1977; Wewerinke 1981], and to systems of multitasks of different objectives or supervisory systems [Muralidharan and Baron 1980, Baron et al 1980]. It has also been applied to ship handling [Wewerinke and Tak 1988], to navigation [Papenhuijzen 1988; Sutton and Towill 1988; Salski et al. 1988; Papenhuijzen and Stassen 1992], to car driving [Levison 1993], to manned robotic systems [Wewerinke 1991], and to display studies in
1. Introduction
aviation [Baron and Levison 1975 and 1977, Hess 1977, Johannsen and Govindaraj 1980]. Models in these studies all bear an implied assumption: that the human's control behavior is compensatory, i.e., that control decisions are made based on instantaneous error instead of a preview of future inputs which is a critical behavior of a vehicle driver
(see Section 2.2 for detailed discussion). A model of a train driver is not yet available or known to the author.
1.4 APPROACH
As mentioned earlier, this research proposed three types of aiding--preview, predictive, and advisory aiding-for control of a high-speed train under the assumption of complete manual control. The aiding was based on a system analysis of an operator's driving behavior under high-speed locomotion, and on understanding effects of these aids on driver performance in view of the human's limited capabilities.
To evaluate the effectiveness of these aids, the three types of aiding were implemented as cab displays with aiding levels graded from low to high. A no-aiding display, referred to
as the basic display, showing the standard cab signals and environment interface indicators inside a cab, was also implemented. With the basic display as a baseline for comparative evaluation, each of the proposed displays included the indications of the previous level of display. In particular, the display of the first aiding level, referred to as the preview display, shows not only the indications provided in the basic display, but also previews of civil speed limits, signal aspects, track geometry, and so on for up to 20 km ahead. The display of the second aiding level, referred to as the predictor display, shows three predicted speed profiles overlaid on top of the preview display. Similarly, the display of the third aiding level, referred to as the advisor display, shows a minimum-energy speed profilet of the present trip overlaid on top of the predictor display.
Such an inclusive design and implementation of the displays allows the investigator (1) to address the concern that drivers may be overloaded with increased aiding, (2) to isolate effects of each type of aiding and thereby provide insight on the use of these aids, and (3) to demonstrate how the proposed aids could be presented and implemented.
t Minimum under the constraints of schedule, speed limits, passenger ride quality, and the locomotive's braking and traction capability.
1. Introduction
Formal human-in-the-loop experiments were conducted to investigate effects of these aids on driver-train system performance. Since preview is the backbone of the predictive and advisory aiding, a preliminary human-in-the-loop experiment was first performed to validate the preview aiding. This experiment aimed to compare the effects of the preview and the basic displays. It was expected that the preview display would improve situation awareness and reduce workload. In addition, measures of operation efficiency, such as schedule adherence, station-stopping accuracy, and energy consumption were expected to improve with the preview display.
The main experiment was conducted to fully investigate effects of the predictive and advisory aiding on system performance. In particular, this experiment compared effects of the basic, the predictor, and the advisor displays on performance. It (1) addressed the issue of potential overloading or "killing with kindness" due to more information being provided to the driver than can be assimilated, (2) investigated effects of predictive aiding
on decision making, (3) evaluated effects of advisory aiding on energy consumption, and (4) assessed effects of the aids on situation awareness and measures of operation efficiency such as station-stopping accuracy, schedule adherence, and passenger ride quality.
In terms of experimental facilities, a flexible driver-train simulation system was developed for this research. A "virtual" driver-cab environment was created using
computer-generated display of the track scene ahead. The "train" had the true dynamics of a
passenger train and a control mechanism for traction and braking. A summary description of the experimental simulator facility is provided in Appendix A. The advantages of such an experimental simulator are twofold: (1) relatively low development cost and even lower cost of maintaining or "remodeling" such systems, and (2) the flexibility for configuring
various designs of driver-cab interface for experimental investigation.
The experiments were conducted with university students as test subjects. "Naive" subjects have the advantage of having equal exposure to all experimental conditions, whereas expert subjects might be most comfortable in the condition that most closely resembles their daily experience.
The proposed aids were further investigated with a model-in-the-loop simulation. A normative rule-based driver model was developed and applied to demonstrate effects of the proposed aids on safety and operational efficiency.
1. Introduction
1.5 THESIS OVERVIEW
This report documents the design of the decision aids and experiments done to evaluate their effects on driver performance in control of high-speed trains. Chapter 2 discusses the underlying considerations in proposing the preview, predictive, and advisory aiding, and presents the corresponding cab environment displays that realized these aids. Chapter 3 first summarizes the results of a preliminary investigation of the preview aiding, then reports and discusses in detail the experimental evaluation of the preview, predictive and advisory aiding in the form of the predictor and advisor displays. The simulation with a driver model, the alternative method of evaluation of the aids, is presented in Chapter 4. The conclusions in Chapter 5 summarize the major results and contributions of this work, discuss implications of these studies for driver-cab interface design of high-speed trains, and provide directions for future research.
CHAPTER TWO
DESIGN OF DECISION AIDS
2.1 OVERVIEW
This chapter starts with a background description of the functionality of rail signals which helps in understanding the rationale underlying the design of the decision aids. Then the chapter proceeds with an analysis of an important driving behavior, which leads to the
development of a paradigm of high-speed train speed control. The paradigm classifies the information necessary for safe speed control into two categories: (1) the preview
information that the driver needs to form a desired target speed, and (2) the feedback information that provides instantaneous error between the desired target speed and the current speed. Effects of high-speed locomotion on human preview capability are then
discussed. Implications of these effects and requirements on designing decision aids in cab-driver interface are presented.
A conventional practice of cab signaling and information presented to a driver of a high-speed train is implemented as the basic display. Three types of aiding are proposed based on the analyses of the driver's task and behavior in driving a high-speed train. Three corresponding displays are then implemented for experimental evaluation.
2. Design of Decision Aids
2.2 RAIL SIGNALS
This section provides preliminary background on the functionality of rail signals, which is important for understanding the rationale behind the design of the aids. The explanation is based on a 6-block 7-aspect signaling system that is currently implemented in the
high-speed rail system simulator (Appendix A) and was used in the experiments. It should be noted that real implementations of rail signals vary from system to system, though the fundamental functionality of signals in a block signaling system is similar.
Figure 2.1 illustrates the 6-block 7-aspect block signaling system. The 7 aspects (or color combinations) are GGG, GYG, YGY, YYY, YRY, RYR, and RRR (G-green, Y-yellow, or R-red), progressing from "no restriction" (train may go as high as the civil
speed limit allows) to "stop" (must stop before this set of lights). Associated with each signal aspect is a signal level or signal speed. The signal speeds used in this research are listed in Table 2.1.
Table 2.1 Sional Asnects and Sional Sneeds
* G-Green, Y-Yellow, R-Red.
Rail signals may be readily explained with an analogy to familiar highway signals. A car's motion on a highway is governed by speed limits and traffic lights. The speed limits (indicated by signs posted on the side of the road) are static, while the traffic lights change dynamically to prevent collision with crossing traffic. Similarly, a train's motion on a rail track is governed by civil (nominal) speed limits and rail signals. The civil speed limits are determined by physical limitations of the track, train design and passenger ride quality, and
2. Design of Decision Aids
are static, while rail signals may change dynamically to prevent collision with a train, an obstruction, or maintenance crews on the same track.
The prevention of a collision is achieved by dividing the track into blocks with each having a signal either fixed at the entrance of the block or displayed inside the cab. The use of a block by trains is governed by the signal aspect (color combination) of the block. Rail
signal aspects, like traffic lights on a highway, serve to prevent collisions. On a highway, the temporal sequence of Green-Yellow-Red of a highway traffic light tells a car driver to prepare to stop when seeing a yellow light ahead because the next level of signal (after a few seconds) will be Red (meaning "stop"). The progression of the color code from Green to Yellow to Red conveys progressively more restriction to the car driver. Unlike highway signal aspects, rail signals are in spatial sequence for a given time (as oppose to temporal sequence for a given location of a highway traffic light). The sequence of rail signal aspects, GGG-GYG-YGY-YYY-YRY-RYR-RRR, becomes progressively more restrictive as the train proceeds towards an occupied block (Figure 2.1). The obstruction occupying a block automatically sets the signals behind it in a sequence (via a circuit logic built into the track) that prevents the following train from entering the occupied block
(which has signal aspect RRR).
The meaning of a signal aspect to the driver is twofold. First, the signal may affect the effective speed limit of the block. Effective speed limit is the minimum of the civil speed limit of the block and the signal speed associated with the signal aspect of the block. Therefore, the meaning of a signal is dependent on the particular block the train is in. For example, if the signal is YYY (associated signal speed is 220 km/h) and the nominal speed of the block is 250 km/h (or any speed above 220 km/h), the effective speed limit for the block should be 220 km/h. The signal acts to restrict the civil speed limit which is higher than the signal speed. The driver, upon perceiving such a signal, should start braking in order to bring the train's speed to the next lower signal level when reaching the end of the block (or at the entrance to the next block). If, on the other hand, the civil speed limit is 200 km/h and the signal is YYY, the effective speed limit is then 200 km/h. In this case, the signal speed is higher than the civil speed limit and therefore has no restrictive effect on the speed limit of the current block.
Second, from a signal aspect, the driver can infer the approximate distance to the upcoming occupied block. That is, when a non-GGG aspect is seen, an RRR aspect must be some blocks ahead. The number of blocks depends on the non-GGG aspect seen. For example,
2. Design of Decision Aids
RRR signal aspect is 3 blocks ahead. Therefore, even when a signal has no restrictive effect on speed limit for a particular block, it still tells a driver how far an occupied block is
ahead of him or her. Much like the traffic light on a highway, when a Yellow light is seen, one would expect the next level of light must be Red after a few seconds. The signaling system is designed or wired this way.
8 7 6 5 4 3 2 1 0
B A
6 blocks
Boom
Figure 2.1 The 6-Block 7-Aspect Block Signal System. Top: Signal aspects displayed to protect this piece of road (of identical 2-km blocks). Bottom: Illustration of corresponding signal speeds following an occupied block. Assume that train A has stopped in block 1 (the number above the signal lights corresponds to the number of the block to the right), and a following train B is approaching signal 7. Signal 7 is GGG ("proceed"); therefore, train B will continue at its normal speed (assuming the civil
speed limits for the shown blocks are 300 km/h) until it approaches signal 6, which will be GYG. Then the driver of train B will start braking in order to bring down the speed to 270 km/h at the end of block 6 or the entrance to block 5. Assume that the signals are spaced just braking distance apart, then train B should continue braking after crossing signal 5 in order to bring down the speed to the next signal level (YYY, 220 km/h) at the end of block 5 or the entrance to block 4. This process of braking continues until the train stops inside block 2-before running into the red light at the end of block 2.
2. Design of Decision Aids
2.3 A SYSTEM ANALYSIS OF DRIVING BEHAVIOR
2.3.1
Characteristics of Train Driving
A train's speed on a block signaling system is governed by stepwise speed limits and signals along a line, and can be manipulated by a controller via application of braking or propulsive force (also called traction force or tractive effort). From the outset of railway operations, observation of the speed limits and signals at all times is essential because of the potential risks involved: collisions between trains (rear-end or head-on), derailing at switches or curves due to excessive speed, or striking road vehicles at highway crossings. Therefore, the critical and primary task in the operation of a train is speed control under the constraints of speed limits and signals. This implies that if the train is approaching a speed reduction point, its speed should be controlled to below the new speed limit before, not after, the point of speed reduction.
Such a requirement in train speed control suggests that the control behavior of a train controller (be it human or machine) is fundamentally different from that of a conventional (proportional-integral-differential or PID, or optimal control) automatic controller. A conventional controller which operates on instantaneous error between current input (speed limit) and actual measured output (speed) has no way of taking into account actual values of its immediate future input, such as the next speed limit along the route for a train. Such a controller would not be able to operate the train without speed infraction.
Indeed, for high-speed train control, not only is the instantaneous speed error necessary, but also future inputs (i.e., upcoming speed limits, signals, or disturbances) are crucial for decision on current control. For a human driver, anticipation of these future inputs
demands his/her looking ahead for potential signs that may affect a current control maneuver. The demand on the controller to anticipate future inputs and make a proper current control decision is exacerbated by the large inertia of the train and the high speed at which the train operates. The heavier the vehicle, the longer the time constants; the faster the vehicle, the longer the stopping distance of the vehicle, and the farther ahead the driver must look in order to achieve smooth and safe speed control [Sheridan 1966].
2. Design of Decision Aids
2.3.2
A Paradigm of Train Speed Control
Under human control, a train can be regarded as a semi-automatic system, where the driver functions as a controller between the input of the train and its output: he or she adjusts the level of control force in order to achieve the desired speed. Functionally, the human-machine relationship can be represented by the information flow diagram shown in Figure 2.2. Two major sources of input to the human are identified and depicted in this figure: the external information and the servo feedback information. Assuming a conventional line, the information content and corresponding functional significance are described below.
External Information. External information, or information from out-the-window view, refers to the items of relevant information, such as signs, signals, obstacles, and so on, that are to be detected, perceived or interpreted correctly and in a timely manner in order to form a target speed. Unlike an ordinary servomechanism, where system control com-pensates for instantaneous error by operating upon present or past values of error or both, the control of a train depends importantly, though not exclusively, on preview of what is ahead. This is because moving vehicles (including trains, cars, and planes) are target-oriented and consequently their output (i.e., the motion variables) should be adjusted in relation to a target output. The target output is formulated by observing the nature of the path ahead (signs, signals, speed limits, and so forth). This driving behavior holds mainly for vehicles in surface traffic and for airplanes during take-off and landing [Mashour 1974].
Figure 2.2 Paradigm of Information Flow in Driver-Train Systems.
X-position of train. V-speed of train. F-propulsive or braking force.
2. Design of Decision Aids
The meaning of "target" in the context of train driving may be explained as follows. On an open line, the speed limits and signals are basic commands that governs the train's output variable, the speed. The driver is expected to control the train such that before, rather than after, entering the next block, its speed should be under the speed limit of the new block. Therefore, the driver needs to know the distance to the point of and the amount of speed reduction in order to initiate braking in time to comply with the upcoming speed reduction. Getting such information requires the driver to look ahead-to preview, i.e., to
continuously scan the field of view in search of future inputs in order to make current control decision. The future inputs, be they signals, speed limits, or dangerous situations, are transformed by the driver into a corresponding short-term or current desired speed-the target speed. During the course of driving, the driver, based on previewed information that is continuously changing due to the motion of the train, decides on a succession of target speeds. The target speed of the moment is the reference input for guiding the current application of control force.
In summary, the target speed has two important features.
1. It is not explicitly displayed to the driver. Instead, it is interpreted or inferred by the driver from the external information observed through actively looking ahead or scanning the field of view.
2. It has to be continuously updated because of (a) the appearance of new information (e.g., signs or signals) in the field of view as a result of the train's motion, and (b) the possible sudden appearance of dangerous situations.
Feedback Information. If the target speed is the short-term desired output, the control to achieve the target speed needs feedback about the current train speed. This information is usually provided inside the cab by a speedometer, which is the most significant feedback indicator for controlling the speed of the train. Another indicator related to speed control decision making is the traction or braking level currently applied to the system.
It should be pointed out that, besides the two sources of input to the train driver depicted in Figure 2.2, there are other sources of feedback on speed control. For example, the
interactions that are associated with the speed might be used as cues in the adjustment of speed. Such information may be noise, vibration, or equilibratory factors that can be felt via tactile or kinesthetic channels.
2. Design of Decision Aids
2.4 EFFECTS OF HIGH-SPEED LOCOMOTION
Effects of "high speeds" on the human driver fall into two interacting categories: those on information processing of the visual system and those on decision making.
Effects of high-speed locomotion on the information processing of human visual system are twofold. First, the capability of the human visual system for detection deteriorates as speed increases. Research findings and laboratory and field experiments [Mashour 1974] have shown that human limitations on detection and attention are not particularly critical in a natural environment when the motion is sufficiently slow for a more effective search by scanning the field of view. It is when the human is required to perform search tasks while under high-speed locomotion that his or her limitation in detection and attention can not always cope with the demands of the task and may even jeopardize safety. As such, driver identification of wayside signaling systems increases in difficulty as speed increases. In practice, a speed of 220 km/h is regarded as the maximum threshold for correct
interpretation of a signal in poor weather conditions (for regular size of signals); with falling snow, the threshold is naturally lower [DOT/FRA 1991]. Second, as speed increases, other things being equal, the driver is exposed to increasing sensory load. The driver must scan the track and its vicinity more intensively to detect unexpected dangerous situations and signals. Under this condition, the probability of missing a signal increases.
Effects of "high speeds" on driver's decision making include those subjecting the driver to more demanding tasks, reduced allowable reaction time and increased memory load. First, because of the exacerbated severity of an accident at higher speed, drivers are expected to be absolutely attentive, vigilant, and make proper control decisions in case of dangerous
situations. As a result, the demand on the driver for information processing increases per unit time as the train speed increases. Second, higher speed reduces the allowable response time for unexpected dangerous situations, such as sudden detection of an obstacle.
Consequently, higher speed poses greater demands on the driver to anticipate or to be aware of the potential dangers and be able to make quick and appropriate control decisions. Third, high-speed locomotion increases the demand on the driver's memory. Train opera-tion relies on a continuous retrieval of informaopera-tion of track characteristics, landmarks, Daily Operating Bulletin (which indicates temporary speed restrictions and the working area of track maintenance crews, among other things), operation rules, and so on. Such a
2. Design of Decision Aids
2.5 IMPLICATIONS FOR DESIGN OF DECISION AIDS
The limitations of human information processing and effects of high-speed locomotion on the driver's visual functions suggest the following design requirements for signaling systems and decision aids:
1. At high speeds, traffic safety must no longer rely on correct interpretation of wayside signals by the driver. (In fact, a train running at a speed higher than 79 mph is required to have in-cab signals by the Federal Railroad Administration in the United States.)
2. To compensate for human deficiency in detection, signal displays should possess sufficient effect of sensory stimulation to attract the driver's attention.
3. Control decision aiding should address the issue of workload and help the driver make proper control decisions under both normal and emergency conditions.
2.6 CAB SIGNALS AND THE BASIC DISPLAY
The above considerations of decision aid design for high-speed train drivers has led to the replacement of wayside signals by cab signals in current practice. That is, the signal governing the current block of track is displayed inside the cab with the color aspects as used on the wayside, together with the display of the allowable (civil) speed of the block and a speedometer. With the cab signals, should a restriction change, the driver is immediately shown the new level of speed command from inside the cab, instead of searching for the signals at block boundaries (where external signals are traditionally located in the wayside signaling system).
A driver-cab interface including such cab signals was used in this research as a baseline for comparative study of the proposed aids. An implementation of such an interface, together with other onboard indicators necessary for speed control, is shown in Figure 2.3. This simulated cab environment, referred to as the basic display for convenience, contains the usual cab signals and indicators as described below.
2. Design of Decision Aids 0 0 UI U U a, 0 ci so Pr. 4.0 '4 3
2. Design of Decision Aids
The speedometer, located in the center region of the screen, integrates current speed, speed limit of the current block, and speed limit of the next block. The rectangular shape of the
speedometer was chosen specifically to provide a "common look" among the displays under comparative study. In fact, the rectangular shape of the speedometer was a natural fit with the proposed aids discussed in Sections 2.7-2.9.
To the upper right of the speedometer is the cab signal consisting of three colored lights. Each of the lights may be G-green, Y-yellow, or R--red at certain times depending on the track condition ahead (e.g., being occupied at some distance away). The function of the signal aspects and their meaning to the driver has been described in Section 2.2.
The control interface between the driver (subject) and the train simulator was provided via a dual-use throttle that was programmed to be capable of applying both braking and traction, with each function allocated one half of the throttle throw. The throttle has a center notch to provide tactile feedback on its functional position (braking vs. traction).
The indicator corresponding to the dual-use throttle is a horizontal grid bar located under the frame of the central region in Figure 2.3. The center grid of this indicator corresponds to the center notch position of the throttle. Functionally, this position of the throttle is neutral; i.e., no braking or traction is applied. To the left of the center grid, braking is displayed; to the right, traction level. The throttle is capable of continuous force application (as compared to notched levels) and its indicator is displayed accordingly. The grid lines on the force indicator are provided as measures of force level at every 10% of the maximum braking or traction.
Functions related to speed control are provided on the right side of the screen of the cab display simulation computer. Two functions are shown in Figure 2.3: the automatic train protection (ATP) system and the emergency stop (although other functions such as cruise control, automatic control, and programmed station-stopping are available in the simulator). The emergency stop can be activated manually either via a press on the keyboard (F12 key) or via a mouse-click on the emergency-stop indicator. The ATP system warns the driver (by blinking its triangular indicator) when the speed of the train is above the speed limit. It automatically activates the emergency stop when (1) the train is more than 15 km/h above the speed limit, or (2) the speed of the train is in the warning zone (within the 15 km/h overspeed tolerance) for more than 20 seconds. Emergency braking, whether activated manually or automatically, cannot be reset until the train has stopped.
2. Design of Decision Aids
To the lower left of the speedometer (outside the central region) is the door status indicator. The door is opened or closed by a click on the door display to toggle the door open (red) or
close (gray) when the train is not moving. Conversely, the train cannot move unless the
door has been closed.
The alert-system status display, located just under the door indicator, generates a blinking-yellow warning. The warning is activated by the alert system with a random period ranging from 40 to 80 seconds. Once the warning is active, the alert system expects an acknowl-edgement or response from the operator. The response could be either a press on the keyboard (Esc) or a throttle maneuver. If no response is received by the alert system in 10 seconds after the initiation of the warning, the alert status display changes to blinking red accompanied by beeps. If no response is received in another 10 seconds, emergency braking is automatically activated. Again, emergency braking cannot be reset until the train has come to a complete stop.
A call-up schedule display is provided at the lower left of the workstation screen. The schedule, which can be shown or hidden by a mouse-click on the schedule button, consists of arrival, departure, and station-stopping times for each station and the distances between stations on the journey.
On the right of the call-up schedule display are the incoming and outgoing message areas. The in-coming messages from the dispatcher at the Central Traffic Control are displayed in the CTC MSG: area, with the most recent message at the bottom of the area. (Other mes-sages are scrolled upward). The driver can type a message at the MSG: area and send it to the dispatcher with a mouse-click on the send button (at the far right of the MSG: area).
Other on-board subsystems are displayed on the right side of the workstation screen. Displays for subsystems, such as a side task or ride quality, can be rapidly prototyped using these display areas. The train dynamics are based on the longitudinal point-mass equations of motion (Appendix B). The train data used in the simulation is for a TGV Atlantique trainset [DOT/FRA 1991].
The limitations of the basic display can be readily observed in view of the effects of high speed on human performance discussed in Section 2.4. The cab signals are limited in their capability to satisfy the demand to preview farther when the speed gets higher because the previewed information in this display, i.e., the speed limit of the next block and signal of the current block, only provides a preview of no farther than the block length (usually 2 km). This limitation becomes most severe for highly dense traffic where shorter headway