HAL Id: hal-00552745
https://hal.archives-ouvertes.fr/hal-00552745
Submitted on 6 Jan 2011HAL is a multi-disciplinary open access archive for the deposit and dissemination of sci-entific research documents, whether they are pub-lished or not. The documents may come from teaching and research institutions in France or abroad, or from public or private research centers.
L’archive ouverte pluridisciplinaire HAL, est destinée au dépôt et à la diffusion de documents scientifiques de niveau recherche, publiés ou non, émanant des établissements d’enseignement et de recherche français ou étrangers, des laboratoires publics ou privés.
Samar Hatem, Nadine Attal, Denis Ducreux, Michele Gautron, Fabrice
Parker, Leon Plaghki, Didier Bouhassira
To cite this version:
Samar Hatem, Nadine Attal, Denis Ducreux, Michele Gautron, Fabrice Parker, et al.. Assessment of spinal somatosensory systems with diffusion tensor imaging in syringomyelia: spinal diffusion tensor imaging in syringomyelia. Journal of Neurology, Neurosurgery and Psychiatry, BMJ Publishing Group, 2009, 80 (12), pp.1350. �10.1136/jnnp.2008.167858�. �hal-00552745�
Assessment of spinal somatosensory systems with
diffusion tensor imaging in syringomyelia
SM Hatem, N Attal, D Ducreux, M Gautron, F Parker, L Plaghki, D Bouhassira
Authors’ affiliations:
Samar M. Hatem MD : INSERM – U792, CHU Ambroise Paré, APHP,
Boulogne-Billancourt F-92100, France and Unité de Réadaptation et de Médecine physique (READ 5375), Université catholique de Louvain, Brussels B-1200, Belgium.
Nadine AttalMD, PhD : INSERM – U792, CHU Ambroise Paré, APHP,
Boulogne-Billancourt F-92100, France.
Denis Ducreux MD, PhD : Department of Neuroradiology, CHU Bicêtre, APHP, Le
Kremlin-Bicêtre F-94270, France.
Michèle Gautron : INSERM – U792, CHU Ambroise Paré, APHP,
Boulogne-Billancourt F-92100, France.
Fabrice Parker MD, PhD: Department of Neurosurgery, CHU Bicêtre, APHP, Le
Kremlin-Bicêtre F-94270, France.
Léon Plaghki MD, PhD : Unité de Réadaptation et de Médecine physique (READ
5375), Université catholique de Louvain, Brussels B-1200, Belgium.
Didier Bouhassira MD, PhD : INSERM – U792, CHU Ambroise Paré, APHP,
Boulogne-Billancourt F-92100, France and Versailles-Saint-Quentin University, Versailles F-78035, France.
Running title: spinal diffusion tensor imaging in syringomyelia
Keywords: diffusion tensor imaging, spinal cord, somatosensory, syringomyelia, laser evoked potential.
Word count: Abstract 250
Manuscript 3444
Corresponding author: Didier BOUHASSIRA INSERM U-792
Centre d'Evaluation et de Traitement de la Douleur
Hôpital Ambroise Paré
9 avenue Charles de Gaulle
92100 Boulogne-Billancourt - France
tel: + 33 1 49 09 45 56 fax: + 33 1 49 09 44 35 didier.bouhassira@apr.aphp.fr
ABSTRACT
Objective: We tested the use of diffusion tensor imaging with three-dimensional fiber
tracking (DTI-FT) for the assessment of spinal sensory tract lesions. We systematically examined the relationships between tract lesions quantified with DTI-FT, and somatosensory dysfunction assessed with quantitative sensory testing (QST) and laser evoked potentials (LEP), in patients with syringomyelia.
Methods: We studied 28 patients with cervical syringomyelia and thermosensory
impairment of the hands, and 19 healthy volunteers. We performed a DTI-FT of the spinal cord focusing on the upper segment (C3-C4) of the syrinx. Three-dimensional DTI-FT parameters (fractional anisotropy (FA) and apparent diffusion coefficient (ADC)) of the full, anterior and posterior spinal cord were individually compared to QST (thermal detection thresholds) and LEP (amplitude, latency and spinothalamic tract (STT) conduction time) of the hands.
Results: Patients had a significantly lower FA, but not ADC, than healthy subjects.
Mean FA of the full section of the spinal cord was correlated both to sensory deficits (i.e. increase of warm (rho = -0.63, p <0.010) and cold thresholds (rho = -0.72; p <0.001 of the hands) and to changes in LEP parameters, in particular STT conduction time (rho = -0.75; p <0.010). Correlations between FA and the clinical and electrophysiological measures were higher in the anterior area (where the spinothalamic tracts are located) than in the posterior area of the spinal cord.
Conclusions: These data indicate that diffusion tensor imaging with 3D-fiber tracking
is a new imaging method suitable for the objective and quantitative anatomical assessment of spinal somatosensory system dysfunction.
INTRODUCTION
Diffusion tensor imaging (DTI) is a technique that uses MRI to evaluate the movement of extracellular water molecules within the white matter fibers.1 2 Using specialized fiber-tracking (FT) algorithms, the technique enables the reconstruction of three-dimensional images of white matter tracts in the brain 3 4 and spinal cord 5. Its use in exploring brain injury and connectivity is now widespread, but its use in exploring the spinal cord remains technically challenging due to the small volume of the spinal cord and the presence of motion artifacts.6 7 Nevertheless, when these technical barriers are overcome, DTI-FT can be used successfully to investigate various pathological states of the human spinal cord,8 9 including tumors,10 inflammatory lesions,11 spinal cord compression12 and degenerative myelopathy.13 Recent studies have shown that DTI markers provide an accurate estimate of the extent of cervical cord damage in demyelinating 14 15 and degenerative conditions16 and correlate well with the level of motor disability. To date, however, no study has specifically addressed the relationship between structural damage of the spinal cord as assessed by three-dimensional DTI-FT and somatosensory deficits.
Syringomyelia is a disease of the spinal cord characterised by an intra-spinal cavity that affects the spinothalamic tracts (STT) predominantly, or even selectively. A major clinical finding in patients with this disease is a deficit of heat and/or cold sensation.17 Thus, syringomyelia is a unique 'pathological model' particularly well suited to investigate the relationship between structural, clinical and functional alterations of the spinothalamic tracts.
The aim of this study was to evaluate the ability of DTI-FT to assess spinal somatosensory tract lesions in vivo. We specifically examined the relationship
between lesions of fiber tracts in the cervical spinal cord in patients with syringomyelia, quantified with DTI-FT, and somatosensory dysfunction of the upper limbs assessed both clinically (using quantitative sensory testing, QST) and electrophysiologically (using laser-evoked brain potentials, LEPs) 18.
METHODS
Subjects
From December 2005 to September 2007, we prospectively included patients from the departments of neurosurgery and orthopedics (Kremlin-Bicêtre University Hospital, France and Cliniques Universitaires St-Luc, Brussels, Belgium) with a clinical history and symptoms of sensory impairment related to cervical syringomyelia, confirmed by spinal MRI and stable for at least two years. Exclusion
criteria were history of major psychiatric disease, presence of concomitant neurological conditions and difficulty in understanding the testing procedure.
We also recruited a group of healthy volunteers, age- and sex-matched, having no history or symptoms of neurological disorders, or abnormalities of the cervical spinal cord on MR images. The study was approved by the local ethics committees (Faculty of Medicine, Université catholique de Louvain, Belgium and CHU Ambroise Paré, Boulogne-Billancourt, France). All patients and volunteers gave informed written consent.
All subjects underwent quantitative sensory testing (QST), recording of laser evoked potentials (LEPs) and spinal cord MRI-DTI within 15 days of inclusion.
Clinical sensory evaluation
All patients had a complete neurological examination including QST, which was performed by a single experienced investigator as described previously.19 Measures were obtained, in randomized order, from three sites: the volar surface of both hands and the left side of the face. Warm and cold detection thresholds were assessed with a contact thermode (Somedic AB, Hornby, Sweden), using the Marstock method.20 Thresholds were calculated as the means of three successive measurements. To prevent tissue damage, the maximum temperature was set to 50°C, while the minimum temperature was set to 10°C. An index of thermal deficit (in °C) was obtained for each subject by calculating the difference between the thermal threshold at the hands and at the face (which served as a control value).
Patients were classified in three categories of sensory deficit (mild, moderate or severe) based on the cold and warm thermal thresholds.19 For this classification, thresholds were expressed as z-scores based on the mean and standard deviation of the control group. Patients were considered to have mild deficits if at least three z-scores were smaller than five, a moderate deficit if at least three z-z-scores were between 5 and 15, and a severe deficit if at least three z-scores were greater than 15. Criteria for severe deficits corresponded to thermal anesthesia.
Nociceptive somatosensory laser-evoked brain potentials (LEPs)
Nociceptive laser-evoked potentials were recorded by an experienced investigator unaware of the clinical status of patients. Event-related brain potentials were elicited by stimuli applied to the same three sites used for QST (i.e. both hands
and the left side of the face). The cutaneous heat stimulus was delivered by a CO2
laser, designed and built in the Department of Physics at the Université catholique de Louvain.21 Stimulus duration was 50 ms and beam diameter at target was 10 mm. 22 Power output was determined such that energy density was clearly supraliminal for Aδ-nociceptor activation (9.4 ± 2.5 mJ/mm2).23 For each subject, the same energy density was used at the three stimulation sites. EEG was recorded from 19 Ag-AgCl electrodes evenly placed on the scalp according to the International 10-20 system as previously described.22 Signals were amplified and digitized (gain: 1000; filter: 0.06 – 75 Hz, sampling rate: 167 cps) using a PL-EEG recorder (Walter Graphtek, Germany). Offline signal-processing steps were performed using BrainVision Analyzer® (Brain Products GmbH, Germany). Epochs extending from 0.5 s before to 2.5 s after stimulus onset (512 bins) and were band-pass filtered (0.2 – 25 Hz). Epochs contaminated by EOG were rejected by visual inspection and baseline-corrected (reference interval –0.5 to 0 s). Average waveforms were computed for each subject and stimulation site.
Three distinct components (N180, N240 and P350) were characterized for each subject, and within each LEP waveform.22 Latencies (in ms) were measured from stimulus onset to peak. LEP amplitude was measured from the N240 peak to the P350 peak. Relative LEP amplitudes were defined as the difference between the LEP amplitude of the hand and that of the face, which served as a control value for each subject. The estimated conduction time (CT) of Aδ spinothalamic pathways along the cervical spinal cord was estimated by calculating the difference between the latency of the N180 following left/right hand stimulation and the latency of the N180 following face stimulation.24
Magnetic Resonance Imaging – Diffusion Tensor Imaging – Fiber Tracking
MR imaging technique
Imaging was performed on a 1.5-T MR Sonata imaging system (Siemens, Erlangen, Germany) with activelyshielded magnetic field gradients (G maximum, 40 mT/m). Theprotocol included a T2-weighted coronalscout view followed by a sagittal T2-weighted fast spin echo (FSE) sequence (field of view, 39.9 x 39.9 cm; image matrix,512 x 512; slice thickness, 4 mm; TR/TE, 4800/114 ms). Asagittal spin-echo single-shot echo-planar parallel Grappa DTI sequence with acceleration factor 2 and 25 non-collinear and non-coplanar gradient directions was then applied with two b values (b = 0 and900 seconds/mm2; field of view, 17.9 x 17.9 cm; image matrix,128 x 128; 12 sections with slices thickness = 3 mm, nominalvoxel size, 1.4 x 1.4 x 3 mm; TR/TE, 2100/97 ms). Subjects were instructed to avoid moving the head or limbs or swallowing during the examination. The duration of the DTI scan was 4 minutes 37 seconds.
Image analysis
All MRI post-processing was performed by two experienced observers unaware of QST and LEP results. Image analysis was performed on a voxel-by-voxel basis using dedicated software (DPTools [http://www.fmritools.org), as described previously.25
ADC (apparent diffusion coefficient) maps depict Brownian motion, the process of random molecular diffusion in water. The ADC maps show increased signal where there is relatively unrestricted movement of water molecules along the direction of diffusion encoding and decreased signal where there is relatively restricted motion of water molecules.26 In organized biological structures, such as
white matter tracts, diffusion properties are said to be anisotropic. FA (fractional anisotropy) values around 1 are fully anisotropic; FA values around 0 are fully isotropic.
Fiber Tracking
Three-dimensional maps of fiber tracts, based on similarities between neighboring voxels in the shape (quantitative diffusion anisotropy measures) and orientation (principal eigenvector map) of the diffusion ellipsoid, were created and coregistered 27 28 as described previously.12 The MedINRIA program (http://www-sop.inria.fr/asclepios/software/MedINRIA/) was used for fiber tracking with a FA threshold of 0.2.
Measurements
ADC and FA measurements were made for all subjects at two levels: C3–C4 and C7. The C3-C4 level was situated in the upper segment of the syrinx and C6-C7 was closer to the middle of the syrinx. For each spinal cord level, five volumes of interest (VOI) were defined, with a height of one vertebra: full spinal section, right hemicord, left hemicord, anterior hemicord and posterior hemicord. Laterolateral and anteroposterior midlines of the cervical spinal cord were determined on the b0 image and then transferred to the ADC and FA maps. ADC and FA of the selected fiber bundle volume were determined on the three-dimensional image. For FA, we measured both maximal FA (FAmax) reflecting the maximal anisotropy of fiber tracts located inside the VOI 12 and mean FA (FAmean) reflecting the mean anisotropy of fiber tracts located inside the VOI. 29 30 For ADC, we measured the mean ADC reflecting the global diffusivity of 3D-fiber tracts. We took particular care to avoid CSF partial volume effects, magnetic susceptibility effects, and motion artifacts in VOI
selection. Such artifacts prevented the correct assessment of DTI-FT metrics in six patients and three controls, which were excluded from the statistical analysis. In two other patients, only the C6-C7 level could be analyzed because of artifacts at the C3-C4 level. The final DTI-FT data analysis thus included 16 controls and 20 patients for the C3-C4 level and 22 patients for the C6-C7 level.
Statistical Analyses
Analysis of variance (ANOVA) was used for inter-group comparisons of psychophysical (warm and cold thresholds), electrophysiological (N240-P350 amplitude, latencies of N180, N240 and P350 components and STT conduction time) and DTI-FT parameters (FA and ADC), between patients and controls and between patients with mild, moderate or severe deficits (with post-hoc Bonferroni correction).
Bivariate correlations were assessed using the Spearman's rank correlation coefficient in the patient group. We examined correlations between the DTI-FT metrics (FA and ADC values in the different VOIs) and the thermal thresholds and electrophysiological parameters measured in the same patients.
We calculated the odds as relative probabilities of having a thermal sensory deficit against not having a thermosensory deficit, for patients with DTI-FT metrics within (or below) the 95%-confidence interval of normal values.
Results were expressed as means ± 1 SD. In all cases, p < 0.05 was considered as significant.
RESULTS
Description of patients
Thirty-seven syringomyelia patients that met the inclusion criteria were examined at the outpatient clinics. Nine of those patients were discarded from the study because they refused the DTI-FT acquisition. Thus, twenty-eight syringomyelia patients (46 ± 14 yrs; 18 women) and 19 healthy volunteers (46 ± 15 yrs; 12 women) participated in the study. The syrinx was associated with a type I Chiari malformation in 25 patients, and was primary in three patients. Most syringes were cervicothoracic and extended over 15 ± 6 myelomeres. All patients had thermal (warm and/or cold) deficits of the hands, which were asymmetrical in 14 patients, consistent with the paramedian extension of the syrinx on MRI. Eleven patients had thermal anesthesia, eleven patients had moderate and six had mild thermal deficits.
Comparison of clinical, electrophysiological and DTI - FT results between patients and healthy volunteers.
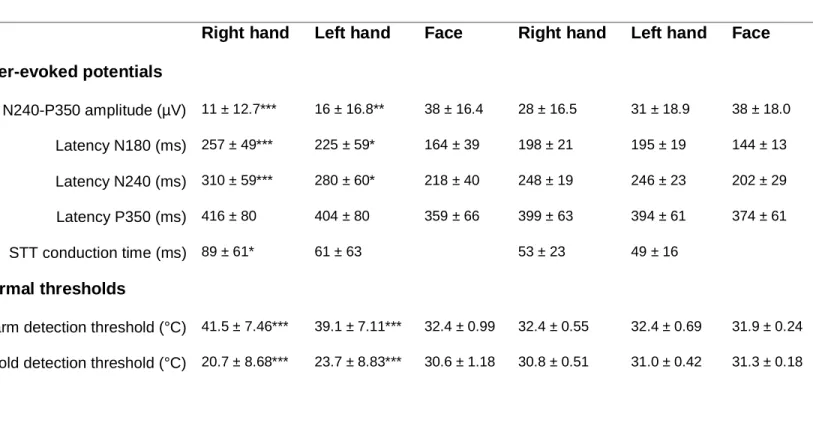
Significant differences were observed between patients and controls for the warm and cold detection thresholds (Table 1). LEP amplitude (N240-P350) was significantly lower in patients than in controls. The latencies of the N180 and N240 components of the hand LEPs and estimated CTs were significantly longer in patients than in controls (Table 1).
Table 1 LEP variables and thermal thresholds (in absolute values) of the 28 patients
and 19 controls enrolled in the study. Values are mean ± SD. Comparison (ANOVA) patients vs. controls: * p < 0.050, ** p < 0.010, *** p < 0.001.
Patients Controls
Right hand Left hand Face Right hand Left hand Face Laser-evoked potentials N240-P350 amplitude (µV) 11 ± 12.7*** 16 ± 16.8** 38 ± 16.4 28 ± 16.5 31 ± 18.9 38 ± 18.0 Latency N180 (ms) 257 ± 49*** 225 ± 59* 164 ± 39 198 ± 21 195 ± 19 144 ± 13 Latency N240 (ms) 310 ± 59*** 280 ± 60* 218 ± 40 248 ± 19 246 ± 23 202 ± 29 Latency P350 (ms) 416 ± 80 404 ± 80 359 ± 66 399 ± 63 394 ± 61 374 ± 61 STT conduction time (ms) 89 ± 61* 61 ± 63 53 ± 23 49 ± 16 Thermal thresholds
Warm detection threshold (°C) 41.5 ± 7.46*** 39.1 ± 7.11*** 32.4 ± 0.99 32.4 ± 0.55 32.4 ± 0.69 31.9 ± 0.24 Cold detection threshold (°C) 20.7 ± 8.68*** 23.7 ± 8.83*** 30.6 ± 1.18 30.8 ± 0.51 31.0 ± 0.42 31.3 ± 0.18
The FA and ADC values of the cervical spinal cord of patients and controls are presented in Table 2. FAmean and FAmax were significantly lower in patients than in controls for nearly all VOIs, both at C3-C4 and C6-C7 levels. In contrast, there were no differences in ADC between patients and controls. The three-dimensional fiber-tracking reconstruction allowed clear visualization of the extent of spinal cord damage in patients (Fig 1).
Table 2 Fractional anisotropy (FAmean and FAmax) and apparent diffusion
coefficient (ADC) values of the cervical spinal cord in patients and controls, at C3-C4 and C6-C7 levels. Values are mean ± SD. Comparison (ANOVA) patients vs. controls: * p < 0.050, ** p < 0.010, *** p < 0.001.
Patients Controls
FAmean FAmax ADCmean
(mm²/s)
FAmean FAmax ADCmean (mm²/s) C3-C4 Full section 0.39 ± 0.046*** 0.85 ± 0.146 0.90 ± 0.231 0.45 ± 0.018 0.90 ± 0.052 0.96 ± 0.083 Right hemicord 0.38 ± 0.050** 0.78 ± 0.162* 1.00 ± 0.393 0.43 ± 0.023 0.89 ± 0.068 0.96 ± 0.083 Left hemicord 0.40 ± 0.056*** 0.81 ± 0.165* 0.93 ± 0.246 0.47 ± 0.018 0.90 ± 0.055 0.94 ± 0.076 Anterior hemicord 0.37 ± 0.069** 0.73 ± 0.225** 0.93 ± 0.296 0.44 ± 0.017 0.90 ± 0.055 0.98 ± 0.099 Posterior hemicord 0.39 ± 0.057*** 0.79 ± 0.169* 0.93 ± 0.203 0.46 ± 0.023 0.90 ± 0.054 0.93 ± 0.085 C6-C7 Full section 0.38 ± 0.054*** 0.77 ± 0.146* 0.95 ± 0.245 0.44 ± 0.023 0.87 ± 0.055 0.94 ± 0.063 Right hemicord 0.34 ± 0.059*** 0.69 ± 0.204* 1.03 ± 0.244 0.42 ± 0.023 0.82 ± 0.074 0.97 ± 0.065 Left hemicord 0.37 ± 0.051*** 0.74 ± 0.165** 0.99 ± 0.234 0.46 ± 0.019 0.87 ± 0.054 0.93 ± 0.057 Anterior hemicord 0.36 ± 0.064*** 0.68 ± 0.212** 0.98 ± 0.251 0.45 ± 0.021 0.85 ± 0.058 0.94 ± 0.057 Posterior hemicord 0.36 ± 0.053*** 0.72 ± 0.178** 0.98 ± 0.283 0.43 ± 0.023 0.85 ± 0.065 0.96 ± 0.071
Relationship between clinical assessment and DTI - FT results
Based on the thermal thresholds of healthy volunteers, patients were categorized as having mild, moderate or severe thermal deficits of the hands. FAmean (F = 8.76, p = 0.002) and FAmax (F = 4.17, p = 0.030), but not ADC (F = 3.42, p = 0.060), of the full spinal cord at C3-C4 differed significantly between these three groups of patients (Fig 2). A similar result was found at C6-C7 (FAmean: F = 6.78, p = 0.006; FAmax: F = 2.09, p = 0.151; ADC: F = 1.13, p = 0.344). The paired comparison of hemicord DTI - FT measurements in patients with asymmetrical sensory deficits showed that FA, but not FAmax or ADC, was significantly lower in the hemicord ipsilateral to the maximal sensory deficit than in the contralateral hemicord both at C3-C4 (p = 0.010) and C6-C7 ( p = 0.001).
The relationship between DTI - FT and psychophysical measurements was further confirmed by the individual correlation within each patient between the FAmean of the full spinal cord section at C3-C4 and the mean increase in warm (rho = -0.63, p<0.010) and cold (rho = -0.72, p< 0.001) thresholds of the hands (Fig 3). A similar strong correlation was observed between FAmean of the anterior hemicord and warm (rho = -0.62; p<0.010) and cold (rho = -0.67; p<0.010) thresholds. Only moderate correlations were observed between increases in ADC values of the spinal cord full section at C3-C4 and warm (rho = 0.47; p<0.050) and cold (rho = 0.47; p<0.050) thresholds. No significant relationship was observed between FAmax of the spinal cord full section at C3C4 and warm (rho = 0.42; p=0.070) and cold (rho = -0.43; p=0.060) thresholds, or between FAmax of the anterior hemicord at C3-C4 and warm (rho = -0.45; p=0.060) and cold (rho = -0.43; p=0.070) thresholds.
The odds in favor of a thermal sensory deficit (i.e. outside the 95%-confidence interval of normal hand thermal thresholds) was 12 for patients with an abnormal
FAmean value at C3-C4 (i.e. lower than the 95%-confidence interval of normal FAmean), whereas it was 0.75 for patients with a FAmean within the 95% confidence interval.
There was no correlation between FA or ADC measured at C6-C7 and thermal thresholds.
Relationship between electrophysiological assessment and DTI - FT
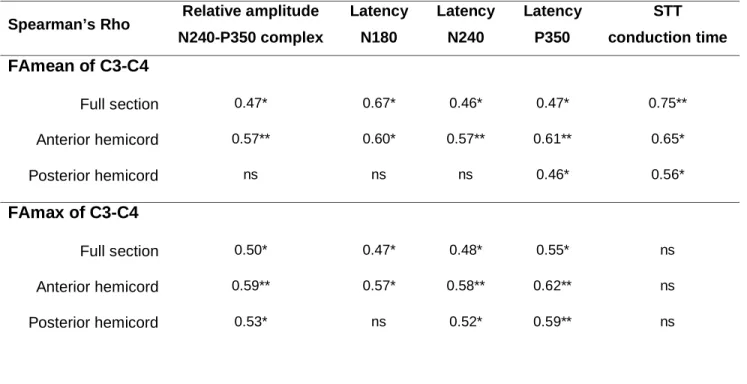
LEP amplitudes, latencies (N180, N240 and P350) and, in particular, CTs of spinothalamic pathways were correlated with the FAmean of the spinal cord full section at the C3-C4 level (Table 3). A similar relationship was observed between LEP parameters and the FAmean of the anterior hemicord, as well as the FAmax (except for STT CTs) (Table 3). There was no correlation between LEP and DTI-FT at C6-C7.
Table 3 Correlations (Spearman’s Rho) between LEP parameters and fractional
anisotropy (mean and maximal FA) measured at C3-C4 in syringomyelia patients: * p < 0.050 and ** p < 0.010.
Spearman’s Rho Relative amplitude N240-P350 complex Latency N180 Latency N240 Latency P350 STT conduction time FAmean of C3-C4 Full section 0.47* 0.67* 0.46* 0.47* 0.75** Anterior hemicord 0.57** 0.60* 0.57** 0.61** 0.65* Posterior hemicord ns ns ns 0.46* 0.56* FAmax of C3-C4 Full section 0.50* 0.47* 0.48* 0.55* ns Anterior hemicord 0.59** 0.57* 0.58** 0.62** ns Posterior hemicord 0.53* ns 0.52* 0.59** ns
DISCUSSION
We investigated the relationship between the assessment of spinal structural damage with three-dimensional DTI-FT and the sensory impairment evaluated by both psychophysical and electrophysiological tests in patients with cervical syringomyelia. We found a direct relationship between DTI-FT parameters, in particular the fractional anisotropy, and both clinical and electrophysiological assessments of the thermonociceptive function. Thus, this new imaging method may provide an objective and quantitative anatomical assessment of lesions of spino-thalamic tracts. We also showed that 3D-DTI-FT could clearly delineate and characterize the spinal lesion.
Methodological aspects
The DTI variable fractional anisotropy was more closely related to clinical and electrophysiological changes than the apparent diffusion coefficient, suggesting that FA is a better marker of spinal cord injury, at least for syringomyelia. Decreased FA values in patients probably reflected chronic disruption of the white matter tracts leading to spinal cord atrophy, considered to be a key factor for explaining neurological symptoms. 31 Although decreased FA may be related to specific histopathological changes, 12 caution must be taken when interpreting DTI metrics in terms of tissue pathology.32
A sagittal acquisition plane for 3D-DTI-FT was chosen in order to encompass the whole length of the syringeal cavity. In other pathologies an axial plane may be more effective, to avoid partial volume effects and to distinguish better between white (WM) and grey matter (GM). The difference between white and grey matter integrity was reflected by using different anisotropy variables, i.e. FAmax and FAmean. The
FAmax reflected the maximal anisotropy of the fiber tracts in the WM (with normal values around 0.70-0.90), while the FAmean (with normal values around 0.45) rendered the global anisotropy of the three-dimensionally reconstructed fiber tract and was thus more likely to reflect damage to both WM and GM.29 30 33. Importantly, FAmax values were better correlated to laser evoked potentials than to clinical deficits, suggesting that this DTI variable rather reflected the damage to the Aδ-fibers in WM tracts, whereas FAmean was more related to sensory deficits reflecting a more global structural damage.
Spinal cord DTI-FT variables should preferably be measured in the upper part of the syrinx (C3-C4), because correlations between DTI-FT and clinical and electrophysiological measurements proved only moderate at C6-C7. There are two possible explanations for this: it may be due to physiological variability of the cervical bulge and entrance of the brachial plexus; 34 alternatively the measurement of DTI-FT variables in the middle of the syrinx may be unreliable due to increased CSF flow.12
Clinical interest
The clinical relevance of DTI-FT was supported by the strong relationship between the increase in warm and cold thresholds of the hands (a hallmark of cervical syringomyelia) and spinal FA measured in each patient. The potential use of DTI-FT to assess the function of spinal somatosensory systems, in particular the spino-thalamic tracts (STT), was further supported by the direct relationship between FA and LEPs, which is regarded as the method of choice to evaluate STT function in humans.18 Both the amplitudes and latencies (N180, N240 and P350) of LEP components were correlated with FA of the full section of the spinal cord and with FA
of the anterior hemicord where the STT is located. Thus, DTI-FT metrics can also be performed in specific areas of the spinal cord to assess specific fiber tracts. Interestingly, the strongest correlation was between FAmean (full spinal section or anterior hemicord) and the reduction in STT conduction time, which might be the best electrophysiological indicator of the STT lesion and dysfunction.
Few studies have reported the relationship between syrinx characteristics and functional deficits.35 36 MRI 37 and other investigational methods such as cine MRI 35 and measurements of intramedullar fluid pressure 38 have shown that in most patients neurological symptoms correlate poorly with the pressure, diameter or length of the syringeal cavity. The three-dimensional reconstruction of fiber tracts allows distinguishing the areas of maximal damage better then MRI, because the conventional T2-weighted MRI only identifies morphological abnormalities of the spinal cord. DTI-FT in syringomyelia helps to detect changes of the tissue microstructure that are not visible on a conventional MRI image. Thus, DTI-FT may be a particularly useful additional tool to monitor spinothalamic tract damage in this disease. Given that the specific assessment of spinal white matter tracts is of interest in many other neurological conditions (e.g. traumatic spinal cord injury, multiple sclerosis), the potential clinical applications of this method may extend beyond syringomyelia.39
This study did not include a functional assessment of the motor system. Though motor impairment is usually mild to moderate in cervical syringomyelia,40 we cannot exclude that the variation in DTI metrics of the spinal cord was partly due to some degree of corticospinal tract damage. Future studies should determine whether DTI-FT allows the separate evaluation of sensory and motor tracts in the spinal cord.
COMPETING INTERESTS
The authors declare no conflict of interest related to this study.
FUNDING
This work was supported by INSERM (U-792). S. M. Hatem received a research fellow funding by the F.R.S. - FNRS (Belgium).
The Corresponding Author has the right to grant on behalf of all authors and does grant on behalf of all authors, an exclusive licence (or non exclusive for government employees) on a worldwide basis to the BMJ Publishing Group Ltd and its Licensees to permit this article (if accepted) to be published in the Journal of Neurology, Neurosurgery & Psychiatry editions and any other BMJPGL products to exploit all subsidiary rights, as set out in our licence (http://jnnp .bmjjournals.com/ifora/licence.pdf).
REFERENCES
1. LeBihan D. Molecular diffusion nuclear magnetic resonance imaging. Magn
Reson 1991;7:1–30.
2. Basser P, Pierpaoli C. Microstructural and physiological features of tissues elucidated by quantitative-diffusion-tensor MRI. J Magn Reson 1996;111:209– 219.
3. Conturo TE, Lori NF, Cull TS, Akbudak E, Snyder AZ, Shimony JS et al.Tracking neuronal fiber pathways in the living human brain. Proc Natl Acad
Sci U S A 1999;96(18):10422–10427.
4. Mori S, Crain BJ, Chacko VP, Van Zijl PCM. Three-dimensional tracking of axonal projections in the brain by magnetic resonance imaging. Ann Neurol 1999;45:265–269.
5. Wheeler-Kingshott CA, Hickman SJ, Parker GJ, Ciccarelli O, Symms MR, Miller DH et al. Investigating cervical spinal cord structure using axial diffusion tensor imaging. Neuroimage 2002;16(1):93–102.
6. Kharbanda HS, Alsop DC, Anderson AW, Filardo G, Hackney DB. Effects of cord motion on diffusion imaging of the spinal cord. Magn Reson Med 2006;56(2):334-339.
7. Summers P, Staempfli P, Jaermann T, Kwiecinski S, Kollias S. A preliminary study of the effects of trigger timing on diffusion tensor imaging of the human spinal cord. Am J Neuroradiol 2006;27(9):1952-1961.
8. Vargas MI, Delavelle J, Jlassi H, Rilliet B, Viallon M, Becker CD et al. Clinical applications of diffusion tensor tractography of the spinal cord. Neuroradiology 2007;50(1):25-29.
9. Maier SE. Examination of spinal cord tissue architecture with magnetic resonance diffusion tensor imaging. Neurotherapeutics 2007;4(3):453–459. 10. Ducreux D, Lepeintre JF, Fillard P, Loureiro C, Tadié M, Lasjaunias P. MR
diffusion tensor imaging and fiber tracking in 5 spinal cord astrocytomas. Am J
Neuroradiol 2006;27(1):214-216.
11. Renoux J, Facon D, Fillard P, Huynh I, Lasjaunias P, Ducreux D. MR diffusion tensor imaging and fiber tracking in inflammatory diseases of the spinal cord. Am J Neuroradiol 2006;27(9):1947-1951.
12. Facon D, Ozanne A, Fillard P, Lepeintre JF, Tournoux-Facon, C, Ducreux D. MR diffusion tensor imaging and fiber tracking in spinal cord compression. Am
J Neuroradiol 2005;26:1587–1594.
13. Hori M, Okubo T, Aoki S, Kumagai H, Araki T. Line scan diffusion tensor MRI at low magnetic field strength: feasibility study of cervical spondylotic myelopathy in an early clinical stage. J Magn Reson Imaging 2006 Feb;23(2):183-188.
14. Benedetti B, Valsasina P, Judica E, Martinelli V, Ghezzi A, Capra R et al. Grading cervical cord damage in neuromyelitis optica and MS by diffusion tensor MRI. Neurology 2006;67(1):161-163.
15. Agosta F, Absinta M, Sormani MP, Ghezzi A, Bertolotto A, Montanari E et al. In vivo assessment of cervical cord damage in MS patients: longitudinal diffusion tensor MRI study. Brain 2007;130:2211-2219.
16. Valsasina P, Agosta F, Benedetti B, Caputo D, Perini M, Salvi F, Prelle A, Filippi M. Diffusion anisotropy of the cervical cord is strictly associated with disability in amyotrophic lateral sclerosis. J Neurol Neurosurg Psychiatry 2007;78(5):480-484.
17. Klekamp J. The pathophysiology of syringomyelia – historical overview and current concept. Acta Neurochir (Wien) 2002;144(7):649-664.
18. Cruccu G, Anand P, Attal N, Garcia-Larrea L, Haanpää M, Jorum E et al. EFNS guidelines on neuropathic pain assessment. Eur J Neurol 2004;11:153-162.
19. Ducreux D, Attal N, Parker F, Bouhassira D. Mechanisms of central
neuropathic pain : a combined psychophysical and fMRI study in
syringomyelia. Brain 2006;129(Pt4):963-976.
20. Frühstorfer H, Lindblom U, Schmidt WG. Method for quantitative estimation of thermal thresholds in patients. J Neurol Neurosurg Psychiatry 1976;39:1071–1075.
21. Plaghki L, Delisle D, Godfraind JM. Heterotopic nociceptive conditioning stimuli and mental task modulate differently the perception and physiological correlates of short CO2 laser stimuli. Pain 1994;57(2):181–192.
22. Hatem SM, Plaghki L, Mouraux A. How response inhibition modulates nociceptive and non-nociceptive somatosensory brain-evoked potentials. Clin
Neurophysiol 2007;118(7):1503-1516.
23. Mouraux A, Plaghki L. Single-trial detection of human brain responses evoked by laser activation of Aδ-nociceptors using the wavelet transform of EEG epochs. Neurosci Lett 2004;361(1-3):241-244.
24. Kakigi R, Shibasaki H. Estimation of conduction velocity of the spino-thalamic tract in man. Electroencephalogr Clin Neurophysiol 1991;80(1):39-45.
25. Ducreux D, Nasser G, Lacroix C, Adams D, Lasjaunias P. MR diffusion tensor imaging, fiber tracking, and single-voxel spectroscopy findings in an unusual MELAS case. Am J Neuroradiol 2005;26(7):1840-1844.
26. Schwartz ED, Yezierski RP, Pattany PM, Quencer RM, Weaver RG. Diffusion-weighted MR imaging in a rat model of syringomyelia after excitotoxic spinal cord injury. Am J Neuroradiol.1999;20(8):1422-1428.
27. Ulug AM, van Zijl PC. Orientation-independent diffusion imaging without tensor diagonalization: anisotropy definition based on physical attributes of the diffusion ellipsoid. J Magn Reson Imaging 1999;9(6):804–813.
28. Woods RP, Grafton ST, Holmes CJ, Cherry SR, Mazziotta JC. Automated image registration: I. General methods and intrasubject, intramodality validation. J Comput Assist Tomogr 1998;22(1):139-152.
29. Van Hecke W, Leemans A, Sijbers J, Vandervliet E, Van Goethem J, Parizel PM. A tracking-based diffusion tensor imaging segmentation method for the detection of diffusion-related changes of the cervical spinal cord with aging. J
Magn Reson Imaging 2008;27:978-991.
30. Müller HP, Unrath A, Riecker A, Pinkhardt EH, Ludolph AC, Kassubek J. Intersubject variability in the analysis of diffusion tensor images at the group level: fractional anisotropy mapping and fiber tracking techniques. Magn
Reson Imaging 2009;27(3):324-34.
31. Milhorat TH, Capocelli AL Jr, Anzil AP, Kotzen RM, Milhorat RH. Pathological basis of spinal cord cavitation in syringomyelia: analysis of 105 autopsy cases.
J Neurosurg 1995;82(5):802-812.
32. Herrera JJ, Chacko T, Narayana PA. Histological correlation of diffusion tensor imaging metrics in experimental spinal cord injury. J Neurosci Res 2008;86(2):443-447.
33. Cohen-Adad J, Benali H, Hoge RD, Rossignol S. In vivo DTI of the healthy and injured cat spinal cord at high spatial and angular resolution. Neuroimage 2008;40(2):685-697.
34. Leinberry CF, Wehbé MA. Brachial plexus anatomy. Hand Clin 2004;
20(1):1–5.
35. Hort-Legrand C, Emery E. Evoked motor and sensory potentials in syringomyelia. Neurochirurgie 1999;45(Suppl 1):95-104.
36. Milhorat TH, Kotzen RM, Mu HT, Capocelli AL Jr, Milhorat RH. Dysesthetic pain in patients with syringomyelia. Neurosurgery 1996;38(5):940-946.
37. Grant R, Hadley DM, Macpherson P, Condon B, Patterson J, Bone I et al. Syringomyelia: cyst measurement by magnetic resonance imaging and comparison with symptoms, signs and disability. Neurol Neurosurg Psychiatry 1987;50(8):1008-1014.
38. Milhorat TH, Capocelli AL Jr, Kotzen RM, Bolognese P, Heger IM, Cottrell JE. Intramedullary pressure in syringomyelia: clinical and pathophysiological correlates of syrinx distension. Neurosurgery 1997;41(5):1102-1110.
39. Ge Y, Law M, Grossman RI. Applications of diffusion tensor MR imaging in multiple sclerosis. Ann N Y Acad Sci 2005;1064:202-219.
40. Mariani C, Cislaghi MG, Barbieri S, Filizzoli F, Di Palma F, Farina E, et al. The natural history and results of surgery in 50 cases of syringomyelia. J Neurol 1991;238(8):433-438.
FIGURE LEGENDS
Figure 1 Sagittal view of cervicothoracic syringomyelia in a 29-year old woman. She
presented with a thermonociceptive sensory deficit of the right C5-C8 dermatome which was maximal over the C8 radicular territory. On conventional T2-weighted MRI the syringeal cavity extended over seven myelomeres (A). Two-dimensional sagittal cartography of fractional anisotropy of the cervical spinal cord in the same patient (B). Three-dimensional DTI with fiber tracking clearly highlighted the area of maximal white matter damage from spinal level C7 to T2, consistent with the patient’s
symptoms (C).
Figure 2 Comparison of the mean fractional anisotropy (FAmean) of the cervical
spinal cord between patients with mild, moderate and severe thermal sensory impairments of the hands. FAmean, but not ADC, differed significantly between the three groups of patients at C3-C4 (F = 8.76, p = 0.002) as well as at C6-C7 level (F = 6.78, p = 0.006). At C3-C4, patients with severe thermal deficits had significantly lower FAmean than patients with mild or moderate sensory deficits. At C6-C7, patients with mild thermal deficits had significantly higher FAmean than patients with moderate or severe sensory deficits. ANOVA with post-hoc Bonferronni: * p < 0.050, ** p < 0.010, *** p < 0.001.
Figure 3 Thermal sensory deficit of the hands in syringomyelia patients, measured
by QST, was significantly correlated with the decrease of FAmean of the full spinal section at the C3-C4 level. Spearman’s rank correlation for warmth detection deficit: rho = -0.63, p < 0.010 and for cold detection deficit: rho = -0.72, p < 0.001.
1
F
A
me
an of ful
l
sp
in
al sectio
0.20 0.25 0.30 0.35 0.40 0.45 **F
A
me
an of ful
l
sp
in
al sectio
0.20 0.25 0.30 0.35 0.40 0.45 *severe
moderate
mild
-5 0 5 10 15 20 25 0.20 0.25 0.30 0.35 0.40 0.45 FA m e an of f u ll sp in al se ct io n -5 0 5 10 15 20 25 0.20 0.25 0.30 0.35 0.40 0.45 FA m e an of f u ll sp in al se ct io n