Quantifying irreversible movement in steep, fractured
bedrock permafrost on Matterhorn (CH)
Samuel Weber1, Jan Beutel2, Jérome Faillettaz1, Andreas Hasler3, Michael Krautblatter4, and Andreas Vieli1
1Department of Geography, University of Zurich, Zurich, Switzerland
2Computer Engineering and Networks Laboratory, ETH Zurich, Zurich, Switzerland 3Department of Geosciences, University of Fribourg, Fribourg, Switzerland
4Landslide Research, Technical University of Munich, Munich, Germany
Correspondence to:Samuel Weber ([email protected]) Received: 31 May 2016 – Discussion started: 15 June 2016
Revised: 9 January 2017 – Accepted: 30 January 2017 – Published: 16 February 2017
Abstract. Understanding rock slope kinematics in steep, fractured bedrock permafrost is a challenging task. Recent laboratory studies have provided enhanced understanding of rock fatigue and fracturing in cold environments but were not successfully confirmed by field studies. This study presents a unique time series of fracture kinematics, rock temperatures and environmental conditions at 3500 m a.s.l. on the steep, strongly fractured Hörnligrat of the Matterhorn (Swiss Alps). Thanks to 8 years of continuous data, the longer-term evo-lution of fracture kinematics in permafrost can be analyzed with an unprecedented level of detail. Evidence for common trends in spatiotemporal pattern of fracture kinematics could be found: a partly reversible seasonal movement can be ob-served at all locations, with variable amplitudes. In the wider context of rock slope stability assessment, we propose sepa-rating reversible (elastic) components of fracture kinematics, caused by thermoelastic strains, from the irreversible (plas-tic) component due to other processes. A regression anal-ysis between temperature and fracture displacement shows that all instrumented fractures exhibit reversible displace-ments that dominate fracture kinematics in winter. Further-more, removing this reversible component from the observed displacement enables us to quantify the irreversible compo-nent. From this, a new metric – termed index of irreversibil-ity – is proposed to quantify relative irreversibilirreversibil-ity of frac-ture kinematics. This new index can identify periods when fracture displacements are dominated by irreversible pro-cesses. For many sensors, irreversible enhanced fracture dis-placement is observed in summer and its initiation coincides
with the onset of positive rock temperatures. This likely in-dicates thawing-related processes, such as meltwater perco-lation into fractures, as a forcing mechanism for irreversible displacements. For a few instrumented fractures, irreversible displacements were found at the onset of the freezing period, suggesting that cryogenic processes act as a driving factor through increasing ice pressure. The proposed analysis vides a tool for investigating and better understanding pro-cesses related to irreversible kinematics.
1 Introduction
On steep, high-alpine mountain slopes, the behavior of frozen rock masses is an important control of slope stabil-ity when permafrost warms or thaws and seasonal frost oc-curs. During the summer heat wave of 2003, air temperatures across a large portion of Europe were 3◦C higher than the 1961–1990 average (Schär et al., 2004), causing deep thaw and coinciding with exceptional rockfall activity in the Euro-pean Alps (Gruber et al., 2004). In the last century, the upper tens of meters of Alpine permafrost in Europe have warmed by 0.5–0.8◦C (Harris et al., 2003). Assuming that warm-ing will continue or even accelerate, rock slope instabilities are expected to become increasingly important for scientists, engineers and inhabitants in the vicinity of high mountain permafrost regions (Gruber and Haeberli, 2007; Keuschnig et al., 2015). A coexistent growth of vulnerable socioeco-nomic activities in alpine areas potentially leads to rising risk
(Jomelli et al., 2007). In the USA and Europe, global gravity-driven slope instabilities cause damage in the range of bil-lions of euros each year (Sidle and Ochiai, 2006). Improved monitoring strategies and hazard assessment for the dynam-ics of frozen rock walls are therefore needed and require bet-ter understanding of the processes and factors controlling the stability of potentially hazardous slopes.
Terzaghi (1962) postulated that the stability of steep, un-weathered rock slopes is determined by the mechanical de-fects of the rock such as joints and faults and not by the strength of the rock itself. In cold regions, rock is exposed to frost cycles of variable length, leading to mechanical rock damage caused by different processes, such as thermal gra-dients (Hall et al., 2002) or cryostatic pressure (Walder and Hallet, 1985). Ice formation is therefore an important driver of rock fracturing and can be produced by ice expansion or ice segregation. These two processes have been widely dis-cussed, but it remains difficult to integrate this knowledge with field observations (Matsuoka and Murton, 2008). As-sessing and anticipating rock wall stability is a challeng-ing task, mainly because of the incomplete understandchalleng-ing of precursory signals and the inherent mechanical complex-ity of fractured inhomogeneous rock and ice masses (Aro-sio et al., 2009). Surface displacement measurements have been applied in several studies to survey fracture kinemat-ics in permafrost revealing a clear reversible component re-lated to thermal expansion (Wegmann and Gudmundsson, 1999; Matsuoka and Murton, 2008; Nordvik et al., 2010; Hasler et al., 2012; Blikra and Christiansen, 2014). Often, an additional irreversible displacement component is observed, which is relevant for the stability assessment of potentially hazardous slopes but has so far not been thoroughly quanti-fied in existing studies. In this study and based on a new 8-year continuous data set of fracture kinematics, we propose and apply a methodology for separating and quantifying such irreversible displacements.
1.1 Permafrost rock slope kinematics and environmental controls
Fracture displacements, reversible and irreversible, are con-trolled by a variety of processes and external environmen-tal forcing which are outlined in Fig. 1 and discussed in more detail in this section. The schematic in Fig. 1a com-bines the concept of destabilization by warming ice-filled rock joints developed by Gruber and Haeberli (2007), the rock–ice mechanical model by Krautblatter et al. (2013) and the permafrost-controlled rock slide model by Blikra and Christiansen (2014), in which topographically controlled thermally induced stresses, ice and water pressure act as driv-ing processes. The resistdriv-ing mechanisms are shear resistance and fracture infill. The shear resistance is given by cohesive rock bridges, ice deformation/fracture that reduces stresses through plastic work and cohesion/friction along fractures. All processes strongly depend on temporal fluctuating
envi-Figure 1. Schematic visualization of kinematics in steep, fractured bedrock permafrost shows the main acting mechanisms influenced by varying environmental forcing. (a) The gray area indicates per-mafrost, which is thermally defined as ground with a temperature below 0◦C for at least 2 consecutive years. The overlaying active layer is exposed to subannual freezing and thawing. (b) The indi-cated mechanisms can lead to fracture kinematics and each isolated mechanism causes specific movement patterns, illustrated with the schematic plots showing the relation between fracture kinematics and rock temperature.
ronmental forcing as well as the static geological or geotech-nical characteristics. Many of these processes interact and result in complex combinations of individual contributions. The observed fracture kinematics usually consists of a re-versible (elastic) and irrere-versible (plastic, creep and rupture) component. The corresponding specific relations between fracture kinematics and temperature are indicated in more detail below (see plots in Fig. 1b).
1.1.1 Thermally induced stress
Rock tends to expand on warming and to contract on cooling and results in a reversible displacement behavior. Assuming homogeneous thermal conditions, a change in length 1L of rock in all directions can be described by a linear function of temperature:
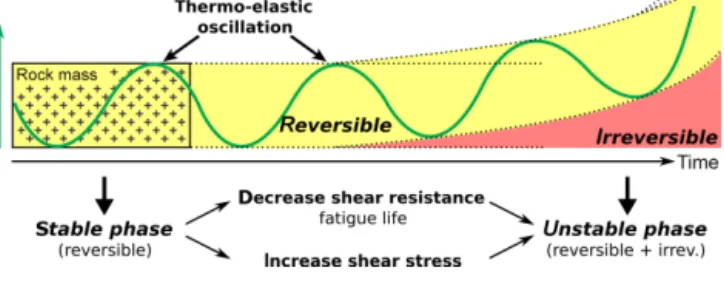
Figure 2. Evolution of a permafrost-affected rock mass with persis-tent thermoelastic oscillations: initially reversible displacement of rock mass can develop an additional irreversible component either by an increase in shear stress or by a decrease in shear resistance.
where L0is the initial length, α the material dependent linear
expansion coefficient and 1T the temperature change of the material. In laboratory experiments, Wolters (1969) showed a linear strain–temperature relation for different rocks (marly limestone, limestone, claystone, granite and basalt) between −20 and +80◦C. Short-lived thermoelastic strains accom-modate volume changes as displacements, typical for frac-tured bedrock in non-permafrost (Watson et al., 2004) as well as in permafrost areas (Hasler et al., 2012). This is therefore a reversible mechanism as it is driven by cycling temperature. Equation 1 is a highly simplified approximation and ignores (i) anisotropy and heterogeneity of the rock mass, (ii) com-plex 3-D temperature regimes, (iii) the unknown behavior of fractured bulk rock masses and (iv) a potential nonlinear ex-pansion coefficient of rocks containing ice-filled pores (Jia et al., 2015). However, several studies in permafrost bedrock with different measurement setups (e.g., Wegmann and Gud-mundsson, 1999; Matsuoka, 2001; Matsuoka and Murton, 2008; Nordvik et al., 2010) confirm a simple relation be-tween fracture kinematics and (rock) temperature at different time scales ranging from diurnal to annual. Further, Nord-vik et al. (2010) applied a multiple regression analysis with aggregated sinusoidal air temperature to model the seasonal fracture kinematics and proposed this approach for predic-tions of fracture kinematics in the context of early warning systems.
Thermally induced stress may cause rock fracture either by repetitive low-magnitude temperature cycles that lead to thermal stress fatigue or by a rapid temperature change (Murton, 2007). This might lead to irreversible displacement. 1.1.2 Cryogenic kinematics during freezing periods
and related kinematics during warming
Kinematics in partly frozen rock masses may also be caused by increasing ice pressure evolving in ice-filled fractures or pores by cryogenic processes. Volumetric expansion or ice segregation are the most common explanations here. Volu-metric expansion in laboratory experiments is only effective when freezing leads to sealing of rock fractures or porous
the volumetric expansion of freezing water (Jia et al., 2015). Ice segregation, which is most effective between −3 and −6◦C with sustained water supply (Hallet et al., 1991), de-scribes the freezing of the migrated water at the freezing site, which results in lenses or layers of segregated ice due to ice growth (Matsuoka and Murton, 2008). Ice formation induces pressure variations in rock pores and cracks at a level that is sufficient to crack intact high porosity rocks (Murton et al., 2006). Based on numerical simulations, ice segregation can even occur in low porosity rocks in an estimated tempera-ture range from −4 to −15◦C if liquid water is available (Walder and Hallet, 1985). In nature, conditions required for ice segregation are more commonly met than the conditions required for volumetric expansion. It has to be considered that ice pressure and its release by melting can also produce reversible fracture displacements.
While ice-filled joints can form relatively tough ice bod-ies at low temperatures, the shear resistance decreases with rising temperature and reaches a minimum just below the thawing point (Davies et al., 2001). Mellor (1973) showed a significant reduction in strength when intact water-saturated rock thaws. Periodic loading of discontinuities due to ther-momechanical effect acts as a mesoscale fatigue process. This can result in enhanced displacement and progressive rock slope failure (Gischig et al., 2011). After a certain fa-tigue life, tensile and compressive strength reduce to resid-ual values (Jia et al., 2015). Besides the relatively slow pro-cess of heat conduction, the warming of frozen fractured bedrock is influenced by advective heat transport by perco-lating water. This process efficiently transfers heat from the surface to fractures (Hasler et al., 2011). Such advective heat transport produces rapid variations in mechanical properties, which can potentially deform frozen discontinuities and con-sequently prepare rock slope failures. However, the poten-tial formation of basal ice layers between the snow and the rock prevents percolation of snow meltwater into fractures (Phillips et al., 2016).
1.1.3 Hydrokinematics occurs during summer months and during snowmelt
Irreversible displacement caused by water-related processes can only be observed in summer, because the availability of liquid water is very limited during winter. Water can increase the effective stress through hydrostatic pressure but leave the strength (i.e., cohesion and friction) untouched, whereby hy-drostatic pressure is mostly determined by the height of the water column. It depends, among other factors, on the hy-draulic permeability of the rock mass. Hyhy-draulic permeabil-ity is much lower in rock masses with frozen and ice-filled
Figure 3. Three-dimensional overview of the Hörnligrat field site on the northeast ridge of the Matterhorn in Valais, Switzer-land (based on http://www.map.geo.admin.ch, Google Earth and SRTM). Colors indicate the potential permafrost distribution (FOEN, 2005). At this field site, extensive permafrost with a thin active layer is expected on the north side of the ridge. On the south side of the ridge, local permafrost is possible with a considerable active layer.
fissures than unfrozen fissures and often causes high hydro-static stress due to perched water (Pogrebiskiy and Cherny-shev, 1977). However, there are no detailed empirical quanti-tative studies on how hydrostatic pressure affects rock walls in permafrost regions (Krautblatter et al., 2013). Hydrostatic pressure is presumed not to dominate in the near-surface layer of strongly fractured steep bedrock, where the ability for drainage is quite high. However, changing conditions in shear zones, e.g., from dry to wet, can lead to irreversible displacement, for example caused by water (melting snow or rain) percolating through preexisting fissures. Even with low hydrostatic pressure, the presence of water can reduce cohe-sion in fine-grained material containing clay and is expected to have a strong influence in fractures filled with fine-grained material.
1.1.4 Long-term evolution
In the long term, displacements along fractures act to change the persistent gravitationally induced stress distribution in the rock mass controlled by the bulk material stiffness and rock mass strength properties. Deformation and fracture of ice can absorb stress along fractures and lead to disloca-tion (Matsuoka, 1990), while fracture infill by debris or fine grained material can significantly alter shear resistances of fractures in a frozen or unfrozen state. Persistent reversible thermoelastic oscillations of an initially stable rock mass (stable phase in Fig. 2), in combination with an increase in shear stress due to concentration of stress at rock bridges or a decrease in shear resistance, lead to irreversible surface dis-placement (unstable phase in Fig. 2). Therefore, irreversible
displacements could be a first indication for the initiation of rock slope failure.
However, reversible and irreversible displacements are of-ten superimposed and it is difficult to interpret kinematics data and relate them to external forcing. Furthermore, failure of heterogeneous natural materials often results from the cul-mination of progressive irreversible damage involving com-plex interactions between multiple defects and growing mi-crocracks (Faillettaz and Or, 2015). Therefore quantifying the irreversible component of the overall fracture displace-ment is expected to give valuable information in the context of rock slope stability assessment (Fig. 1).
1.2 Aim of this study
This study focuses on the kinematics of fractured bedrock permafrost (Fig. 1a). It aims to quantify irreversible frac-ture displacements in relation to environmental forcing. For this, the reversible (elastic) components of fracture displace-ment due to thermoelastic strains, are separated from the ir-reversible (plastic) component, due to other processes. Us-ing a statistical model for the reversible component, we are able to investigate the kinematics in fractured bedrock per-mafrost with a focus on enhanced opening and shearing of fractures. The term displacement used in the following refers to the movement of one side of the fracture with respect to the other. Irreversible displacement refers to slow rock slope de-formation, which could be seen as a part of slope instability, potentially preparing slope failure. The statistical model in-troduced here has been developed and tested on the base of 8 years of continuous high-resolution temperature and fracture kinematics measurements from the Matterhorn Hörnligrat, a high mountain permafrost monitoring site. This study ad-dresses three main questions:
1. How can we statistically separate reversible from irre-versible fracture kinematics?
2. Is there a common interannual pattern of irreversible fracture displacements in all instrumented fractures? 3. Under what environmental conditions do enhanced
irre-versible fracture displacements occur?
2 Site description, instrumentation and field data The relative fracture displacement and thermal conditions were measured at Matterhorn Hörnligrat (Swiss Alps) at an elevation of 3500 m a.s.l. (see Fig. 3) using the experimental setup by Hasler et al. (2012). The field site is suitable for such measurements due to (1) the occurrence of ice-filled fractures indicated by an ice-containing scarp after a block fall event (approx. 1500 m3) in summer 2003, (2) strong fracturing and (3) a large gradient of surface thermal conditions allowing installation of thermistors and crackmeters at locations with contrasting conditions (cf. Hasler et al., 2012).
Figure 4. Four webcam pictures, taken in the morning on (a) 1 January 2015, (b) 3 April 2015, (c) 1 July 2015 and (d) 1 October 2015, illustrate the varying snow deposition patterns.
This field site consists of spatially heterogeneous steep, fractured bedrock with partially debris covered ledges. The mean annual air temperature is −3.7◦C for the time pe-riod 2011–2012 (see Fig. A1 in Appendix A). The precipi-tation mostly falls as snow with occasional infrequent rain-fall events in summer. Winter temperatures (down to −27◦C in 2011–2012) in combination with exposure to strong wind (up to 88 km h−1in 2011–2012) results in a preferential snow deposition in fractures, on ledges and at other concave mi-crotopographical features, which can be observed using the webcam images (see Fig. 4). On the south side the accumu-lated firn disappears completely during summer, while on the north side snow patches persist all year round. These factors lead to a complex temperature regime and therefore need a correspondingly large amount of precisely measured data (Krautblatter et al., 2012).
In this study three types of data were recorded at dif-ferent locations: relative fracture displacements perpendic-ular to and along fractures at 2 min intervals (temperature compensated, accuracy of ±0.01 mm over entire temperature range), temperature at different depths in rock and in frac-tures at 2 min intervals (accuracy of ±0.2◦C) and meteoro-logical data using a Vaisala WXT520 weather station (loca-tion mh25 in Fig. 5). The time series of the weather sta(loca-tion is interrupted for brief periods (several weeks) due to techni-cal problems with the electronics, but a complete continuous time series is available for the years 2011 and 2012. Seven high-resolution images per day (12.0 MP, giving an approx-imate pixel resolution of 1.5 cm) serve for visual inspection of the instrumentation and also provide information on snow deposition.
Figure 5 gives a spatial overview of all installations and measurement locations. Basic metadata of the measurement locations are given in Table 1 for all locations. Displace-ments perpendicular to the fracture are measured at locations mh02–mh04 while displacements perpendicular and parallel to the fracture are measured at locations mh06, mh08 and
Figure 5. Overview of crackmeter installations. Locations mh01– mh04(indicated with3) are instrumented with one crackmeter per-pendicular to the fracture. Locations mh06, mh08 and mh20–mh22 (indicated with ) are instrumented with two crackmeters to calcu-late displacements perpendicular to and along fracture. Temperature measurements in fractures exist at most locations. Locations with only rock temperature measurements are indicated with 4, while | is used for the weather station. Scarp of the 2003 rockfall is shaded green.
mh20–mh22. Crackmeter at location mh01 is installed next to a fracture on a rock mass with several microcracks (sub-millimeter scale). Temperature in fractures at different depths are available at all crackmeter locations, except at locations mh20–mh22. Rock temperature at different depths (0.1– 0.85 m) is measured at the additional locations mh10–mh12. All sensors are embedded in a low power wireless sensor net-work that provides all-year-round data at near-real time (Beu-tel et al., 2009). The observed temperature and fracture kine-matics measurements were aggregated as 10 min averages to
Table 1. Metadata for all measurement locations, providing characteristics, type, orientation and instrumentation. If type is “fracture”, thermistors are installed in fracture. Otherwise the thermistors are drilled in rock.
Location Characteristics Type Aspect Slope Crackmeter Depth of thermistors T 1, T 2, . . . (m) mh01a intense solar radiation, microcracks fracture 95◦N 75◦ 1 axis 0.1, 0.4, 0.7, 0.5
mh02b concave, often snow, wet fracture 80◦N 50◦ 1 axis 0.1, 0.3, 0.4–0.8 [3, 1, 2] mh03 lower part snow fracture 350◦N 65◦ 1 axis 0.1, 0.4, 0.6–0.8 [5]
mh04 saddle north fracture 320◦N 70◦ 1 axis 0.05, 0.2, 0.2–0.5 [3, 1]
mh06 corner, often snow fracture 90◦N 60◦ 2 axes 0.1, 0.8, 1.5, 1.8 mh08 wide, ventilated, close to ridge fracture 50◦N 90◦ 2 axes 0.1, 1, 2, 3 mh10 intense radiation, fracture 1 m beside rock 140◦N 90◦ – 0.1, 0.35, 0.6, 0.85 mh11 occasionally snow, no fracture rock 340◦N 70◦ – 0.1, 0.35, 0.6, 0.85 mh12 snow free, fracture beside rock 45◦N 85◦ – 0.1, 0.35, 0.6, 0.85
mh20 corner, often snow, wet fracture 70◦N 70◦ 2 axes –
mh21 wide, south side fracture 70◦N 85◦ 2 axes –
mh22 wide, north side fracture 70◦N 85◦ 2 axes –
aInstalled next to a fracture across microcracks.bThe rock instrument broke off completely during a bad weather period (14 August 2015). Number in square brackets indicates
number of thermistors in the given depth range without exact depth information. Depth information or number in italic indicates problems with thermistor.
reduce noise. A detailed description and explanation of the measurement setup is given by Hasler et al. (2012, Sect. 3).
Instrumentation started in autumn 2007 and continuous time series are available since summer 2008 for locations mh02, mh03 and mh06. The measurement network was ex-tended in summer 2010 with additional sensors and by es-tablishing new measurement locations (mh01, mh04, mh08 and mh20–mh22). This results in up to 8 years of data for rock and fracture temperatures, fracture kinematics and en-vironmental conditions.
3 Data analysis method 3.1 Correlation analysis
In a first step, we investigate the linear relation between frac-ture displacements and temperafrac-ture. We looked for a time period during which fracture kinematics are best described by temperature. For the evaluation of these temperature de-pendent fracture kinematics, we compute the Pearson corre-lation (LeBlanc, 2004, p. 292) for varying time periods (dif-ferent start time and duration). Each location instrumented with crackmeters is individually correlated with all available fracture and rock temperature data (depths of used thermis-tors are indicated black in Table 1). Additional constraints are that (1) time periods have to be at least 70 days, (2) time pe-riods have to be in the time window between 1 October 2013 and 1 January 2015 (complete data availability at all instru-mented locations) and (3) the temperature range must exceed 8◦C. This optimal time period is determined independently for displacements perpendicular and along fractures.
3.2 Linear regression model (LRM)
In a second step, we aim to reproduce the reversible com-ponent of fracture kinematics caused by thermoelastic strain. For each measurement location, the linear regression func-tion and its parameters are computed for the optimal time period (training phase) determined by the correlation analy-sis (see Sect. 3.1). The LRM applies this function with tem-perature T (◦C) for the complete time series to reproduce the reversible fracture displacement yrev(mm):
yrev=β0+β1×T + e, (2)
where intercept β0(mm) and slope β1(mm◦C−1) are the
re-gression parameters and e (mm) is the residual. This model is based on the assumption of a constant linear elastic rheology in the considered temperature range for all consecutive years. Irreversible kinematics is assumed to be negligible during the training phase. Note that the LRM is applied indistinctly per-pendicular or along fracture.
3.3 Irreversibility index
We build a metric (termed irreversibility index) that aims at detecting periods during which overall kinematics is not dominated by thermoelastic strains. This index uses the ab-solute difference (1y) between the observed fracture data (yobs) and the modeled reversible fracture kinematics
com-ponent (yrev) given by the LRM as input:
1y = |yobs−yrev| . (3)
Finally, index I is calculated applying the following function to 1y:
I = (µ +2 × σ ) − (µ − 2 × σ ) = 4 × σ, (4) where the sliding functions µ (mean) and σ (standard devi-ation) are evaluated over all data points in the past 21 days.
Figure 6. Thermal conditions and fracture displacements at the Matterhorn Hörnligrat field site over a course of 8 years. (a) The thermal conditions are shown by characteristic rock temperatures for the south, east and north side of the ridge measured at a depth of 0.85 m. The fracture kinematics are shown as normalized displacements (b) perpendicular to and (c) along fractures. A gap in the rock temperature time series of location mh12 (Teast)is filled for the time period November 2012 until July 2013 and from August 2014 onwards, applying quantile mapping using the best regressors approach (Staub et al., 2016) with a coefficient of determination R2=0.92.
The length of the sliding window is a trade off between high noise level and losing important signals due to smoothing. The 2 standard deviation range considers 95 % of data around mean and thus ignores outliers. The output value of the irre-versibility index is a positive number with unit mm yr−1. A value of zero means that the displacement is fully reversible. The higher the number, the higher the proportion of irre-versibility.
3.4 Thawing degree days (TDDs) and fracture kinematics summer shift (SHT)
In order to put the fracture kinematics data in context of thawing or freezing, we use the concept of TDDs. The TDD concept takes into account the amount of energy available for thawing/melting over the course of the year (Huybrechts and Oerlemans, 1990). It is here used as a rough approximation of the total energy available for melting ice or thawing per-mafrost. The TDD is defined as the total sum of daily average rock temperature above 0◦C over 1 year.
The fracture kinematics summer shift ySHTrepresents the
shift in kinematics between two consecutive winters and is calculated as
ySHT=yobs,winter+−yobs,winter−, (5)
with the mean fracture kinematics during winter given by
yobs,winter=
t2
X
k=t1
yobs/n, (6)
where t1=1 November and n the number of measurements.
The end time t2 is usually defined by a fixed date of t2=
1 May unless the rock temperature rises above a defined threshold value of −1◦C before this date. If this is the case, the end time is given by the date when the rock temperature reaches this threshold (t2=date (Trock< −1◦C)).
4 Results and interpretation
Figure 6 shows the rock temperatures at 85 cm depth for dif-ferent aspects (a) and the fracture displacements, relative to the start of the measurements, for all locations perpendic-ular to the fractures (b) and along the fractures (c). Partly reversible fracture displacement can be observed at all lo-cations with different seasonal movement amplitudes, except for location mh02. Most of them also show a long-term trend, indicating an additional irreversible component of variable magnitude and sign. The individual displacement pattern of each location may be influenced by differences in
geomet-Table 2. Regression analysis between temperature (rock or fracture) and observed fracture displacements (perpendicular and along fracture). Regression parameters intercept β0and slope β1, correlation coefficient r and coefficient of determination R2for the time period with the highest correlation coefficient are listed. Depth of the most representative temperature (thermistor T ) is described in Table 1.
Location Temperature Kinematics Time period β0 β1 r R2
(thermistor) (mm) (mm◦C−1)
mh01 fracture @ mh06 (T 2) perpendicular 13 May–22 Jul 2014 8.6 −0.0035 −0.88 0.77 mh02 fracture @ mh04 (T 5) perpendicular 28 Oct–30 Dec 2014 19.0 −0.0127 −0.96 0.92 mh03 rock @ mh12 (T 4) perpendicular 1 Oct 2013–28 Feb 2014 43.5 −0.0404 −0.96 0.92 mh04 fracture @ mh04 (T 4) perpendicular 30 Sep–16 Dec 2014 13.4 −0.0038 −0.95 0.91 mh06 rock @ mh11 (T 4) perpendicular 1 Oct 2013–7 Jan 2014 11.2 −0.0274 −0.98 0.97 mh06 fracture @ mh06 (T 2) along 22 Jul–23 Dec 2014 −134.0 −0.0313 −0.90 0.82 mh08 rock @ mh12 (T 4) perpendicular 21 Jan–1 Jul 2014 19.8 −0.0829 −0.99 0.97 mh08 rock @ mh11 (T 4) along 22 Oct 2013–18 Feb 2014 43.9 −0.0407 −0.95 0.91 mh20 rock @ mh11 (T 4) perpendicular 13 May–15 Jul 2014 72.2 −0.1202 −0.98 0.98 mh20 rock @ mh11 (T 4) along 15 Oct–17 Dec 2013 −19.6 −0.0696 −0.98 0.96 mh21 fracture @ mh02 (T 6) perpendicular 31 Dec 2013–18 Mar 2014 33.0 −0.0947 −0.99 0.97
mh21 rock @ mh11 (T 4) along 7 Jan–9 Sep 2014 −127.6 −0.1620 −0.99 0.97
mh22 fracture @ mh03 (T 4) perpendicular 10 Dec 2013–18 Feb 2014 21.3 −0.0085 −0.94 0.89 mh22 rock @ mh11 (T 4) along 24 Dec 2013–14 Oct 2014 81.4 −0.0363 −0.97 0.93
ric mesoscale arrangement of rock, where different combi-nations of processes dominate. An irreversible displacement is indicated at most locations in early summer (e.g., mh02– mh04, mh06, mh08 and mh20) but the exact timing and pat-tern is difficult to quantify. The fracture displacements of mh02and mh20 are not visible after mid-2015 as they are out of range (Fig. 6). This abrupt and large displacement is due to a small rockfall event with a volume of a few cubic meters on 18 May 2015. The functionality of both crackmeters was, however, not affected. However, the thermistors at location mh02were damaged by falling rocks. Hence the temperature time series ends on 18 May 2015. After this rockfall event, the fracture at location mh02 continued to deform in several small steps until late summer (14 August 2015) when the in-strumented rock broke off completely during a bad weather period (see Fig. 11). The observed variable spatial and tem-poral patterns in fracture displacements (Fig. 6) indicate that a field site cannot be described by a single measurement lo-cation and a short measurement period. Therefore, long-term monitoring of several fractures is essential to observe dif-ferent modes of kinematics and accordingly to improve the process understanding of the fracture kinematics.
In the following paragraph, we present the analysis of a set of three locations in more detail, namely mh02 (south), mh03(north) and mh08 (east, on ridge). These locations were selected according to their contrasting modes of kinematics and their variations in aspect and cover all different patterns of observed fracture displacements.
4.1 Regression analysis of fracture displacement with temperature
The time periods during which fracture displacements ex-hibit best correlation with temperature are shown in Table 2
and have a typical duration of 3 to 5 months. The varia-tion in length of 1–2 weeks results in similar correlavaria-tion coefficients. The regression analysis between temperature and fracture kinematics (perpendicular to and along frac-ture) shows negative correlation coefficient between −0.90 and −0.99 for all instrumented fractures. The fracture dis-placements at most locations correlate best with rock temper-atures at 0.85 m, while the correlation with the other available rock temperatures are much lower. Only a few instrumented fractures correlate best with fracture temperatures (between 0.2 and 0.8 m). In general, all determined time periods for fracture kinematics perpendicular to fracture are in winter or early spring. The time periods for fracture kinematics along fracture are either during winter or during almost the whole year. Note that these determined time periods are used for the further analysis.
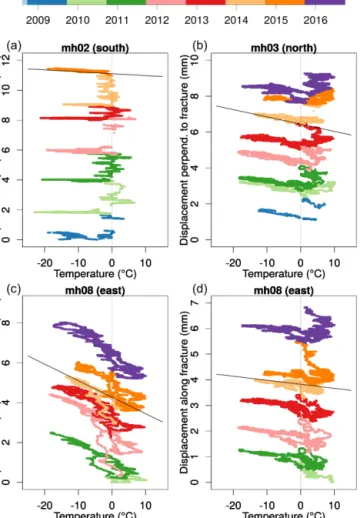
4.2 Thermoelastic reversible response and LRM Figure 7 shows the relation between observed fracture kine-matics and rock temperature. Applying the LRM, we obtain the linear regression coefficients that describe the reversible temperature dependent fracture displacements (black lines in Fig. 7). The fracture displacement at location mh02 (south, Fig. 5) is almost temperature independent (regression co-efficient of −1.2 × 10⁻²mm◦C−1) except for the winters
2008/2009 and 2014/2015. In contrast, location mh03 (north, Fig. 5) shows a stronger temperature dependency of −4.0 × 10⁻²mm◦C−1. At mh08 (east, Fig. 5), the coefficients are with −8.3 × 10⁻²mm◦C−1 perpendicular to fracture and −4.1 × 10⁻²mm◦C−1along fracture. These temperature de-pendencies are likely influenced by the combination of ge-ometric arrangement and acting mechanisms. A potential lack of temperature dependency in the LRM analysis would
Figure 7. Temperature dependency of fracture displacements for location mh02 (perpendicular to fracture), mh03 (perpendicular to fracture) and mh08 (perpendicular to and along fracture). Discrete colors indicate hydrological years (1 October–30 September). Black lines indicate the linear regression function determined by the re-gression analysis (see Table 2).
mean that no reversible or negligible displacements occur that are caused by thermoelastic strain. Or, in other words, irreversible displacements dominate.
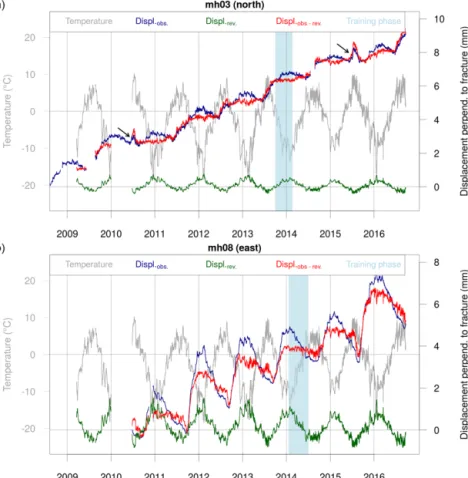
Reversible fracture displacement is now modeled for the whole data set with the LRM (see green lines in Fig. 8) using the regression parameters given in Table 2 (light blue shading in Fig. 8). The red line in Fig. 8 represents irreversible dis-placements, obtained from subtracting reversible displace-ment (green line) from the observed displacedisplace-ment (blue line). This analysis clearly shows that the evolution of irreversible fracture displacement is described for every year by a sin-gle phase of quiescence (or solely reversible displacements) followed by a phase of almost linear irreversible displace-ments once a year. For most locations, including mh03, the distinct irreversible phase occurs during the summer, starting when rock temperatures rise above 0◦C. This likely refers to thawing-related processes with meltwater that percolates
There are, however, discrepancies to this simple temporal pattern, for example for location mh03 (see Fig. 8a, black arrows) additional small excursions in displacement occur in summer 2010 and 2015, when summer temperatures are ex-ceptionally high. Although these excursions seem to be re-versible, they are not explained by the LRM approach. Fur-thermore, for location mh08 in summer, the full amplitude of reversible displacement is not always reproduced by the LRM.
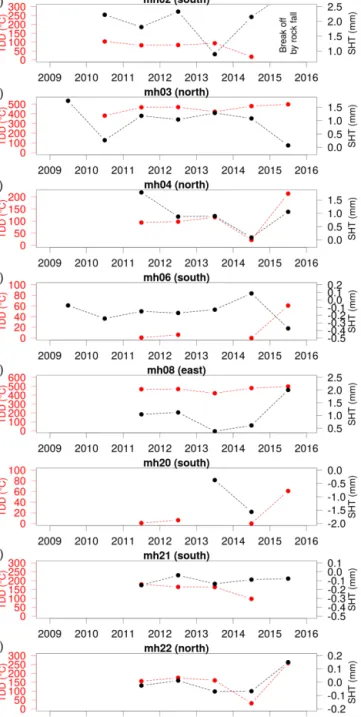
4.3 Thawing degree days and summer shift
The SHT and the TDD are parameters that allow the anal-ysis and interpretation of the interannual evolution (Fig. 9). TDDs are not computed if the temperature time series con-tain a gap during summer. A weak correspondence is appar-ent (see Fig. A3 in Appendix A) for locations with aspects to the north and east. This hints on a substantial influence of rock temperature and therefore incoming conductive energy fluxes. Interestingly, at locations exposed to the south, SHT seems independent of TDDs. The local break-off at location mh02occurred in summer 2015 (described in first paragraph of Sect. 4). This summer exhibits a record high in TDDs at all locations.
4.4 Irreversibility index
The irreversibility index indicates the onset of irreversible displacement and is shown in Fig. 10 for displacements per-pendicular to fractures. In general, this index shows once a year a period with sudden increases of irreversible displace-ment at all locations. High index values can be observed in summer (positive temperatures) at location mh02 (south) and mh03 (north) during thawing period, while in winter low indices occur without any peaks (see Fig. 10a and b). The irreversibility index shows that irreversible displacement is related to positive temperatures, which further supports our findings from the relation between SHT and TDD (Fig. 9).
In contrast, for location mh08 a high irreversibility occurs in autumn when temperatures drop below 0◦C, suggesting freezing as a dominant process. Note, these periods of high indices correspond to the irreversible displacement phase ob-tained from the LRM.
The reversible excursions from the LRM at location mh03 in summer 2010 and 2015 are picked up by increased indices. However, they are reversible displacements that are not rep-resented by the LRM. This points to a potential additional reversible process that cannot be explained only by the ther-moelastic strain.
Figure 8. Linear regression model (LRM; green) applied to the observed displacements (blue) perpendicular to the fracture at location mh03(a) and mh08 (b). The reversible component (green) due to thermoelastic strains in rock can be modeled by a LRM with temperature (dark gray) and displacement measurements during a training period of several months (light blue shading) as input data. Subtracting these reversible displacements from the observed data results in the red line, referred to as irreversible fracture displacement.
5 Discussion
This study aims at quantifying and separating reversible and in particular irreversible fracture kinematics in relation with environmental forcing. The main processes leading to frac-ture kinematics are presented in Fig. 1, enabling us to iso-late different processes from the field observations. Possible interactions between the different processes are not consid-ered but may well occur in nature. Using our quantitative ap-proach, we are able (i) to separate reversible from irreversible fracture kinematics and (ii) to produce a new irreversibil-ity index. This new metric provides a useful indication for the occurrence and timing of irreversible displacement and thereby contributes towards rock slope stability assessment. In the following, we discuss the research questions formu-lated in Sect. 1.2.
5.1 Separation of the reversible fracture kinematics Very high coefficients of determination given by the re-gression analysis (see Table 2) support the suggested linear relation between temperature and fracture kinematics (see
Fig. 1b). The regression analysis is only based on few as-sumptions (see Sect. 3.1), thus preventing coincidental re-lations. The duration of the training periods (set to a min-imum of 70 days) prevent such high coefficients caused by an irreversible process. As the best coefficients are obtained in winter, reversible thermoelastic strain dominates during this period. It further supports the postulated existence of intra-annual periods with negligible irreversible displace-ments. Temperatures deeper in rock/fracture might cause even higher correlation coefficients, as the correlation coeffi-cient mostly increases with increasing depth of the tempera-ture measurement. However, it is difficult to estimate a rep-resentative depth for temperature measurements as the tem-perature variations are attenuated with increasing depth and the deepest available rock temperature measurement on Mat-terhorn is at 0.85 m depth.
The LRM can reliably reproduce the thermoelastic strain for a given temperature and therefore can be used to describe the observed reversible displacement component in all instru-mented fractures. Furthermore, our analysis shows that a se-lected single time period of a few months is representative for the reversible component in displacement for the whole time
Figure 9. Interannual variability of thawing degree days (TDD) and summer shift of fracture kinematics (SHT) perpendicular to frac-tures for all locations. Data at location mh02 are missing from 2015 onwards due to the break-off and the TDD values at a few loca-tions for the year 2014 are removed due to missing or incomplete temperature data.
series when the process thermoelastic strain strongly domi-nates (e.g., winter). Therefore, such a quiescent time period can be used as the training phase for the LRM. The excep-tion is at locaexcep-tion mh02 (see Fig. 11), where the reversible fracture displacement is almost negligible apart from winter 2014/2015 after which the small failure occurred. This
lo-of pure rock material to be very similar, we explain this vari-ation by highly variable volume or length of rock wall mate-rial influencing an individual fracture and by the spatial het-erogeneity in thermal conditions at depth. Hence, the magni-tude of the reversible fracture displacement, caused by ther-moelastic strain, is influenced by the individual geometric mesoscale arrangement of each fracture.
In principle, LRM can be applied the same way to fracture kinematics perpendicular to and along fracture (see Fig. A2 in Appendix A). However, the kinematics along fracture is much more sensitive to the geometric mesoscale arrangement of the fracture. Assuming for instance the rock masses aside the fracture have the same size and thermal condition, the thermoelastic strain is also the same and no relative displace-ment along fracture is measured.
Observed reversible excursions in displacement at location mh03in summer 2010 as well as in summer 2015 are not caused by thermoelastic stress, which is also evident from the high values of the irreversibility index (Fig. 10). These excursions in displacement may be caused by a nonlocal ef-fect or point to an additional unidentified process causing re-versible displacement. These excursions sporadically occur during summer with very high temperatures. Ice pressure and its release by melting can also produce reversible excursions with a fracture opening during freezing and a fracture clos-ing durclos-ing meltclos-ing. However, the closclos-ing phase would have to start at the melt onset, which is clearly not observed. Thus ice formation is not playing a dominant role for reversible fracture kinematics.
5.2 Interannual pattern of irreversible fracture kinematics
Close to a decade of field measurement provides enough data for interannual analysis of fracture kinematics. In general, all instrumented locations show a trend of fracture opening or closing perpendicular to fractures, but with different rates. At each individual location, the temporal pattern of displace-ments is very similar every year, but the irreversible SHT slightly varies over time. According to our analysis, this sum-mer shift seems at least for north-facing locations to correlate slightly with an increasing total amount of available energy (TDD). This suggests that further warming and therefore in-creasing TDDs cause thawing of permafrost at greater depth, potentially leading to an increase in SHT. Percolating wa-ter allows effective heat transport along fractures leading to faster temperature increase in fractured rock mass than in in-tact rock. Additionally, water percolation can affect the shear resistance along fractures and lead to a decrease in friction, which can cause irreversible displacement. For example at
Figure 10. Irreversibility index for (a) location mh02 (south), (b) location mh03 (north) and (c) location mh08 (east, on ridge) as an indicator for periods, where the irreversible displacement dominates. Black bars indicate periods where no or reduced data are available.
Figure 11. Linear regression model (LRM; green) applied to the observed displacements (blue) perpendicular to the fracture at location mh02. The reversible component (green) due to thermoelastic strains in rock can be modeled by a LRM with temperature as input data (dark gray) and displacement measurements during a training period of several months (light blue shading). Subtracting these reversible displacements from the observed data results in the red line, referred to as irreversible fracture displacement.
location mh02, enhanced availability of water from snowmelt after summer snowfall events seems to cause accelerated ir-reversible displacements.
As TDDs are derived from mean daily rock temperature, the relation between SHT and TDD in south-exposed and warmer rock should be interpreted carefully. Rapid variation
late with the SHT (e.g., mh02 or mh21).
The presented summer shift only provides total displace-ment between two winters without any intra-annual informa-tion. In contrast, the irreversibility index can be seen as a proxy of impending rockfall activity and reveals information on the short-term evolution of the irreversible fracture kine-matics all year round, even if the total SHT is small. Despite based on local measurements, such an index can help to iden-tify periods of enhanced irreversible fracture kinematics or risk for failure (see Fig. 2). For example, a strong increase was observed in early summer 2015 at location mh02, fol-lowed by several small rockfalls and a final break-off (ap-prox. 2–3 m3; timing indicated in Fig. 10a). Similar at loca-tion mh03, irreversible displacement occurs during the melt period, which is likely related to a reduction of friction along a fracture line.
However, there are also irreversibility index peaks in au-tumn, e.g., at location mh08 (east, on ridge, Fig. 10c), which do not correlate with thawing days but with rapid cooling and freezing in autumn. In this case, the growth of ice in late au-tumn acts as a driving factor through increasing ice pressure by cryogenic processes. Interestingly no fracture closing is observed during ice melt period in the subsequent summer indicating irreversibility of such a process. Such thermoelas-tic and cryogenic forcing of fracture kinemathermoelas-tics has been hy-pothesized by Hasler et al. (2012), but their data were not fully conclusive on this point due to the short duration of the data set (1–2 years).
5.3 Environmental controlling of irreversible fracture kinematics
Combined analysis of LRM and irreversibility index exhibits distinct periods of solely reversible fracture kinematics and others with additional irreversible fracture kinematics. Irre-versible displacement seems to be driven by environmental conditions, namely by rock temperature above 0◦C (indicat-ing thaw(indicat-ing) or less commonly by periods of freez(indicat-ing con-ditions. In the main winter time (temperatures well below freezing) after the initial cooling phase, none of the instru-mented fractures shows irreversible displacement. Seasonal freezing and thawing of the rock mass in the active layer can influence fracture kinematics in several ways and can lead to irreversible displacements. On the one hand, warming influ-ences the fracture toughness of rock bridges, creep of ice and total friction along existing shear zones (Krautblatter et al., 2013). On the other hand, water from the surface mainly by snowmelt can percolate into fractures. This increased water availability can refreeze at the permafrost table and cause cryogenic pressure. If the water and/or heat supply is high
cannot be confirmed. These patterns may be oversimplified, as this study shows that the related processes are often super-imposed on and not clearly distinguishable.
6 Conclusions
Knowledge of processes and factors affecting rock slope sta-bility is essential for detecting and monitoring potentially hazardous rock slopes. A unique 8-year time series of ture kinematics is presented, providing new insights on frac-ture kinematics with respect to thermal conditions on steep, high-alpine rock slopes. The intra- and interannual behav-ior of the fracture kinematics strongly varies between loca-tions, but patterns at individual locations are consistent over the entire observation period. Long-term monitoring at mul-tiple fractures thus essentially helps to improve the process understanding of fracture kinematics.
The regression analysis highlights periods with a signif-icant negative correlation between fracture kinematics per-pendicular to fracture and temperature for all locations. Inter-estingly, the most representative time periods used for train-ing the LRM occur in winter and early sprtrain-ing. The pro-posed LRM approach provides a tool for systematic analy-sis of fracture kinematics and was successful in separating reversible from irreversible displacements. An irreversibil-ity index was built to detect irreversible displacement and its link to environmental forcing. Eight years of relative sur-face displacement measurements show that reversible frac-ture kinematics caused by thermoelastic strains of the mate-rial is occurring at all locations except one all year round but is temporarily superimposed by other processes. Additional phases of irreversible displacement with a stepwise behav-ior occur mostly during periods with temperature above 0◦C suggesting a decrease in friction along fractures as a respon-sible process. At one location, ice formation due to freezing during the onset of the winter also causes irreversible dis-placements. These results are supported by the developed ir-reversibility index. As irir-reversibility can lead to rock slope failure, quantifying irreversible kinematics is a first step to-ward assessing rock slope stability.
However, this approach to measure relative surface dis-placement has limited time resolution and provides only point information from near the surface and with a limited spatial coverage. Ongoing analysis of microseismic activity, currently measured on this field site, could potentially give insights with a very high temporal resolution and an extended spatial coverage. Clustering of microseismic events coinci-dent to rock fracturing (Murton et al., 2016) could reveal insights into relevant fracturing types. Coupling
spatiotem-poral characterization of irreversible displacement with in-ternal progression of microcrack activity could significantly improve process understanding and be applied in the context of an early warning system.
7 Data availability
All data (processed and aggregated as 10 min averages) are available in the Supplement as a csv file for each location. The metadata are given in Table 1. Additional data can be accessed via the PermaSense GSN data portal (http://data. permasense.ch). A system documentation and tutorial for on-line data access is available on the PermaSense project web page (www.permasense.ch/).
Figure A1. Time series of the in situ installed Vaisala WXT520 weather station providing air temperature and wind speed for the years 2011 and 2012. The 10 min averages are shown in gray (air temperature) and light blue (wind speed), whereas weekly averages are shown in dark gray (air temperature) and dark blue (wind speed). Dashed dark gray line represents the mean temperature.
Figure A2. Linear regression model (LRM; green) applied to the observed displacements (blue) along the fracture at location mh08. The reversible component (green) due to thermoelastic strains in rock can be modeled by a LRM with temperature as input data (dark gray) and displacement measurements during a training pe-riod of several months (light blue shading). Subtracting these re-versible displacements from the observed data results in the red line, referred to as irreversible fracture displacement.
Figure A3. Summer shift (SHTsummer) of displacement perpendic-ular to fracture against yearly thawing degree days (TDDyear) for locations mh02, mh03, mh04, mh08, mh21 and mh22. The black line indicates the regression function.
The Supplement related to this article is available online at doi:10.5194/tc-11-567-2017-supplement.
Author contributions. Jan Beutel and Andreas Hasler designed the field experiment and installed the sensors in 2010 and 2012. Jan Beutel and Samuel Weber have done maintenance work and data management tasks since spring 2012. The analysis code in R was written by Andreas Hasler and Samuel Weber. Samuel Weber developed the model code as well as the irreversibility index and performed the data analysis. Samuel Weber prepared the manuscript with substantial contribution of all co-authors.
Competing interests. The authors declare that they have no conflict of interest.
Acknowledgements. The work presented in this paper is part of the project X-Sense 2 and was financed by http://www.nano-tera.ch (ref. no. 530659). We acknowledge the PermaSense team, namely Tonio Gsell and Christoph Walser, who provided valuable support with the development of measurement devices, in the field and with data management. We thank Max Maisch for providing us geomorphic considerations for Fig. 3 and Marcia Phillips for editing the English. Reviews from Valentin Gischig and three anonymous referees provided valuable comments that helped to improve the paper substantially.
Edited by: K. Isaksen
Reviewed by: V. Gischig and three anonymous referees
References
Arosio, D., Longoni, L., Papini, M., Scaioni, M., Zanzi, L., and Alba, M.: Towards rockfall forecasting through observing defor-mations and listening to microseismic emissions, Nat. Hazards Earth Syst. Sci., 9, 1119–1131, doi:10.5194/nhess-9-1119-2009, 2009.
Beutel, J., Gruber, S., Hasler, A., Lim, R., Meier, A., Plessl, C., Talzi, I., Thiele, L., Tschudin, C., Woehrle, M., and Yuecel, M.: PermaDAQ: a scientific instrument for precision sensing and data recovery in environmental extremes, in: The 8th ACM/IEEE International Conference on Information Processing in Sensor Networks, San Francisco, California, USA, http://dl.acm.org/ citation.cfm?id=1602165.1602190, 2009.
Blikra, L. H. and Christiansen, H. H.: A field-based model of permafrost-controlled rockslide deforma-tion in northern Norway, Geomorphology, 208, 34–39, doi:10.1016/j.geomorph.2013.11.014, 2014.
Davidson, G. and Nye, J.: A photoelastic study of ice pres-sure in rock cracks, Cold Reg. Sci. Technol., 11, 141–153, doi:10.1016/0165-232X(85)90013-8, 1985.
Davies, M., Hamza, O., and Harris, C.: The effect of rise in mean annual temperature on the stability of rock slopes contain-ing ice-filled discontinuities, Permafrost Periglac., 12, 137–144, doi:10.1002/ppp378, 2001.
Faillettaz, J. and Or, D.: Failure criterion for materials with spa-tially correlated mechanical properties, Phys. Rev. E, 91, 032134, doi:10.1103/PhysRevE.91.032134, 2015.
Gischig, V., Moore, J. R., Evans, K., Amann, F., and Loew, S.: Thermomechanical forcing of deep rock slope deformation: 1. Conceptual study of a simplified slope, J. Geophys. Res., 116, F04010, doi:10.1029/2011JF002006, 2011.
Gruber, S. and Haeberli, W.: Permafrost in steep bedrock slopes and its temperature-related destabilization following climate change, J. Geophys. Res., 112, F02S18, doi:10.1029/2006JF000547, 2007.
Gruber, S., Hoelzle, M., and Haeberli, W.: Permafrost thaw and destabilization of Alpine rock walls in the hot summer of 2003, Geophys. Res. Lett., 31, L13504, doi:10.1029/2004GL020051, 2004.
Hall, K., Thorn, C. E., Matsuoka, N., and Prick, A.: Weathering in cold regions: some thoughts and perspectives, Prog. Phys. Geog., 26, 577–603, doi:10.1191/0309133302pp353ra, 2002.
Hallet, B., Walder, J., and Stubbs, C.: Weathering by segregation ice growth in microcracks at sustained subzero temperatures: Ver-ification from an experimental study using acoustic emissions, Permafrost Periglac., 2, 283–300, doi:10.1002/ppp.3430020404, 1991.
Harris, C., Vonder Mühll, D., Isaksen, K., Haeberli, W., Sollid, J., King, L., Holmlund, P., Dramis, F., Guglielmin, M., and Palacios, D.: Warming permafrost in European mountains, Glob. Planet. Change, 39, 215–225, doi:10.1016/j.gloplacha.2003.04.001, 2003.
Hasler, A., Gruber, S., Font, M., and Dubois, A.: Advective heat transport in frozen rock clefts: Conceptual model, laboratory ex-periments and numerical simulation, Permafrost Periglac., 22, 378–389, doi:10.1002/ppp.737, 2011.
Hasler, A., Gruber, S., and Beutel, J.: Kinematics of steep bedrock permafrost, J. Geophys. Res., 117, F01016, doi:10.1029/2011JF001981, 2012.
Huybrechts, P. and Oerlemans, J.: Reponse of the Antarctic Ice Sheet to future greenhouse warming, Clim. Dynam., 5, 93–102, doi:10.1007/BF00207424, 1990.
Jia, H., Xiang, W., and Krautblatter, M.: Quantifying rock fatigue and decreasing compressive and tensile strength after repeated freeze-thaw cycles, Permafrost Periglac., doi:10.1002/ppp.1857, 2015.
Jomelli, V., Brunstein, D., Grancher, D., and Pech, P.: Is the re-sponse of hill slope debris flows to recent climate change uni-vocal? A case study in the Massif des Ecrins (French Alps), Climatic Change, 85, 119–137, doi:10.1007/s10584-006-9209-0, 2007.
Keuschnig, M., Hartmeyer, I., Höfer-Öllinger, G., Schober, A., Krautblatter, M., and Schrot, L.: Permafrost-related mass move-ments: Implications from a rock slide at the Kitzsteinhorn, Austria, in: Engineering Geology for Society and Territory, edited by: Lollino, G., Manconi, A., Clague, J., Shan, W., and Chiarle, M., Springer Internaional Publishing Switzerland, 255– 259, doi:10.1007/978-3-319-09300-0_48, 2015.
rocks become unstable: a rock-ice-mechanical model in time and space, Earth Surf. Proc. Land., 38, 876–887, doi:10.1002/esp.3374, 2013.
LeBlanc, D.: Statistics: concepts and applications for science, Jones and Bartlett Learning, 2 Edn., 2004.
Matsuoka, N.: Mechanisms of rock breakdown by frost action – an experimental approach, Cold Reg. Sci. Technol., 17, 253–270, doi:10.1016/S0165-232X(05)80005-9, 1990.
Matsuoka, N.: Direct observation of frost wedging in alpine bedrock, Earth Surf. Proc. Land., 26, 601–614, doi:10.1002/esp.208, 2001.
Matsuoka, N. and Murton, J.: Frost weathering: recent ad-vances and future directions, Permafrost Periglac., 19, 195–210, doi:10.1002/ppp.620, 2008.
Mellor, M.: Mechanical properties of rocks at low temperatures, in: 2nd International Conference on Permafrost, Yakutsk, Interna-tional Permafrost Association, 334–344, 1973.
Murton, J.: Rock Weathering, in: Encyclopedia of Quaternary Sci-ence, Elsevier, Oxford, 2249–2256, 2007.
Murton, J., Peterson, R., and Ozouf, J.-C.: Bedrock fracture by ice segregation in cold regions, Science, 314, 1127–1129, doi:10.1126/science.1132127, 2006.
Murton, J., Kuras, O., Krautblatter, M., Cane, T., Tschofen, D., Uhlemann, S., Schober, S., and Watson, P.: Monitor-ing rock freezMonitor-ing and thawMonitor-ing by novel geoelectrical and acoustic techniques, J. Geophys. Res.-Earth, 121, 2309–2332, doi:10.1002/2016JF003948, 2016.
Nordvik, T., Blikra, L. H., Nyrnes, E., and Derron, M.-H.: Statistical analysis of seasonal displacements at the Nordnes rockslide, northern Norway, Eng. Geol., 114, 228–237, doi:10.1016/j.enggeo.2010.04.019, 2010.
PermaSense Consortium: PermaSense data access, http://www.permasense.ch/public-data, last access: 21 Septem-ber 2016.
PermaSense Consortium: PermaSense data portal, http://data. permasense.ch, last access: 21 September 2016.
Phillips, M., Haberkorn, A., Draebing, D., Krautblatter, M., Rhyner, H., and Kenner, R.: Seasonally intermittent water flow through deep fractures in an alpine rock ridge: Gemsstock, Central Swiss Alps, Cold Reg. Sci. Technol., 125, 117–127, doi:10.1016/j.coldregions.2016.02.010, 2016.
and Appenzeller, C.: The role of increasing temperature vari-ability in European summer heataves, Nature, 427, 332–336, doi:10.1038/nature02300, 2004.
Sidle, R. C. and Ochiai, H.: Landslides: processes, prediction, and land use, in: Water Resources Monograph Series, American Geophysical Union, Washington, DC, 18, doi:10.1029/WM018, 2006.
Staub, B., Hasler, A., Noetzli, J., and Delaloye, R.: Gap-filling al-gorithm for ground surface temperature data measured in per-mafrost and periglacial environments, Perper-mafrost Periglac., 28, 275–285, doi:10.1002/ppp.1913, 2016.
Terzaghi, K.: Stability of steep slopes on hard unweathered rock, Géotechnique, 12, 251–270, doi:10.1680/geot.1962.12.4.251, 1962.
Walder, J. and Hallet, B.: A theoretical model of the fracture of rock during freezing, Geol. Soc. Am. Bull., 96, 336–346, doi:10.1130/0016-7606(1985)96<336:ATMOTF>2.0.CO;2, 1985.
Watson, A. D., Moore, D. P., and Stewart, T. W.: Temperature influ-ence on rock slope movements at Checkerboard Creek, in: Pro-ceedings of the ninth International Symposium on Landslides, 2, 1293–1298, doi:10.1201/b16816-187, 2004.
Wegmann, M. and Gudmundsson, G. H.: Thermally induced tem-poral strain variations in rock walls observed at subzero temper-atures, in: Advances in old-region thermal engineering and sci-ences, edited by: Hutter, K., Wang, Y., and Beer, H., Springer Berlin Heidelberg, 533, 511–518, doi:10.1007/BFb0104208, 1999.
Wolters, R.: Zur Ursache der Entstehung oberflächenparalleler Klüfte/Some Reflections on the Cause of the Formation of Joints Parallel to the Surface, Rock Mech., 1, 53–70, doi:10.1007/BF01247357, 1969.