Fine forecasts: encouraging the media to include
ultraviolet radiation information in summertime
weather forecasts
R. Richards
1, A. I. Reeder
1,3and J.-L. Bulliard
2Abstract
Melanoma and skin cancer are largely attribut-able to over-exposure to solar ultraviolet radia-tion (UVR). Reports of UVR levels within media weather forecasts appear to be well received by the public and have good potential to communi-cate the need for appropriate sun protection to a broad audience. This study describes provision of UVR messages by New Zealand newspapers, radio and TV stations over a 4-year period, and examines the impact of an intervention which aimed to address media concerns about the financial costs of accessing UVR information for broadcast. Newspaper and radio presenta-tion of UVR informapresenta-tion increased immediately after these costs were removed; however, among radio stations it dropped in subsequent years. Among those media that were presenting UVR, this information was broadcast throughout the summer period and repeated throughout the day. Furthermore, most reports included con-comitant, behavioral sun protection messages. At the final assessment (summer 2001/02), 66% of radio stations, both TV channels and 48% of newspapers reported UVR information in summertime weather reports. Efforts to further increase UVR presentation will need to address
media concerns about time constraints on weather forecasts and media perceptions of poor audience demand or understanding of some UVR messages.
Introduction
Sunlight falling on human skin stimulates synthesis of vitamin D3, which is essential for healthy bone
growth and maintenance. Adequate sun exposure for cutaneous synthesis can be gained through short, suberythemal (non-burning) ultraviolet ra-diation (UVR) exposure (National Radiological Protection Board, 2002). Excess UVR exposure that, in the short-term, results in tanning or sunburn provides no known additional health benefit, but significantly increases, in the long-term, the risk of developing cutaneous malignant melanoma (mel-anoma) and non-melanoma skin cancer (NMSC) (Armstrong, 1994).
Skin cancer prevention is a particularly signifi-cant public health issue for countries with high so-lar UVR levels and substantial fair-skinned migrant populations. The Caucasian population of Auck-land, the most populous region of New ZeaAuck-land, has one of the highest reported age-standardized mel-anoma incidence rates in the world (Parkinet al., 2002). In 1999, melanoma was the third most common cancer registered for New Zealand women and the fourth for men, accounting for 231 deaths and 1502 registrations nationally (New Zealand Health Information Service, 2002). Each year, NMSC causes around an additional 65 deaths among an estimated 45 000 new cases (O’Dea, 2000).
1Social and Behavioural Research in Cancer Group,
Department of Preventive and Social Medicine, University of Otago, PO Box 913, 9015 Dunedin, New Zealand and
2Cancer Epidemiology Unit, University Institute of Social
and Preventive Medicine, 1005 Lausanne, Switzerland
3
Correspondence to: A. I. Reeder; E-mail: [email protected]
New Zealand’s high rates of skin cancer can largely be attributed to historically high summer levels of erythemal solar UVR, which can exceed those at comparable latitudes during the Northern Hemisphere summer by as much as 50% (McKen-zie et al., 1999a). Ozone depletion has recently contributed to raised levels in New Zealand, with peak summer erythemic UVR levels increasing 12% in the 1988–98 decade (McKenzie et al., 1999b). There is a strong argument, based on the health risks posed by high summer UVR, for UVR readings to be presented in media weather reports to reinforce the message that communities need to consider high UVR periods when planning outdoor activities just as they would other potential hazards, like high winds, heavy rain or frost and snow. Ideally these would remind about and reinforce the other sun protection messages used in New Zealand that describe the appropriate protective behaviors such as seeking shade and wearing a sunhat. The need to do this is corroborated by the fact that in the summer of 1999–2000, one-quarter of New Zea-landers aged 15–69 years who were outdoors for at least 15 min between 11 a.m. and 4 p.m. on either Saturday or Sunday of the previous weekend re-ported having experienced some sunburn (NFO CM Research, 2000).
UVR reports are well received, with 85% of New Zealand respondents finding it ‘useful’ to receive a regular reminder of UVR intensity and associated recommended sun protective behaviors (Bulliard and Reeder, 2001). UVR messages appear to be reasonably well understood by the general public (Geller et al., 1997) although the degree of un-derstanding may differ between different types of message. One study found that Burntime (BT) was perceived as ‘easy to understand’ by a greater proportion of the public; however, accurate inter-pretation of the meaning of each message was greatest for the Ultraviolet Index (UVI) (Bulliard and Reeder, 2001). Awareness of UVR forecasts varies with around 90% awareness reported in Australia (Alberink et al., 2000) and 64% in the US (Geller et al., 1997). Interestingly, both these studies showed that among those who were aware of UV forecasts, one-third had changed their
be-havior in response, suggesting UV forecasts have good potential to communicate the need for appro-priate sun protection.
The UVI describes (via a numeric scale) the level of solar UVR at the Earth’s surface and is the recommended international measure for reporting solar UVR (ICNIRP, 2002). In New Zealand, the UVI was pre-dated by the BT, a measure which estimates the time it takes for exposed sun-sensitive skin to register a minimal erythemal dose, i.e. a visible reddening of the skin from erythemi-cally weighted solar UV. The BT has high accep-tance among the New Zealand public (Bulliard and Reeder, 2001), but lacks accuracy, reliability and international comparability as it is not a standard scientific measure, and varies considerably with skin type.
Although scientific consensus supports presen-tation of the UVI over the BT, attitudes and preferences among the New Zealand media and public, now accustomed to the BT, need to be con-sidered in efforts to promote the provision and optimal use of UVR forecasts. Perceptions held by the media are of particular interest as they are gatekeepers for the widespread dissemination of UVR forecasts. Even when a relatively high proportion of the media report solar UVR levels, several barriers to its regular use persist (Geller et al., 1997). These include commercial pressures for broadcasts to appear ‘fresh’ and retain audience ratings, concerns that UVI readings change little during summer, potential confusion with other indexes of smog or pollen, and restrictions on forecast content due to time constraints.
In New Zealand there is a unique opportunity to examine the use of two UVR messages (UVI and BT) in summer forecasts, and to extend previous findings by surveying radio stations in addition to TV and newspapers (Gelleret al., 1997). Identify-ing barriers to the presentation of UV forecasts and the UVI, in particular, will assist efforts to increase availability of UV information to the New Zealand public. Accordingly, the aims of the present study were three-fold: (1) to monitor sun protection mea-sures and messages used in media weather reports over a 4-year period, (2) to document the barriers
to presenting UVR forecasts identified by media presenters (with a particular focus on the UVI), and (3) to use this information to evaluate the im-pact of sponsored provision of UVR information to the media.
Methods
Study design
Assessment of media presentation of UVR infor-mation began during the 1998/99 New Zealand summer (December to February). Initial assessment involved a mail survey of radio and TV stations, and the clipping and content analysis of newspaper weather reports for the month of January. Moni-toring continued for the next 3 years, with annual summertime surveys of radio and TV stations, and archiving of newspapers. In addition, newspapers that were not presenting UVR information (indi-cated by the content analysis) were surveyed during the summer of 2001/02.
Survey procedure
For each survey, a questionnaire was mailed in February, addressed to the ‘Weather presenter/ News reader’ at radio and TV stations or to ‘The Editor’ at newspapers. A letter of introduction pre-senting the rationale for the study and a pre-paid, self-addressed envelope were enclosed. Another mail-out was sent 1 month later with a reminder letter encouraging participation and the same con-tents as the original mailing.
The questionnaires assessed the presentation of the UVI and BT during weather reports. Those who did report using the UVI, BT or both were asked to indicate the date of first publication/broadcast each summer and whether this information was presented alone or along with other sun protection information. The times of day when information was presented were also assessed in the initial survey of radio and TV stations. Among those not presenting a particular UVR message, barriers to such a presentation were sought. The final survey (2001/02) was limited to an assessment of barri-ers to presenting the UVI. For each question, set
response options were provided, but with a free-text option, where appropriate. Information was ob-tained about the sources used when compiling weather reports.
Newspaper content analysis
The newspaper presentation of UVR informa-tion was assessed from physical copies of summer weather reports obtained for each day in January each year. When actual issues could not be obtained, photocopies were obtained from library archives.
Data analysis
Circulation figures for newspapers were obtained from the New Zealand Audit Bureau of Circulations Inc. (The New Zealand Audit Bureau of Circulations Inc., 1999, 2000, 2001, 2002). Because circulation varied greatly between newspapers, audited circu-lation figures were used to calculate weighted aver-ages of the proportion of newspapers reporting UVR information.
Sample
Location
New Zealand has a population of around 4 million (Statistics New Zealand, 2002) and a relatively tem-perate climate (mean summer temperature 16.6°C) (National Institute for Water and Atmospheric Research, 2002). During summer, solar UVR reaches levels that are up to 50% higher than those experienced at similar Northern Hemisphere lati-tudes (McKenzieet al., 1999a) (see Figure 1, pro-vided courtesy of National Institute for Water and Atmospheric Research).
Radio and TV
The radio stations sampled included all members of the Radio Broadcasters Association of New Zea-land (RBA), which represents around 95% of all commercial radio stations, and representatives from each of the two national, non-commercial public radio stations. The number of potential contacts for radio stations over the monitored years was 75 (1998/99), 77 (1999/2000), 79 (2000/01) and 78 (2001/02). Response rates were, respectively, 76, 66, 77 and 68%. The response rates for the two
national public TV channels broadcasting regular weather reports were 100 (1998/99), 50 (1999/2000 and 2000/01) and 100% (2001/02).
Newspapers
The sampling frame for newspapers included the two major Sunday papers and all Daily and non-Daily press members of the New Zealand Audit Bureau of Circulations Inc. (The New Zealand Audit Bureau of Circulations Inc., 1999), an in-dustry organization that audits circulation figures. Thirty newspapers met the criteria for inclusion in January 1999 and 2000, reducing to 29 in January 2001 and 2002. A response rate of 53% was ob-tained for the 2001/02 survey of the 17 newspapers found, via the content analysis, not to be reporting UV information.
Intervention
Results from the initial 1998/99 survey of radio and TV stations suggested that the cost of purchasing UVR information was a significant barrier to its widespread media presentation. Analysis of the initial survey and content analysis revealed that 90% of the radio and TV sample, and 69% of newspapers received their weather information from the same provider. In response to this in-formation, the Cancer Society of New Zealand spon-sored the free supply of UV information by this provider to the media for 3 years, starting in summer 1999/2000. This national sponsorship was provided at an annual cost of NZ$20 000 (approx-imately £7500 or US$12 500 as at 27 November 2003). The provider delivered both UVI and BT information as part of its summer weather package Fig. 1.Mid-summer clear-sky UVI levels (courtesy National Institute of Water and Atmospheric Research).
to radio station customers, although it could not ensure that it was actually presented. Media using the sponsored information were required to mention that the information was provided courtesy of ‘Sun-Smart’, a Cancer Society and Health Sponsorship Council brand. UVR information was also made available to radio stations that were not customers of this main provider, but a cost recovery communica-tions fee was charged. The provider tried to supply appropriate UVI packages to other media, such as TV and newspapers.
After each assessment period, a summary feed-back sheet of the main survey results was mailed to all media in the sample frame. This feedback was sent out prior to summer and included sources and contact people for accessing UVR information and reasons why public access to UVR information is important.
Results
Patterns of presentation
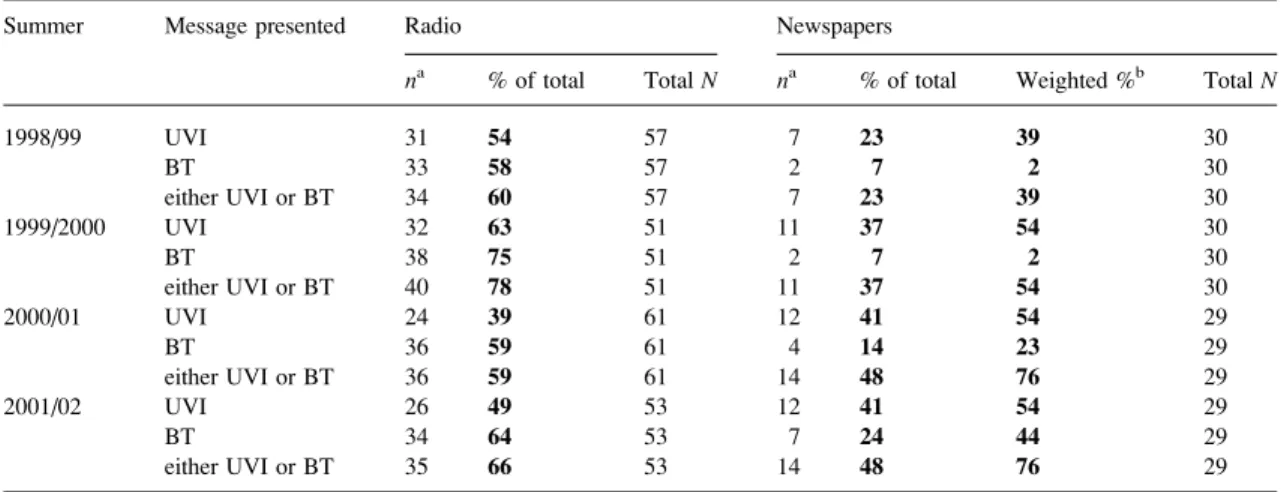
The patterns of presentation of UVR information by type of medium are presented in Table I. Among radio stations, the frequency of presentation of ‘any’ UVR information increased during the
inter-vention year, but dropped in subsequent years, particularly for presentation of the UVI, which fell to below pre-intervention levels. Among the 30 radio stations which responded at all four assessments, seven stations maintained presentation throughout the whole study period, six initiated and sustained presentation after the intervention, and 13 initiated presentation, but did not sustain it.
For newspapers, in addition to the frequencies and simple percentages of presentation, weighted mean percentages of newspapers reporting UVR information, based on audited circulation figures were calculated. These adjusted figures better reflect the proportion of the audience reached by newspapers. Both the unweighted and weighted proportions of newspapers presenting UVR infor-mation increased over time. Encouragingly, those newspapers which initiated UVR presentation during the study period all sustained this presenta-tion in future years. By the final assessment, three-quarters of issued newspapers included UVR information. Further analyses indicated that the increase in availability of UVR information was greatest among the metropolitan dailies and was strongly influenced by practices of the three news-papers with largest circulation figures (data not shown). The availability of sun protection messages
Table I. Summer-time presentation of UVI and BT in New Zealand media, 1998–2002
Summer Message presented Radio Newspapers
na % of total TotalN na % of total Weighted %b TotalN
1998/99 UVI 31 54 57 7 23 39 30 BT 33 58 57 2 7 2 30 either UVI or BT 34 60 57 7 23 39 30 1999/2000 UVI 32 63 51 11 37 54 30 BT 38 75 51 2 7 2 30 either UVI or BT 40 78 51 11 37 54 30 2000/01 UVI 24 39 61 12 41 54 29 BT 36 59 61 4 14 23 29 either UVI or BT 36 59 61 14 48 76 29 2001/02 UVI 26 49 53 12 41 54 29 BT 34 64 53 7 24 44 29 either UVI or BT 35 66 53 14 48 76 29
aNumber of media (n) from the ‘total sample (N)’ which presented each message. b
in newspapers was lowest in northern New Zealand, which has the highest summer UVR levels.
The UVI was presented by TV Station A during the summer of 1998/99, and the BT by both Stations A and B. During the next two consecutive assessments (1999/2000 and 2000/01) only one of the two stations responded, Station A in 1999/2000 and Station B in 2000/01, in each case BT, but not UVI, was reported. In the final assessment (2001/02), once again the BT was presented by both Station A and B, and the UVI by Station A. It is worth noting that in all these cases respondents specified that presentation of UVR in-formation was either occasional or that inin-formation presentation although regular was not routine.
Characteristics of presentation
Daily schedules of radio presentation were assessed during the summer of 1998/99. Of the 34 stations reporting either the UVI or BT, 85% presented it during the morning and at lunchtime, 74% in the afternoon and 3% during the evening. Three of the seven newspapers presenting UVR information were published in the morning and the remaining four in the afternoon. One of the two TV stations reported UVR information at morning, lunchtime, afternoon and evening, while the other reported it during the evening weather report only.
Half to two-thirds of radio stations began pre-senting UVR information during December at each assessment and an additional 16–38% started in November. Available information for TV (1998/99 and 2001/02) and newspapers (1999/2000) indicates presentation of UVR information in these media began during October and November, respectively. The format of radio and TV weather forecasts facilitates the concomitant presentation of informa-tion about sun protecinforma-tion practices. From 1998/99– 2000/01, most (80–92%) radio stations reporting UVR information paired these reports with additional sun protection information. During the summer of 2001/02, 85% of stations presenting the UVI also reported sun protection information. Available data for TV stations suggest that all broadcasts of UVR information from 1998/99–2000/01 and the presen-tation of the UVI in 2001/02 included additional (but not regular or standardized) sun protection messages.
Barriers to presentation
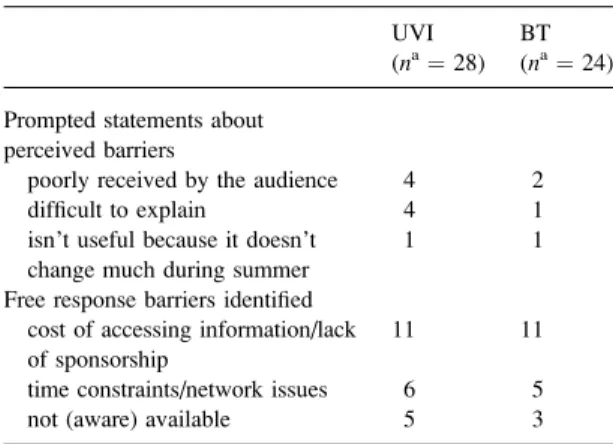
Barriers to presenting UVR information were examined among radio and TV respondents during the first (1998/99) and last (2001/02) summers of the study. Table II shows perceived barriers for radio and TV stations for the first assessment (summer of 1998/99).
During the first year, the dominant issue for radio and TV respondents was the cost of obtaining the information, followed by difficulties experienced in presenting UVR information for a broad geo-graphical area within a limited time. A number of respondents were also unaware that this infor-mation was available for broadcast or identified difficulties in explaining the message and audience understanding. Based on these findings, an inter-vention was developed (see Methods) to address the cost issue, and provide annual feedback on media presentation of UVR information, its importance and contact details for accessing the service.
The intervention appears to have successfully addressed the cost barrier to presentation of the UVI and BT: among the 11 radio stations that reported this barrier in 1998/99 (see Table II), eight broad-cast the UVI and BT during the following summer (1999/2000), with the remaining three not respond-ing to the survey. By the final assessment (2001/ 02), five of these stations were still presenting UVR Table II. Summer 1998/99: perceived barriers to presentation of UVI and BT among radio and TV presenters
UVI (na¼ 28)
BT (na¼ 24) Prompted statements about
perceived barriers
poorly received by the audience 4 2
difficult to explain 4 1
isn’t useful because it doesn’t change much during summer
1 1
Free response barriers identified cost of accessing information/lack of sponsorship
11 11
time constraints/network issues 6 5
not (aware) available 5 3
a
Number of respondents who were not presenting that message (UVI or BT). Multiple responses per respondent were allowed.
information with three stations, again, not respond-ing to the survey.
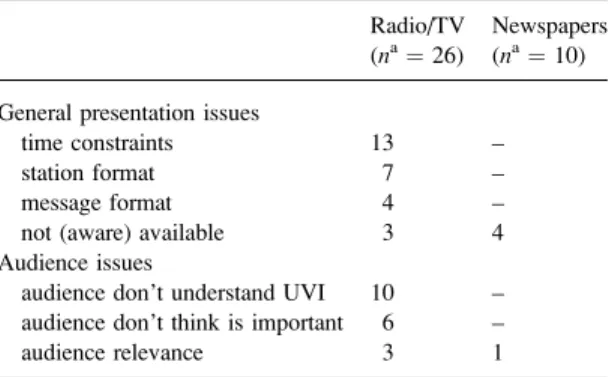
In the final year of the study another survey was conducted which focused on identifying barriers to presentation of the UVI (but not the BT) among the radio, TV and newspapers which were not, at that time, reporting it.
Time constraints were the most commonly reported barrier to UVI presentation on radio and TV stations in 2001/02 (Table III). Respondents reported that they had a very short time to present weather information and many were attempting to provide information for all of New Zealand. Some concerns were raised about the format of the UVI and some respondents expressed difficulties in getting the message to either look or sound right during presentation. Several respondents stated that UV forecasts did not fit with their station format, suggesting that it was the responsibility of other media, such as TV or radio stations with an ‘infor-mation’ focus. TV and radio station respondents also reported that they felt the UVI was not well understood, important or relevant to their audience. A lack of awareness that UVI information was avail-able was the predominant issue for newspapers.
Discussion
It has been recommended that the media be encouraged to report the UVI in their daily weather
information (ICNIRP, 2002); however, little is known about either media use of the UVI or barriers against its presentation. This study showed that in New Zealand, initially, the most common barrier, for radio stations at least, was the cost of obtaining the information. When this barrier was removed in 1999/2000 and information about the availability of UVR levels was widely disseminated, presenta-tion of UVR informapresenta-tion immediately increased among radio and TV stations (from 60 to 78%) and newspapers (from 23 to 37%). When the audience of each newspaper was taken into account, the avail-ability of UVR messages increased from 39 to 54% of newspapers between the 1998/99 and 1999/2000 summers. This increase persisted among newspa-pers over the subsequent two summers, whereas pre-sentation declined somewhat from the intervention year among radio and TV stations (59% in 2000/01 and 66% in 2001/02). Future public health research would benefit from gathering information about radio and TV audiences to allow the potential au-dience reach to be considered, as was able to be done for newspapers in this study. Time constraints ap-pear to be a growing and more common barrier to presentation in recent years. This issue poses a new challenge to the wider presentation of UVR mes-sages and is possibly more complex to tackle than the cost barrier.
The scheduling of presentation of UVR infor-mation appears to be appropriate, with messages presented throughout the day for each medium and for an adequate period of the year. UVR messages are also commonly disseminated with additional sun protection information, including recommen-dations for appropriate protective behaviors. Dur-ing the period of study, the content of additional sun protection information given was decided by media presenters, which may have resulted in some variation in the protective behaviors recommen-ded. Work is underway to develop standard recom-mendations for sun protection behaviors which are associated with specific levels of the UVI.
For historical reasons, New Zealand provides an unusual example where the media commonly and concurrently have used both the UVI and the BT. Due to the lack of universal applicability of BT to all skin Table III. Summer 2001/02: perceived barriers to presentation
of UVI among media not reporting this information Radio/TV (na¼ 26)
Newspapers (na¼ 10) General presentation issues
time constraints 13 –
station format 7 –
message format 4 –
not (aware) available 3 4 Audience issues
audience don’t understand UVI 10 – audience don’t think is important 6 –
audience relevance 3 1
a
Number of respondents who were not presenting the UVI. Multiple responses per respondent were allowed.
types and concerns about its possible misinterpreta-tion as a ‘safe tanning time’, thereby sending the wrong message to the public, its presentation is not recommended (Bulliard and Reeder, 2001; ICNIRP, 2002). The apparent increase in popularity of the BT compared to the UVI, among radio stations in particular, deserves close monitoring. Both messages were often presented, which may be exacerbating concerns among respondents about how to present UV messages within a limited time frame.
Given the widespread and universal use of the UVI, further attempts to increase UVR presentation should focus on the promotion of this measure and a ‘phasing out’ of the BT (Bulliard and Reeder, 2001). In the final year of this study, barriers to presentation of the UVI were again examined to look for ways to further expand and strengthen presentation of this message in New Zealand media weather reports. An appreciation of factors that influence decision making among media organi-zations is vital for organiorgani-zations encouraging the presentation of public health messages. Ideally, organizations would work with media representa-tives to address barriers and provide support for the presentation of timely and accurate messages.
In the case of UVR presentation, a simple and clear message format is needed in order to reduce concerns about time constraints on presenting information. Some education and promotion among both the media and the general public may be necessary to address media concerns about the UVI, such as perceived comprehension and a lack of importance or relevance among audiences. Interestingly, media perception of public comprehension of the UVI appears to be at odds with assessed public under-standing and demand for the UVI in New Zealand (Bulliard and Reeder, 2001). Without a perceived strong demand or incentives for the provision of this service, media are unlikely to be motivated to include the UVI in their weather forecasts.
Acknowledgements
The Social and Behavioural Research in Cancer Group receives support from the Cancer Society of
New Zealand and the University of Otago. Support for this project was also received from a University of Otago Research Grant to A. I. R. and R. R. in 2000. J.-L. B. was supported by a fellowship from the Swiss National Science Foundation (NR32-63130.00).
References
Alberink, A.M., Valery, P., Russell, A. and Green, A. (2000) Do forecasts of UV indexes influence people’s outdoor behav-iours?Australian and New Zealand Journal of Public Health, 24, 488–491.
Armstrong, B.K. (1994) Stratospheric ozone and health. In-ternational Journal of Epidemiology, 23, 873–885. Bulliard, J.-L. and Reeder, A.I. (2001) Getting the message
across: sun protection information in media weather reports in New Zealand.New Zealand Medical Journal, 114, 67–70. Geller, A., Hufford, D., Miller, D.R., Sun, T., Wyatt, S.W.,
Reilley, B., Bewerse, B., Lisco, J., Brooks, D., Grupenhoff, J., Weary, P., Lew, R.A. and Koh, H.K. (1997) Evaluation of the Ultraviolet Index: media reactions and public response.Journal of the American Academy of Dermatology, 37, 935–941. ICNIRP (2002) Global Solar UV Index: A Practical Guide.
WHO, World Meteorological Organization, UN Environment Programme and the International Commission on Non-Ionizing Radiation Protection, Geneva.
McKenzie, R., Bodeker, G. and Connor, B. (1999a) Increased UV radiation in New Zealand: a cautionary tale.Water and Atmosphere, 7, 7–8.
McKenzie, R., Connor, B. and Bodeker, G. (1999b) Increased summertime UV radiation in New Zealand. Science, 285, 1709–1711.
National Institute for Water and Atmospheric Research (2002) Climate Summary for Summer 2001–2002. National Institute for Water and Atmospheric Research, Wellington.
National Radiological Protection Board (2002)Health Effects from Ultraviolet Radiation: Report of an Advisory Group on Non-ionising Radiation. National Radiological Protection Board, Chilton.
New Zealand Health Information Service (2002) Cancer: New Registrations and Deaths 1998. Ministry of Health, Wellington.
NFO CM Research. (2000) Sun Protection Research Report. Cancer Society of New Zealand, Wellington.
O’Dea, D. (2000)The Costs of Skin Cancer to New Zealand. Wellington School of Medicine, University of Otago, Wel-lington.
Parkin, D.M., Whelan, S.L., Ferlay, J., Teppo, L. and Thomas, D.B. (2002) Cancer Incidence in Five Continents. IARC Scientific Publication 155, vol. VIII. International Agency for Research on Cancer, Lyon.
Statistics New Zealand (2002)2001 Census: Population and Dwelling Statistics. Statistics New Zealand, Wellington. The New Zealand Audit Bureau of Circulations Inc. (1999)
of Audited Circulations. The New Zealand Audit Bureau of Circulations Inc., Wellington.
The New Zealand Audit Bureau of Circulations Inc. (2000) Newspapers—Daily, Non-daily, Weekly, Community: Sum-mary of Audited Circulations. The New Zealand Audit Bureau of Circulations Inc., Wellington.
The New Zealand Audit Bureau of Circulations Inc. (2001) Newspapers—Daily, Non-daily, Weekly, Community:
Sum-mary of Audited Circulations. The New Zealand Audit Bureau of Circulations Inc., Wellington.
The New Zealand Audit Bureau of Circulations Inc. (2002) Newspapers—Daily, Non-daily, Weekly, Community: Sum-mary of Audited Circulations. The New Zealand Audit Bureau of Circulations Inc., Wellington.