202 © The Author 2014. Published by Oxford University Press on behalf of the European Orthodontic Society. All rights reserved.
For permissions, please email: [email protected]
Original article
Accuracy of linear measurements using three
imaging modalities: two lateral cephalograms
and one 3D model from CBCT data
Pisha Pittayapat
*
,**
, Michael M. Bornstein
*
,***
, Thaís Sumie Nozu Imada
****
,
Wim Coucke
*****, Ivo Lambrichts
******
and Reinhilde Jacobs
*
*OIC, OMFS IMPATH Research Group, Department of Imaging & Pathology, Faculty of Medicine, University of Leuven and Oral & Maxillofacial Surgery, University Hospitals Leuven, Leuven, Belgium, **Department of Radiology, Faculty of Dentistry, Chulalongkorn University, Bangkok, Thailand, ***Department of Oral Surgery and Stomatology, School of Dental Medicine, University of Bern, Bern, Switzerland, ****Department of Stomatology, Bauru School of Dentistry, University of São Paulo (FOB/USP), São Paulo, Brazil, *****Department of Clinical Biology, Scientific Institute of Public Health, Brussels, Belgium, ******Biomedical Research Institute, Laboratory of Morphology, Hasselt University, Campus Diepenbeek, Diepenbeek, Belgium
Correspondence to: Pisha Pittayapat, OIC, OMFS IMPATH Research Group, Department of Imaging & Pathology, Faculty of Medicine, University of Leuven and Oral & Maxillofacial Surgery, University Hospitals Leuven, Kapucijnenvoer 7, Leuven 3000, Belgium. E-mail: [email protected]
Summary
Background: The aim of this study was to evaluate the accuracy of linear measurements on three
imaging modalities: lateral cephalograms from a cephalometric machine with a 3 m source-to-mid-sagittal-plane distance (SMD), from a machine with 1.5 m SMD and 3D models from cone-beam computed tomography (CBCT) data.
Methods: Twenty-one dry human skulls were used. Lateral cephalograms were taken, using two
cephalometric devices: one with a 3 m SMD and one with a 1.5 m SMD. CBCT scans were taken by 3D Accuitomo® 170, and 3D surface models were created in Maxilim® software. Thirteen linear measurements were completed twice by two observers with a 4 week interval. Direct physical measurements by a digital calliper were defined as the gold standard. Statistical analysis was performed.
Results: Nasion–Point A was significantly different from the gold standard in all methods.
More statistically significant differences were found on the measurements of the 3 m SMD cephalograms in comparison to the other methods. Intra- and inter-observer agreement based on 3D measurements was slightly better than others.
Limitations: Dry human skulls without soft tissues were used. Therefore, the results have to be
interpreted with caution, as they do not fully represent clinical conditions.
Conclusions: 3D measurements resulted in a better observer agreement. The accuracy of
the measurements based on CBCT and 1.5 m SMD cephalogram was better than a 3 m SMD cephalogram. These findings demonstrated the linear measurements accuracy and reliability of 3D measurements based on CBCT data when compared to 2D techniques. Future studies should focus on the implementation of 3D cephalometry in clinical practice.
doi:10.1093/ejo/cju036 Advance Access publication August 26, 2014
Introduction
A cephalometric analysis is a key element in orthodontic diagnostics. First introduced by Hofrath in Germany and Broadbent in the USA, this radiographic technique has been widely accepted as a stand-ard tool for orthodontic treatment planning (1, 2). Traditionally, the technique is performed on a 2D lateral cephalogram, which does not represent the full dimensions of the human face and also has disadvantages such as geometric distortion and superimposition of anatomical structures. In the past, a cephalogram with a long dis-tance between X-ray source and mid-sagittal plane of the patient’s face (3–4 m) was used. This type of machine allows more parallel X-ray beams, leading to less magnification of the images and pos-sibly less radiation dose to the patient, when paired with sensitive image receptors (3–6). Today, most of the machines on the market combine panoramic and cephalometric radiographic options within one single device. The design of these machines is more compact, which allows for a 1.5 m distance between the X-ray source and the mid-sagittal plane of the patient’s face (7).
In recent years, 3D imaging modalities, especially cone-beam computed tomography (CBCT), have played an important role in dentistry because of lower radiation doses compared to the multi-slice CT and their availability in the dental offices (8). In orthodontics, 3D images have overcome the obstacle of 2D images by allowing ortho-dontists to visualize craniofacial structures without superimposition and distortion (9–11). Several publications have shown that the accuracy of 3D measurements is good or even superior to the meas-urements performed on lateral cephalograms (12–15). However, no investigation has directly compared the measurements from both left and right sides of the images. Furthermore, no study has compared measurements on images from a traditional cephalometric device with a long source-to-mid-sagittal-plane distance (SMD).
The aim of this study was to evaluate the accuracy of linear measurements on three different imaging modalities for cephalomet-ric analysis: lateral cephalograms from a cephalometcephalomet-ric device with a 3 m SMD, lateral cephalograms from a device with a 1.5 m SMD, and 3D models from cone-beam computed tomographic data.
Materials and methods
Sample
In total, 21 dry human skulls with present upper and lower first incisors and first molars were collected from the Department of Anatomy, Hasselt University, Diepenbeek, Belgium. Mandibles were attached to the skulls by taping around them starting from the tem-poral area of one side to the other. The occlusion was fixed at the maximum intercuspation. The study protocol (reference number:
ML6960, BE322201010078) was approved by the UZ Leuven Medical Ethics Committee.
Imaging modalities
Three sets of radiographic images, two different types of lateral cepha-lograms and one CBCT, were acquired. First, lateral cephacepha-lograms of the dry skulls were taken by a 3 m SMD cephalometric machine with DX104 Comet tube (COMET, 3175 Flamatt, Switzerland; 70 kVp, 32–40 mA) at the University of Bern, Bern, Switzerland. Phosphor imaging plates, size 24 × 30 cm (Digora PCT system, Soredex, Tuusula, Finland) were used as image receptors. Second, lateral cephalograms were taken on the same samples by a digital cephalometric device with 1.5 m SMD equipped with complementary metal oxide semiconduc-tor (CMOS) sensor (Cranex® 3D, Soredex; 81 kVp, 10 mA, 16 sec-onds), which has a CMOS receptor system. The dry skulls were placed in both devices and fixed with ear rods. The Frankfort horizontal plane was adjusted to be parallel to the floor. Left and right sides were recorded by the main operator according to the anatomical structures without placing any radiopaque markers on the skulls during image acquisition. Last, CBCT scans were taken on the same skulls with a CBCT device (3D Accuitomo® 170, J. Morita, Kyoto, Japan) with the largest field of view (FOV): diameter 170 × height 120 mm (High-Fidelity/Hi-Fi mode: 90 kVp, 154 mA, voxel size: 0.25 mm). A 1.7 mm thick copper filter was attached to the machine during image acquisi-tion to simulate soft tissue attenuaacquisi-tion.
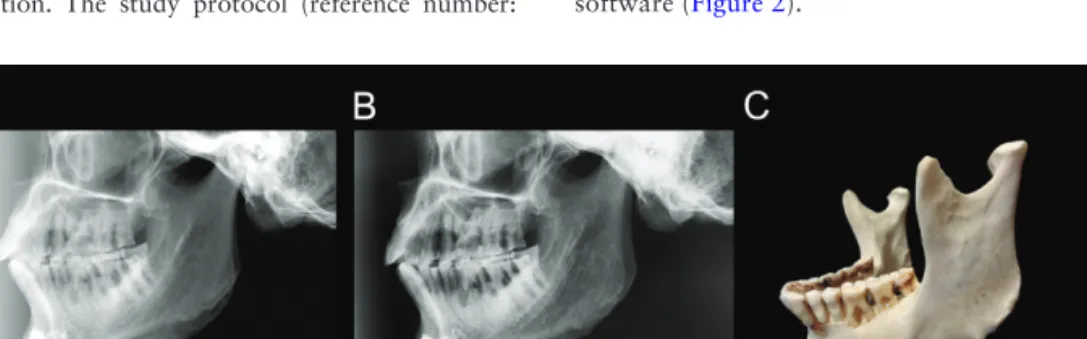
The two sets of lateral cephalograms were exported and stored in TIFF. The radiographs were then imported to Adobe® Photoshop CS4 (Adobe Systems Incorporated, San José, California, USA) and prepared for observation. A letter ‘L’ was placed on each image (both 1.5 m SMD group and 3 m SMD group) close to the angle of man-dible to indicate the left side (Figure 1). CBCT data were exported to Digital Imaging and Communications in Medicine (DICOM) then imported to Maxilim® software (Medicim NV, Sint-Niklaas, Belgium). 3D surface models were created for all samples.
Cephalometric measurements
Ten cephalometric landmarks (Table 1) resulting in a total of 13 cephalometric linear measurements were included in this study (Table 2). Linear measurements including lateral landmarks were performed on both right and left sides.
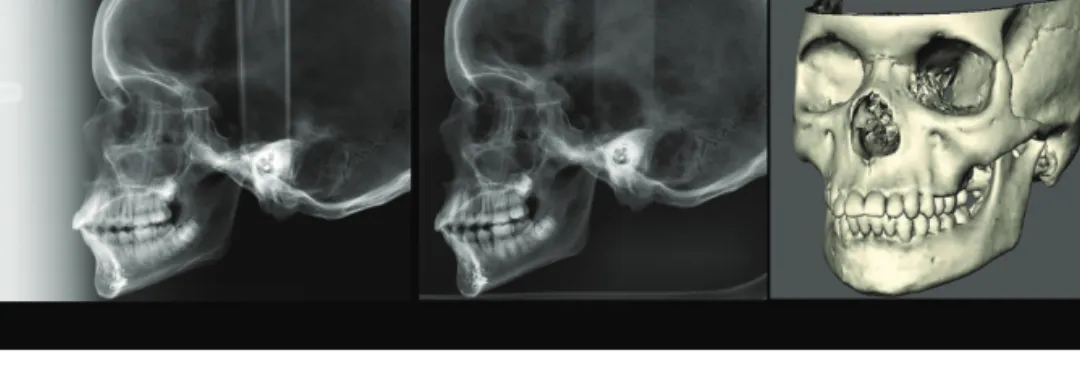
The measurements of 2D lateral cephalometric groups, 1.5 m SMD group and 3 m SMD group, were done on Adobe® Photoshop CS4 (Figure 2). The digital cephalograms were cali-brated by means of visible rulers and ear rods in the images. For the 3D group, all measurements were performed on Maxilim® software (Figure 2).
Figure 1. A letter ‘L’ was placed on the image close to the angle of the mandible to indicate the left side. (A) A lateral cephalogram from a cephalometric device
with 1.5 m source-to-mid-sagittal-plane distance (SMD). (B) A lateral cephalogram from a cephalometric device with 3 m SMD. (C) A photograph of the same mandible as on the images.
Two observers (dentomaxillofacial radiologists with more than 5 years of experience, one being the main operator) were initially cali-brated in a separate session. Detailed instructions over the landmark def-initions and software manipulation were given intensively. The observers completed each set of measurements twice with a 4 week interval. Gold standard
Direct physical measurements of all 13 measurements were done on the skulls three times by the main operator using a digital calliper (ABSOLUTE® digimatic calliper, Mitutoyo, Kawasaki, Japan) and were regarded as a gold standard.
Statistical analysis
All data were placed in excel files. Statistical analysis was performed with R 2.14 software© for Windows (R Development Core Team, ©R Foundation for Statistical Computing, Vienna, Austria).
The accuracy of the measurements was evaluated, comparing each cephalometric method with the gold standard. The measure-ment accuracy was defined as the closeness of the measured value to the gold standard value. The measurement reliability was also tested, reflecting the variability of the repeated measurements by the same or different observers.
First, the mean value of three measurements of the gold standard was calculated and the same was done for the two data sets of the two observers. Subsequently, a linear least-squares regression model was built between the gold standard and each of the cephalometric methods, and orthogonal linear regression models were used to com-pare each data set of the two cephalometric methods.
The inter- and intra-observer variability of the cephalometric methods was evaluated by means of linear mixed models. The gold standard was taken as an explanatory variable, the observer as a ran-dom factor, and the measurements obtained by the different observ-ers as dependent variables.
Results
Summary statistic was performed and the results are shown in Table 3. The biggest deviation can be observed on Go–Me (Table 3). Comparison with the gold standard
3D measurements showed statistically significant differences (P < 0.05) from the gold standard for N–A and SmN–Go left. A sta-tistically significant difference (P < 0.05) of N–A measurement was found for the 1.5 m SMD group. For lateral cephalogram with 3 m SMD, statistically significant differences (P < 0.05) were observed for N–A, N–B, N–Me, Go–Me right, Go–Me left, and Go–Co left measurements (Table 4).
Comparison between cephalometric techniques
When comparing 3D measurements with measurements on both 2D cephalograms, statistically significant differences (P < 0.05) were found for all measurements except N–ANS. When comparing between measurements on the 1.5 m SMD group and 3 m SMD group, all measurements were statistically significantly different (P < 0.05).
Observer agreement
Inter- and intra-observer variability of the 3D measurements was expressed as a percentage of coefficients of variability (CV). Inter-observer variability of 3D measurements (5.7 per cent) was lower than the other methods (6.5 per cent for 3 m SMD and 6.1 per cent for 1.5 m SMD cephalograms), which could be interpreted as a higher reproducibility for the measurements using CBCT images. For intra-observer variability, CV of 3D was shown to be between 2.4 and 3 per cent and also lower than the 2D methods (2.9–6 per cent for 3 m SMD and 3.6–4.1 per cent for 1.5 m SMD cephalograms). Therefore, the intra-observer agreement of 3D measurements was better than the two 2D measurements from both cephalometric devices.
Discussion
In the present study, the accuracy of linear measurements using three different types of imaging modalities for cephalometry was assessed
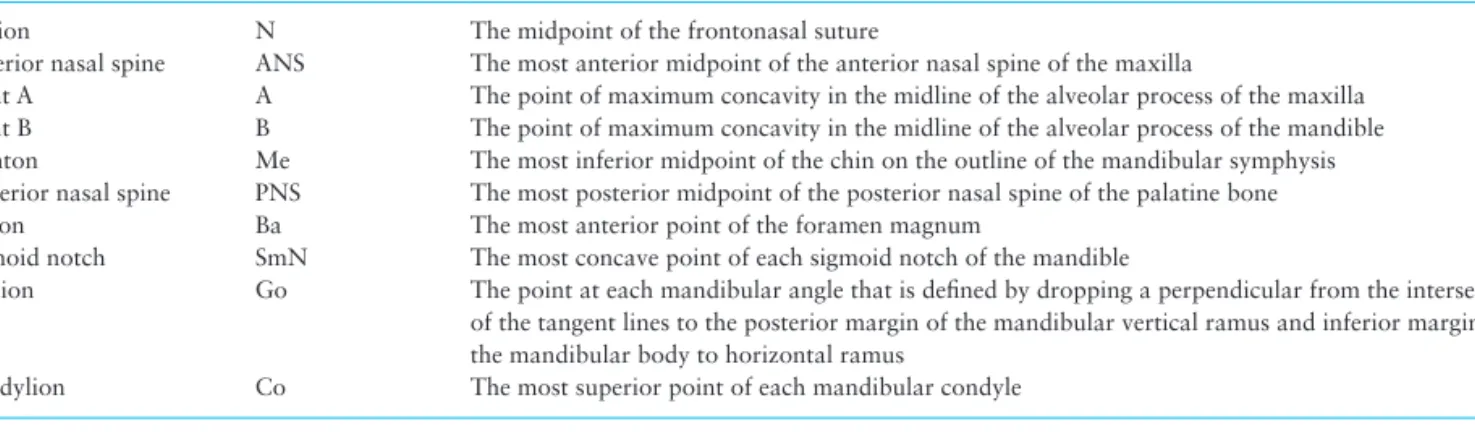
Table 1. Definition of the cephalometric landmarks used in the present study
Landmark Abbreviation Definition
Nasion N The midpoint of the frontonasal suture
Anterior nasal spine ANS The most anterior midpoint of the anterior nasal spine of the maxilla
Point A A The point of maximum concavity in the midline of the alveolar process of the maxilla Point B B The point of maximum concavity in the midline of the alveolar process of the mandible Menton Me The most inferior midpoint of the chin on the outline of the mandibular symphysis Posterior nasal spine PNS The most posterior midpoint of the posterior nasal spine of the palatine bone Basion Ba The most anterior point of the foramen magnum
Sigmoid notch SmN The most concave point of each sigmoid notch of the mandible
Gonion Go The point at each mandibular angle that is defined by dropping a perpendicular from the intersection of the tangent lines to the posterior margin of the mandibular vertical ramus and inferior margin of the mandibular body to horizontal ramus
Condylion Co The most superior point of each mandibular condyle
Table 2. Definition of the cephalometric linear measurements
performed in the present study Linear measurement Definition
N–ANS Distance in mm between N and ANS N–A Distance in mm between N and A N–B Distance in mm between N and B N–Me Distance in mm between N and Me ANS–Me Distance in mm between ANS and Me ANS–PNS Distance in mm between ANS and PNS Ba–PNS Distance in mm between Ba and PNS SmN–Go (right and left) Distance in mm between SmN and Go
of each side
Go–Co (right and left) Distance in mm between Go and Co of each side
Go–Me (right and left) Distance in mm between Go and Me of each side
and comparisons of measurements among the techniques were per-formed. Although there are several publications that have evaluated the accuracy and compared measurements between 2D and 3D imaging techniques, there is, to the best of our knowledge, no publi-cation in English that included cephalograms from a 3 m source-to-image-receptor distance.
Dry human skulls were used as in vitro subjects in this study to account for the fact that several different imaging modalities had to be taken on the same samples, and thus, it was unethical to use patients for this type of study. Although the skulls could not repre-sent real human anatomy including soft tissues, this model offered some advantages. Direct measurements on hard tissue were possible unlike using real human subjects, and these were later used as gold standard. A 1.7 mm thick copper filter was used to mimic soft tissue attenuation during image acquisition to prevent any overexposures.
Cephalometric landmarks selected for this study included mid-line landmarks and lateral landmarks, both on the right and left side. Although only one measurement will be used for a lateral cephalo-gram in clinical situations, measurements of both sides were used in the present investigation in order to directly compare 3D with 2D measurements. No fiducial marker was placed prior to image
acquisition. This was done in order to mimic the real clinical situa-tion, as landmark identification is one of the variables affecting the intra- and inter-observer agreement. With marker placement in an experiment, this clinical observer bias might be largely eliminated.
Considering the imaging modalities used in the present study, 2D and 3D images are different in nature. 2D imaging systems, in this study the lateral cephalograms, are based on projecting shadows of anatomical structures on the image receptors. In 2D, structures aligned obliquely to the image receptor will result in distorted shad-ows on lateral cephalograms. These shadshad-ows are usually measured and used for cephalometric analysis. In this study, the effect of the SMD distance of two devices was evaluated, yet another factor that might influence magnification of 2D cephalometric radiographs is the distance from the mid-sagittal plane to the image receptor. In the current experimental set-up, both machines had a very similar 15 cm distance from the mid-sagittal plane to the image receptor, minimiz-ing this secondary magnification bias.
On the other hand, for the 3D modality (CBCT), the image data were acquired and quantified in voxels, forming a realistic volume, which is definitely different from the 2D projection. This is one of the biggest advantages of 3D over the 2D imaging as it can capture
Figure 2. Examples of images from all radiographic devices used in the present study: (A) lateral cephalogram from a cephalometric device with 1.5 m
source-to-mid-sagittal-plane distance (SMD) with a visible ruler that was used for image calibration; (B) lateral cephalogram from a cephalometric device with 3 m SMD. In this image, the diameter of the ear rod was used for image calibration; (C) 3D surface model constructed from CBCT data, viewed on Maxilim® software. 3D measurements were performed by placing digital landmarks on the model. Subsequently, the software calculated the preset linear measurements and the values were recorded.
Table 3. Summary statistics showing the results of the cephalometric measurements (in mm) of the three radiographic modalities and the
gold standard: a deviation of more than 5 mm from the gold standard was found for measurements on 2D lateral cephalograms, involving both midline and lateral landmarks (Go–Me). Ave, average; Max, maximum; Min, minimum; SD, standard deviation; SMD, source-to-mid-sagittal-plane distance
Measurements
Gold standard 3 m SMD group 1.5 m SMD group 3D group
Ave SD Min Max Ave SD Min Max Ave SD Min Max Ave SD Min Max N–ANS 44.95 3.66 37.70 50.94 43.99 3.55 36.45 51.13 44.48 3.59 36.75 52.09 45.42 3.66 37.40 52.30 N–A 50.15 4.51 41.53 58.10 48.10 3.70 40.28 56.74 48.97 3.84 40.44 55.82 49.98 4.02 41.90 57.30 N–B 86.78 7.95 70.49 99.55 83.74 7.12 68.38 97.20 85.06 7.55 69.77 99.24 85.35 7.70 69.30 100.00 N–Me 103.97 10.32 86.08 122.47 102.39 9.80 84.14 121.29 103.49 10.05 84.90 122.65 104.43 9.94 85.70 122.60 ANS–Me 60.74 7.64 47.91 73.66 60.00 7.35 46.04 73.98 60.81 7.60 47.18 74.61 60.46 7.48 47.00 74.70 ANS–PNS 48.07 2.68 43.57 53.85 44.98 2.89 39.88 53.56 47.12 2.89 41.74 53.03 47.28 2.85 41.70 53.30 Ba–PNS 40.73 3.46 34.73 47.42 42.02 6.02 34.79 73.53 41.93 3.73 34.32 52.04 41.08 3.41 35.20 47.90 SmN–Go right 38.13 5.31 27.92 47.31 36.66 6.25 25.03 67.02 36.56 5.02 26.28 47.08 37.89 5.14 27.20 47.60 SmN–Go left 38.81 5.20 28.25 48.83 37.51 6.09 24.85 67.02 38.96 5.93 27.85 61.24 37.70 4.94 27.60 47.70 Go–Co right 51.54 6.00 37.86 59.44 48.12 6.10 36.74 59.60 49.45 5.81 36.65 61.04 50.56 6.01 35.10 60.50 Go–Co left 52.52 6.65 38.69 64.37 49.12 5.94 36.74 62.89 51.51 6.67 37.34 66.47 50.16 6.31 33.90 61.70 Go–Me right 77.71 6.43 64.52 88.83 62.80* 5.61 49.65 75.97 64.17* 5.86 52.84 75.92 77.86 6.94 62.80 92.20 Go–Me left 76.70 6.43 63.42 88.82 61.89* 5.43 49.89 75.18 63.56* 6.19 49.66 75.95 77.86 7.10 62.80 95.70
structures with their real dimensional relationship. As a result, 3D image data, representing anatomical structures without any geomet-ric distortion, can be measured. The linear distances in this study were defined as direct distances on 3D models, not orthogonal distances or distances created by projecting a 3D structure on a plane, which is the principle of 2D lateral cephalography. The pur-pose of this study design was to compare the measurements on 2D and 3D imaging modalities using their full capacity. Thus, a com-parison of measurements by creating 2D projections from 3D data was avoided. Therefore, measurements with lateral landmarks are expected to exhibit the most pronounced differences between 2D and 3D imaging, which was demonstrated by Go–Me values on lat-eral cephalograms that significantly deviated from the gold standard and 3D measurements in the present study.
For the accuracy evaluation, it was found that the accuracy of measurements on 3 m SMD cephalograms was lower than the other two groups with six measurements exhibiting statistically significant differences when compared to the gold standard (Table 3). There was no English publication found to directly compare the results of the present study, but it was found in a few publications that the accuracy of 3D measurements was better than measurements on lat-eral cephalograms (16–18). In 2010, Varghese et al. (16) published results on the accuracy of CT and digital cephalometric measure-ments. The results showed that the accuracy of CT measurements was better than the 2D lateral cephalograms. Olmez et al. (17) found that there were no significant differences between the computer-assisted 3D and physical measurements, while the 2D measurements showed significant differences when compared to the physical meas-urements. Gribel et al. (18) investigated the accuracy and reliability of measurements on lateral cephalograms and CBCT. No statisti-cally significant difference was found between CBCT measurements and the gold standard. However, for the lateral cephalograms, all measurements were statistically significantly different from the gold standard (18).
N–A was the only measurement that was statistically signifi-cantly different from the gold standard for all types of imaging tech-niques. This can be explained from previous studies published on landmark identification. It has been demonstrated in other investiga-tions that point A (Table 1) was less reliable in terms of landmark identification (19–22). The position of the landmark situated on a
curved surface such as the concavity of the alveolar process for point A may affect the accuracy of the identification more than a landmark situated on a small pointed area like ANS (19). This surely affected the accuracy of linear measurements in this study, when one of the landmarks was less reliable and more difficult to define or prone to subjectivity. Interestingly, Perillo et al. (20) stated that the lack of precision in identification of landmarks may not, on average, pre-clude cephalometric diagnosis.
It was speculated at the beginning of the study that measure-ments involving both a midline landmark (Me) and a lateral land-mark (Go) would result in a statistically significant difference when compared to the gold standard. However, the results of the present study showed significant differences only for the 3 m SMD cepha-lometric group, but not for the 1.5 m SMD group. Table 3 shows deviations of the measurements of the 1.5 m SMD group from the gold standard values, but when the regression model was applied, the results were not statistically significant except for the N–A meas-urements (Table 4).
The comparison of all techniques with each other showed signifi-cant differences in almost all measurements in all pairs of techniques. This could mean that although the measurements were accurate when comparing to the gold standard, the measurements were actu-ally significantly different when comparing between the techniques. As shown in Table 3, some measurements including the lateral land-marks were highly deviated among cephalometric techniques, but when compared to the gold standard, the result was not statistically significantly different.
The results of the 3 m SMD cephalometric group were rather unexpected because the system should have provided a less to none magnified lateral cephalogram; thus, the midline measurements should have been close to those obtained from gold standard physical measurements. One reason that could help explain this circumstance was the quality of the phosphor imaging plate. From the exposure parameter applied to the device, it did not give the image optimal brightness, contrast, and sharpness. This might have affected the landmark identification process. The images were calibrated prop-erly by using the diameter of the ear rod as a reference—so this could be excluded as a possible factor affecting the measurement values.
The results of this study showed that the observer agreement of measurements on 3D models was slightly superior to the agreement
Table 4. Comparison of linear measurements using radiographic data with the gold standard: statistically significant differences (defined
as P < 0.05) of N–A were observed for all modalities. The measurements of the 3 m source-to-mid-sagittal-plane distance (SMD) group showed more significant differences than the other two imaging groups
Measurements
3 m SMD group 1.5 m SMD group 3D group
P value of intercept P value of slope P value of intercept P value of slope P value of intercept P value of slope
N–ANS 0.624 0.361 0.588 0.453 0.57 0.696 N–A 0.004* 0.001* 0.014* 0.006* 0.028* 0.026* N–B 0.065 0.01* 0.163 0.08 0.496 0.327 N–Me 0.2 0.038* 0.323 0.261 0.13 0.193 ANS–Me 0.51 0.199 0.424 0.439 0.994 0.735 ANS–PNS 0.607 0.813 0.504 0.4 0.243 0.376 Ba–PNS 0.522 0.672 0.227 0.346 0.534 0.789 SmN–Go right 0.547 0.333 0.519 0.175 0.202 0.163 SmN–Go left 0.405 0.253 0.706 0.668 0.141 0.04* Go–Co right 0.797 0.298 0.606 0.295 0.748 0.51 Go–Co left 0.091 0.017* 0.486 0.354 0.364 0.099 Go–Me right 0.98 0.006* 0.598 0.056 0.209 0.195 Go–Me left 0.664 0.003* 0.611 0.166 0.242 0.158 *P < 0.05.
of measurements on 2D lateral cephalograms, regardless of the type of the cephalometric device. This finding was in line with results pub-lished by previous studies. A study done by Gribel et al. (18) showed that measurements on 3D images [intraclass correlation coefficient (ICC) = 0.99] were as reliable as the measurements on 2D images (ICC = 0.98). On the other hand, Damstra et al. found the ICC of the 2D measurements on lateral cephalograms (ICC > 0.97) to be higher than the ICC of 3D measurements (ICC > 0.88), but there was no statistically significant difference between the two methods (23).
In a study by van Vlijmen et al. (24), the result was in the opposite direction to the present study. It was found that the intra-observer reliability of the measurements on the conventional cephalometric radiographs was higher compared with the intra-observer reliability of measurements on the 3D models. The authors suggested two fac-tors possibly affecting the results: the learning curve in 3D tracing and the added third dimension of the image (24). In the present study, an intensive calibration of the observers was performed prior to the measurements, in order to be familiar with the software and landmark definition both in 2D and 3D. The results were therefore improved.
The results of the present investigation showed that inter-observer agreement is lower than the intra-observer agreement. This was expected, as observer performance can be affected by several factors such as background experiences, the familiarity of the observers to the software, and the ability to identify landmarks according to the definitions. A calibration session was conducted prior to the obser-vation to minimize the effect of these factors.
To acquire CBCT images on real patients, dental CBCT exami-nations should be fully justified over conventional X-ray imaging and dose optimization by FOV collimation and low dose settings should be achieved (8, 25). Large FOV CBCTs should be used only when full indication and justification for the benefit of the patient is applied, as the radiation dose received from the CBCTs is strongly related to FOV size and also dependent on the specific CBCT machine (8). Recent guidelines on orthodontic use of CBCT imaging were published by the American Academy of Oral and Maxillofacial Radiology (26). Furthermore, guidelines and recom-mendations on CBCT use for dental and maxillofacial radiology have been made available by the European Commission to offer clinicians and orthodontists some guidance and recommendations (27). In general, the selection of radiographic imaging should be based on initial clinical evaluation and must be justified based on individual need without being considered ‘routine’ (26, 28). Especially when treating children and young adults, the decision to perform a CBCT examination must be based on the patient’s his-tory, clinical examination, available radiographic imaging, and the presence of a clinical condition for which the benefits of the diag-nosis and/or treatment plan outweigh the potential risks of expo-sure to radiation (26, 28). Therefore, 3D cephalometric analysis and 3D orthodontic treatment planning should only be performed when their benefits to the patients in specific cases can overcome the radiation risk.
Conclusions
This study has confirmed the knowledge on the accuracy of linear cephalometric measurements of 2D and 3D images. Although the results did not show that 3D measurements were more accurate than the 2D standard digital lateral cephalograms (1.5 m SMD), the results did confirm that 3D measurements were more reliable than measurements on 2D images.
Funding
Interfaculty Council for Development Co-operation (IRO).
Acknowledgements
The authors would like to thank Dr K. Rovaris who participated in the obser-vations and Dr K. Dula for his expert advice.
References
1. Hofrath, H. (1931) Bedeutung der Röntgenfern und Abstands Aufnahme für die Diagnostik der Kieferanomalien. Fortschritte der Orthodontie, 1, 231–258.
2. Broadbent, B.H. (1931) A new x-ray technique and its application to orthodontia. Angle Orthodontist, 1, 45–66.
3. Bourriau, J., Bidange, G. and Foucart, J.M. (2012) Les erreurs de mesure en céphalométrie 2D. L'Orthodontie Française, 83, 23–36.
4. Jacobs, R. and Velders, X.L. (1997) Pre-implantair röntgendiagnostiek. In: Bakker J. and Guyt J. (Eds.), Handboek voor Tandheelkundige Praktijk. The Netherlands: Bohn Stafleu van Loghum.
5. Gijbels, F., Sanderink, G., Wyatt, J., Van Dam, J., Nowak, B. and Jacobs, R. (2003) Radiation doses of collimated vs non-collimated cephalometric exposures. Dentomaxillofacial Radiology, 32, 128–133.
6. Gonzalez, L., Fernandez, R., Ziraldo, V. and Vano, E.R. (2004) Reference level for patient dose in dental skull lateral teleradiography. British Journal of Radiology, 77, 735–739.
7. Proffit, W.R., Fields, H.W., Jr and Sarver, D.M. (2007) Contemporary Orthodontics. Mosby Elsevier, St. Louis, MO, 4th edn.
8. Pauwels, R., et al. (2012) Effective dose range for dental cone beam com-puted tomography scanners. European Journal of Radiology, 81, 267– 271.
9. Mah, J.K., Huang, J.C. and Choo, H. (2010) Practical applications of cone-beam computed tomography in orthodontics. Journal of the Ameri-can Dental Association, 141, 7S–13S.
10. van Vlijmen, O.J., Kuijpers, M.A., Berge, S.J., Schols, J.G., Maal, T.J., Bre-uning, H. and Kuijpers-Jagtman, A.M. (2012) Evidence supporting the use of cone-beam computed tomography in orthodontics. Journal of the American Dental Association, 143, 241–252.
11. Kau, C.H., Richmond, S., Palomo, J.M. and Hans, M.G. (2005) Three-dimensional cone beam computerized tomography in orthodontics. Jour-nal of Orthodontics, 32, 282–293.
12. Periago, D.R., Scarfe, W.C., Moshiri, M., Scheetz, J.P., Silveira, A.M. and Farman, A.G. (2008) Linear accuracy and reliability of cone beam CT derived 3-dimensional images constructed using an orthodontic volumet-ric rendering program. Angle Orthodontist, 78, 387–395.
13. Brown, A.A., Scarfe, W.C., Scheetz, J.P., Silveira, A.M. and Farman, A.G. (2009) Linear accuracy of cone beam CT derived 3D images. Angle Orthodontist, 79, 150–157.
14. Pittayapat, P., Limchaichana-Bolstad, N., Willems, G. and Jacobs, R. (2014) Three-dimensional cephalometric analysis in orthodontics: a sys-tematic review. Orthodontics and Craniofacial Research, 17, 69–91. 15. Cavalcanti, M.G., Rocha, S.S. and Vannier, M.W. (2004) Craniofacial
measurements based on 3D-CT volume rendering: implications for clini-cal applications. Dentomaxillofacial Radiology, 33, 170–176.
16. Varghese, S., Kailasam, V., Padmanabhan, S., Vikraman, B. and Chithranjan, A. (2010) Evaluation of the accuracy of linear measurements on spiral computed tomography-derived three-dimensional images and its comparison with digital cephalometric radiography. Dentomaxillofacial Radiology, 39, 216–223. 17. Olmez, H., Gorgulu, S., Akin, E., Bengi, A.O., Tekdemir, I. and Ors, F.
(2011) Measurement accuracy of a computer-assisted three-dimensional analysis and a conventional two-dimensional method. Angle Orthodon-tist, 81, 375–382.
18. Gribel, B.F., Gribel, M.N., Frazao, D.C., McNamara, J.A., Jr and Manzi, F.R. (2011) Accuracy and reliability of craniometric measurements on lat-eral cephalometry and 3D measurements on CBCT scans. Angle Ortho-dontist, 81, 28–37.
19. Baumrind, S. and Frantz, R.C. (1971) The reliability of head film measurements. 1. Landmark identification. American Journal of Orthodontics, 60, 111–127. 20. Perillo, M., Beideman, R., Shofer, F., Jacobsson-Hunt, U., Higgins-Barber,
K., Laster, L. and Ghafari, J. (2000) Effect of landmark identification on cephalometric measurements: guidelines for cephalometric analyses. Clini-cal Orthodontics and Research, 3, 29–36.
21. Kazandjian, S., Kiliaridis, S. and Mavropoulos, A. (2006) Validity and reliability of a new edge-based computerized method for identification of cephalometric landmarks. Angle Orthodontist, 76, 619–624.
22. Chien, P.C., Parks, E.T., Eraso, F., Hartsfield, J.K., Roberts, W.E. and Ofner, S. (2009) Comparison of reliability in anatomical landmark identification using two-dimensional digital cephalometrics and three-dimensional cone beam computed tomography in vivo. Dentomaxillofacial Radiology, 38, 262–273. 23. Damstra, J., Fourie, Z. and Ren, Y. (2011) Comparison between two-dimensional and midsagittal three-two-dimensional cephalometric measure-ments of dry human skulls. British Journal of Oral and Maxillofacial Sur-gery, 49, 392–395.
24. van Vlijmen, O.J., Maal, T., Berge, S.J., Bronkhorst, E.M., Katsaros, C. and Kuijpers-Jagtman, A.M. (2010) A comparison between 2D and 3D
cepha-lometry on CBCT scans of human skulls. International Journal of Oral & Maxillofacial Surgery, 39, 156–160.
25. Theodorakou, C., Walker, A., Horner, K., Pauwels, R., Bogaerts, R., Jacobs, R. and Consortium, S.P. (2012) Estimation of paediatric organ and effective doses from dental cone beam CT using anthropomorphic phantoms. British Journal of Radiology, 85, 153–160.
26. American Academy of Oral and Maxillofacial Radiology (2013) Clini-cal recommendations regarding use of cone beam computed tomography in orthodontic treatment. Position statement by the American Academy of Oral and Maxillofacial Radiology. Oral Surgery, Oral Medicine, Oral Pathology, Oral Radiology, 116, 238–257.
27. European Commission (2012) Guidelines on CBCT for dental and maxil-lofacial radiology: evidence based guidelines: radiation protection publi-cation. http://www.sedentexct.eu/content/guidelines-cbct-dental-and-max-illofacial-radiology (8 June 2014, date last accessed).
28. American Dental Association Council on Scientific Affairs (2012) The use of cone-beam computed tomography in dentistry: an advisory statement from the American Dental Association Council on Scientific Affairs. Jour-nal of the American Dental Association, 143, 899–902.