Public Health Nutrition: 17(9), 1975–1983 doi:10.1017/S1368980013002401
Complementary feeding and attained linear growth among
6–23-month-old children
Adelheid W Onyango
1,*, Elaine Borghi
1, Mercedes de Onis
1,
Ma del Carmen Casanovas
1and Cutberto Garza
21Department of Nutrition for Health and Development, World Health Organization, 20 Avenue Appia, 1211 Geneva 27, Switzerland:2Boston College, Chestnut Hill, MA, USA
Submitted 25 September 2012: Final revision received 24 May 2013: Accepted 25 July 2013: First published online 19 September 2013
Abstract
Objective: To examine the association between complementary feeding indica-tors and attained linear growth at 6–23 months.
Design: Secondary analysis of Phase V Demographic and Health Surveys data (2003–2008). Country-specific ANOVA models were used to estimate effects of three complementary feeding indicators (minimum meal frequency, minimum dietary diversity and minimum adequate diet) on length-for-age, adjusted for covariates and interactions of interest.
Setting: Twenty-one countries (four Asian, twelve African, four from the Americas and one European).
Subjects: Sample sizes ranging from 608 to 13 676.
Results: Less than half the countries met minimum meal frequency and minimum dietary diversity, and only Peru had a majority of the sample receiving a minimum adequate diet. Minimum dietary diversity was the indicator most consistently asso-ciated with attained length, having significant positive effect estimates (ranging from 0?16 to 1?40 for length-for-age Z-score) in twelve out of twenty-one countries. Length-for-age declined with age in all countries, and the greatest declines in its Z-score were seen in countries (Niger, 21?9; Mali, 21?6; Democratic Republic of Congo, 21?4; Ethiopia, 21?3) where dietary diversity was persistently low or increased very little with age.
Conclusions: There is growing recognition that poor complementary feeding contributes to the characteristic negative growth trends observed in developing countries and therefore needs focused attention and its own tailored interven-tions. Dietary diversity has the potential to improve linear growth. Using four food groups to define minimum dietary diversity appears to capture enough information in a simplified, standard format for multi-country comparisons of the quality of complementary diets.
Keywords Infant and young child feeding
indicators Complementary feeding Dietary diversity Linear growth
Linear growth falters dramatically in developing countries
between early infancy and the end of the second year(1).
Variable factors are responsible for the decline in growth indicators, among them is complementary feeding (CF) that may be inadequate in quantity and/or quality relative to children’s energy and nutrient needs, or that may be
the conduit of infectious agents and toxins(2–6). Given
the long-term consequences of poor linear growth in the first two years, it is imperative that interventions are implemented to break the cycle that leads to successive generations of short adults with increased risk of CVD and
low economic productivity, among other problems(7).
Various agencies attempting to address feeding-related causes of suboptimal growth in developing countries have defined a set of indicators for assessing infant and
young child feeding (IYCF) practices(8). The indicators
could be used in quantifying relationships between key dimensions of feeding and growth among children below 2 years of age. A recent analysis of Demographic and Health Surveys (DHS) data from forty-six countries found population-level associations between IYCF indicators and levels of malnutrition. Compared with Latin America, Asia and Africa had higher prevalences of undernutrition and lower prevalences of exclusive breast-feeding, of
adequate dietary diversity and overall dietary quality(9).
With specific reference to the age range of CF, the pro-portion of children aged 6–23 months who received a minimum acceptable diet was 16 % in Africa and 26 % in Asia compared with 43 % in the Americas.
Over the years different approaches have been used to create indicators of dietary diversity and study its asso-ciation with child undernutrition. For example, prior to
*Corresponding author: Email [email protected] rThe Authors 2013
https:/www.cambridge.org/core/terms. https://doi.org/10.1017/S1368980013002401
the publication of the IYCF indicators(8), Ruel and Menon
(2002)(10) created a child feeding index using 24 h and
7 d recall data in seven Latin American surveys. They found significant associations between CF practices and height-for-age Z-scores. Similarly, Arimond and Ruel
(2004)(4) analysing DHS data from eleven countries
created a dietary diversity score based on seven food groups and found that it was positively associated with height-for-age in nine of the countries. In a rural
Bangladesh study, Rah et al. (2010)(11) constructed a
dietary diversity score by summing the number of days each of nine food groups was consumed in the previous week. They found that reduced dietary diversity was a strong predictor of stunting. The WHO IYCF indicators have more recently been studied in DHS data from fourteen
low-income countries(12). The data from all fourteen countries
were pooled and analyses were performed for disaggregated age groups for each of the indicators. The risk of both stunting and underweight was reduced with consumption of a minimum acceptable diet and minimum dietary diversity, while minimum meal frequency was associated with a lower risk of underweight only. Similar analyses for Cambodia (DHS 2005) had been carried out by the same authors in 2010, but examining a single composite variable for
com-pliance with all age-relevant feeding indicators(13).
The present analysis will add to the body of literature on child feeding practices in association with linear growth in the age period 6–23 months. Using twenty-one DHS data sets, the present analyses focus on a sub-set of the WHO IYCF indicators. We compare the relative strengths of the association between length-for-age and three CF indicators.
Methods
The current analysis uses data from Phase V DHS carried out between 2003 and 2008, for which CF indicator data
and stunting prevalence estimates were available.
Twenty-one data sets had the required data for the pro-posed analysis: four from Asia (Bangladesh, Cambodia, India and Nepal); twelve from Africa (Benin, Democratic Republic of Congo (DRC), Egypt, Ethiopia, Ghana, Liberia, Mali, Namibia, Niger, Uganda, Zambia and Zimbabwe); four from the Americas (Dominican Republic, Haiti, Honduras and Peru); and one from Europe (Azerbaijan). We always used the latest versions of the data sets available on the DHS website. Since the focus of the analysis is CF, only data for children aged 6 to 23 months were used. Several variables (age, sex, length, mother’s height, mother’s age, mother’s education, wealth index and rural/urban residence) expected to be related with growth status in the age range of interest were extracted from the DHS data files, as were descriptors of CF from reported 24 h consumption by children of specific foods and liquids, and their breast-feeding (BF) status.
For the analysis, we recalculated children’s exact age in months (number of days from day of birth to day of measurement divided by 30?4375). Consequently, the sample sizes may vary somewhat from those presented in other reports using the same DHS data, where age calculation by the century month code classifies some children in higher age categories of completed months if they were born late in a given month and are measured early in another month.
A binary code was created for current BF status. We included both breast-fed and non-breast-fed children when deriving the IYCF indicators. Binary variables indicating whether a child’s CF met the requirements of minimum dietary diversity and minimum meal frequency were
derived in accordance with the IYCF indicator definitions(8).
However, whereas according to the standard indicator definitions at least two milk feeds are required for milk to count towards minimum acceptable diet for non-breast-fed children, in the present analysis any milk feed was counted because the number of feeds is not recorded in DHS Phase V. For Bangladesh, we recovered a variable reporting consumption of goat’s milk and included it in the diversity count as a dairy food.
Attained linear growth, namely length-for-age Z-score
(LAZ) based on the WHO child growth standards(14), was
calculated for use as the primary outcome for the analyses presented in this paper. Extreme LAZ values, i.e. beyond the interval 26 and 16, were flagged and excluded follow-ing standard practice when calculatfollow-ing Z-scores in the WHO
Anthro software(15).
Descriptive summary statistics for each country are based on weighted analysis using DHS sampling weights. However, for assessing associations between linear growth and dietary factors at child level, the analysis was un-weighted.
ANOVA was carried out separately for each country considering that, for example, wealth quintiles in Azerbaijan and Mali are not comparable in absolute terms. LAZ was treated as dependent variable and the IYCF indicators – minimum dietary diversity, minimum meal frequency and current BF – as independent variables, adjusted by the following covariates: child’s age and sex; mother’s height, age and education (none, primary, secondary and higher); wealth index quintiles (as defined in respective DHS data
sets(16)); and rural/urban residence. The CF indicator
of minimum acceptable diet is a composite of minimum dietary diversity and minimum meal frequency. Therefore, a set of models was evaluated to compare the effects of the composite variable v. the disaggregated components (please note that the term ‘effects’ refers to the difference in adjusted means associated with different levels of the factor of interest in ANOVA). Possible interactions between factors of interest also were investigated. Covariate age was categorized into four groups: 6–8, 9–11, 12–17 and 18–23 completed months, and interactions with minimum dietary diversity and current BF status were examined.
Separate ANOVA models were run for each country, beginning with the full list of CF factors, interactions of interest and the covariates described above. Model selection proceeded by the backward stepwise approach. Non-significant dietary factors and interactions (P $ 0?05) were eliminated, except where a non-significant factor was involved in a significant interaction with another variable. All covariates were retained in the models regardless of their statistical significance.
For a detailed exploration of interrelationships between diet diversity and increased stunting with age, each sample was stratified into three length-for-age categories: LAZ,22, LAZ 5 22 to ,21 and LAZ $ 21, and age-related patterns were examined.
Analyses were done using the SAS statistical software package version 9?2 and the S-Plus statistical software package version 8?2. Statistical significance at P , 0?05 is reported.
Results
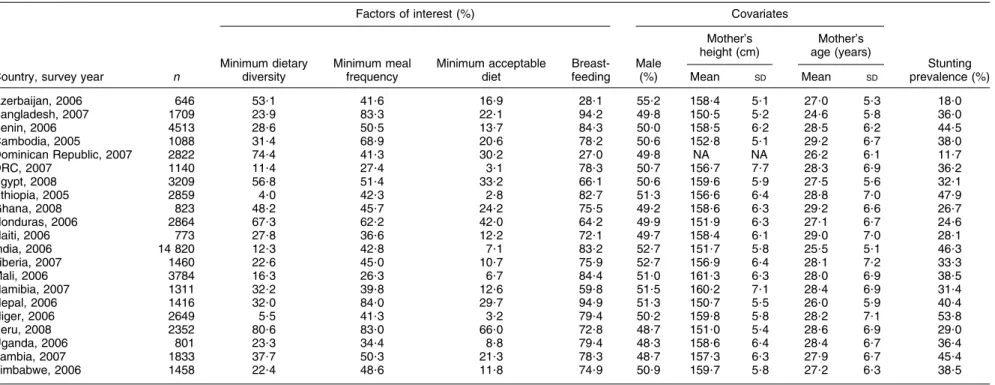
Table 1 presents basic descriptive information for each of the twenty-one countries, with sample sizes ranging from 646 to 14 820. Five countries had at least half of the sample receiving the minimum dietary diversity, namely Azerbaijan (53?1 %), Egypt (56?8%), Honduras (67?3 %), Dominican Republic (74?4 %) and Peru (80?6 %). At the opposite extreme were Ethiopia (4?0 %), Niger (5?5 %), DRC (11?4 %), India (12?3 %) and Mali (16?3 %). Although minimum meal frequency was generally better assured than dietary diversity, less than half of the sample in Azerbaijan, Dominican Republic, Haiti, India and in all sub-Saharan African countries achieved minimum meal frequency. Considering the composite measure encom-passing dietary diversity and meal frequency, only in Peru did the majority of the sample (66?0 %) receive a minimum acceptable diet, while coverage in the rest ranged from 42?0 % in Honduras to just 2?8 % in Ethiopia, 3?1 % in DRC and 3?2 % in Niger.
Proportions of children currently breast-fed ranged between 28 % and 95 % overall, with marked age-related differences, as expected (data not shown). For children aged 6–18 months, all but four countries (Azerbaijan, Dominican Republic, Honduras and Namibia) had BF rates of over 80 %. At 18–23 months, less than one-sixth of the samples in Azerbaijan and Dominican Republic, and about one-third in Egypt, Namibia and Zimbabwe, were breast-fed, as were 50 % or less in Ghana, Honduras, Haiti, Liberia, Peru and Zambia, compared with majorities in the remaining ten countries, including 89?2 % in Bangladesh and 89?9 % in Nepal. The gender distribution in the samples was about even with the most variant being Azerbaijan (55?2 % male) and Uganda (48?3 % male). Maternal heights segregated into two distinct groups, with six countries averaging 151–153 cm and the remaining
countries clustering in the 157–161 cm bandwidth. The Dominican Republic data set was missing mother’s height. Stunting rates ranged from 11?7 % (Dominican Republic) to 53?8 % (Niger). There was a clear negative correlation between minimum dietary diversity and stunting (simple
linear regression slope 20?35, R2558 %). Countries were
clustered in two blocks: those with minimum dietary diversity rates below 40 % and stunting rates of 30 % or above (fifteen countries), and those with minimum dietary diversity above 40 % and stunting rates below 30 %. The exception was Egypt, with stunting rate of 32?1 % and minimum dietary diversity rate of 56?8 %.
Minimum acceptable diet yielded mostly non-significant results in the alternative models where it was tested in place of dietary diversity and meal frequency as separate variables (data not shown). Significant effect estimates were found in six countries: Bangladesh (6–9 months and 18–23 months), Honduras (18–23 months), and India, Cambodia, Nepal and Zambia (6–23 months). In all countries but Zambia, minimum dietary diversity was associated with greater differences in LAZ compared with minimum acceptable diet. We therefore used the two separate indicators of dietary diversity and meal fre-quency in all subsequent analyses.
Table 2 summarizes dietary factors and interactions retained in the final models for each country. Mini-mum dietary diversity and current BF each had significant effect estimates in twelve out of twenty-one countries. Conversely, minimum meal frequency had statistically significant effect estimates in only four countries (0?08 LAZ in India, 0?19 in Zambia, 0?24 in Ethiopia and 20?25 in Zimbabwe). The interaction between age and mini-mum dietary diversity was significant in seven countries (Bangladesh, DRC, Egypt, Ghana, Honduras, Niger and Uganda), between age and current BF in three countries (India, Liberia and Uganda), and between minimum dietary diversity and current BF in two countries (DRC and Peru).
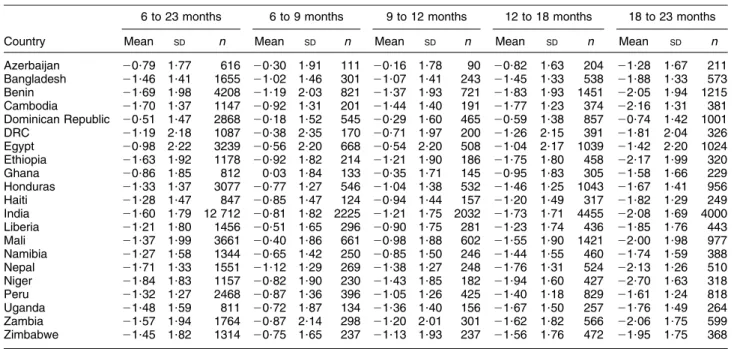
The change in LAZ through age categories was consis-tent across countries: the highest average LAZ values were observed in the youngest category (6–9 months), followed by systematic downward trends to the end of the second year (Table 3). The countries where mean LAZ originated close to the standard median at 6–9 months were Ghana (10?03), Dominican Republic (20?18), DRC (20?38) and Mali (20?40). On the other hand, the sam-ples in Bangladesh, Benin and Nepal already had at 6–9 months mean LAZ,21. By the end of the second year, the average child in Benin, Cambodia, Ethiopia, India, Nepal, Niger and Zambia was stunted (mean LAZ,22).
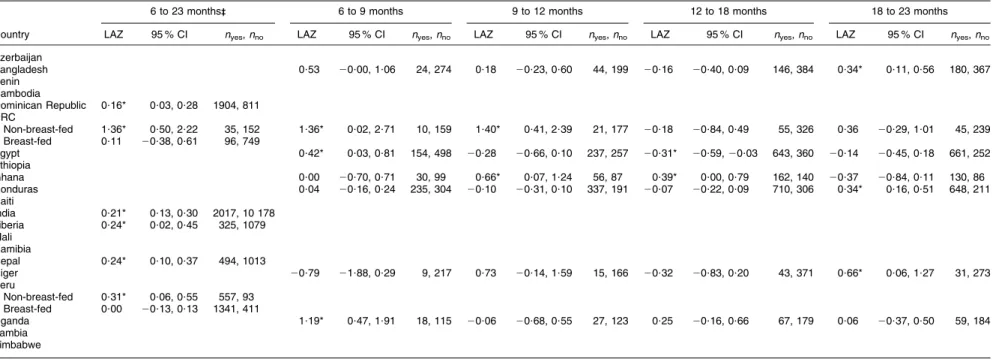
Dietary diversity was the CF factor most consistently associated with length-for-age as highlighted in Table 4, which presents dietary diversity effect estimates as mean differences in LAZ between children receiving the mini-mum diet diversity and those who did not, adjusted by the standard set of covariates described earlier. Where the
Complementary feeding and linear growth 1977
https:/www.cambridge.org/core/terms. https://doi.org/10.1017/S1368980013002401
Table 1 Description of feeding indicators, covariates and stunting among children 6–23 months of age; secondary analysis of Phase V Demographic and Health Surveys data
(2003–2008)-Factors of interest (%) Covariates
Minimum dietary Minimum meal Minimum acceptable Breast- Male
Mother’s height (cm)
Mother’s age (years)
Stunting
Country, survey year n diversity frequency diet feeding (%) Mean SD Mean SD prevalence (%)
Azerbaijan, 2006 646 53?1 41?6 16?9 28?1 55?2 158?4 5?1 27?0 5?3 18?0 Bangladesh, 2007 1709 23?9 83?3 22?1 94?2 49?8 150?5 5?2 24?6 5?8 36?0 Benin, 2006 4513 28?6 50?5 13?7 84?3 50?0 158?5 6?2 28?5 6?2 44?5 Cambodia, 2005 1088 31?4 68?9 20?6 78?2 50?6 152?8 5?1 29?2 6?7 38?0 Dominican Republic, 2007 2822 74?4 41?3 30?2 27?0 49?8 NA NA 26?2 6?1 11?7 DRC, 2007 1140 11?4 27?4 3?1 78?3 50?7 156?7 7?7 28?3 6?9 36?2 Egypt, 2008 3209 56?8 51?4 33?2 66?1 50?6 159?6 5?9 27?5 5?6 32?1 Ethiopia, 2005 2859 4?0 42?3 2?8 82?7 51?3 156?6 6?4 28?8 7?0 47?9 Ghana, 2008 823 48?2 45?7 24?2 75?5 49?2 158?6 6?3 29?2 6?6 26?7 Honduras, 2006 2864 67?3 62?2 42?0 64?2 49?9 151?9 6?3 27?1 6?7 24?6 Haiti, 2006 773 27?8 36?6 12?2 72?1 49?7 158?4 6?1 29?0 7?0 28?1 India, 2006 14 820 12?3 42?8 7?1 83?2 52?7 151?7 5?8 25?5 5?1 46?3 Liberia, 2007 1460 22?6 45?0 10?7 75?9 52?7 156?9 6?4 28?1 7?2 33?3 Mali, 2006 3784 16?3 26?3 6?7 84?4 51?0 161?3 6?3 28?0 6?9 38?5 Namibia, 2007 1311 32?2 39?8 12?6 59?8 51?5 160?2 7?1 28?4 6?9 31?4 Nepal, 2006 1416 32?0 84?0 29?7 94?9 51?3 150?7 5?5 26?0 5?9 40?4 Niger, 2006 2649 5?5 41?3 3?2 79?4 50?2 159?8 5?8 28?2 7?1 53?8 Peru, 2008 2352 80?6 83?0 66?0 72?8 48?7 151?0 5?4 28?6 6?9 29?0 Uganda, 2006 801 23?3 34?4 8?8 79?4 48?3 158?6 6?4 28?4 6?7 36?4 Zambia, 2007 1833 37?7 50?3 21?3 78?3 48?7 157?3 6?3 27?9 6?7 45?4 Zimbabwe, 2006 1458 22?4 48?6 11?8 74?9 50?9 159?7 5?8 27?2 6?3 38?5
DRC, Democratic Republic of Congo; NA, not available.
-Weighted analysis using Demographic and Health Survey sampling weights.
1978 A W Onyango et al. . https://doi.org/10.1017/S1368980013002401 https:/www.cambridge.org/core
. University of Basel Library
, on
11 Jul 2017 at 16:20:14
interaction with age or BF was significant, mean differences are presented by respective categories. ANOVA results in nine countries revealed no significant difference in mean LAZ by minimum dietary diversity group. In eleven countries, the association was positive and significant, with effect estimates ranging from 0?16 to 1?40 LAZ in favour of increased dietary diversity. For Egypt, higher diversity was negatively associated with LAZ (20?31) in
the 12–18 months age group while for 6–9-month-olds, the association was positive (0?42). Significant interac-tions with BF were observed in DRC and Peru, showing that dietary diversity was positively associated with LAZ only in children who were no longer breast-fed.
The analysis of interrelationships between diet diversity and length-for-age categories by age (data not shown) showed that, in most countries, the children in the lowest
Table 2 Dietary factors associated with length-for-age among children 6–23 months of age based on ANOVA adjusted by demographic covariates-; secondary analysis of Phase V Demographic and Health Surveys data (2003–2008)
Country Minimum dietary diversity Minimum meal frequency Current BF Minimum dietary diversity 3 age
Minimum dietary diversity 3 current BF Current BF 3 age Azerbaijan Bangladesh X X X Benin Cambodia Dominican Republic X X DRC X X X X Egypt X X X Ethiopia X X Ghana X X Honduras X X Haiti India X X X X Liberia X X X Mali X Namibia Nepal X Niger X X X Peru X X X Uganda X X X X Zambia X X Zimbabwe X
BF, breast-feeding; DRC, Democratic Republic of Congo.
-Covariates included in the ANOVA models: child age and sex; mother’s height, age and education (none, primary, secondary and higher); wealth index quintiles (as defined in respective Demographic and Health Survey data sets); and rural/urban residence.
Table 3 Length-for-age Z-score by age group; secondary analysis of Phase V Demographic and Health Surveys data (2003–2008) 6 to 23 months 6 to 9 months 9 to 12 months 12 to 18 months 18 to 23 months
Country Mean SD n Mean SD n Mean SD n Mean SD n Mean SD n
Azerbaijan 20?79 1?77 616 20?30 1?91 111 20?16 1?78 90 20?82 1?63 204 21?28 1?67 211 Bangladesh 21?46 1?41 1655 21?02 1?46 301 21?07 1?41 243 21?45 1?33 538 21?88 1?33 573 Benin 21?69 1?98 4208 21?19 2?03 821 21?37 1?93 721 21?83 1?93 1451 22?05 1?94 1215 Cambodia 21?70 1?37 1147 20?92 1?31 201 21?44 1?40 191 21?77 1?23 374 22?16 1?31 381 Dominican Republic 20?51 1?47 2868 20?18 1?52 545 20?29 1?60 465 20?59 1?38 857 20?74 1?42 1001 DRC 21?19 2?18 1087 20?38 2?35 170 20?71 1?97 200 21?26 2?15 391 21?81 2?04 326 Egypt 20?98 2?22 3239 20?56 2?20 668 20?54 2?20 508 21?04 2?17 1039 21?42 2?20 1024 Ethiopia 21?63 1?92 1178 20?92 1?82 214 21?21 1?90 186 21?75 1?80 458 22?17 1?99 320 Ghana 20?86 1?85 812 0?03 1?84 133 20?35 1?71 145 20?95 1?83 305 21?58 1?66 229 Honduras 21?33 1?37 3077 20?77 1?27 546 21?04 1?38 532 21?46 1?25 1043 21?67 1?41 956 Haiti 21?28 1?47 847 20?85 1?47 124 20?94 1?44 157 21?20 1?49 317 21?82 1?29 249 India 21?60 1?79 12 712 20?81 1?82 2225 21?21 1?75 2032 21?73 1?71 4455 22?08 1?69 4000 Liberia 21?21 1?80 1456 20?51 1?65 296 20?90 1?75 281 21?23 1?74 436 21?85 1?76 443 Mali 21?37 1?99 3661 20?40 1?86 661 20?98 1?88 602 21?55 1?90 1421 22?00 1?98 977 Namibia 21?27 1?58 1344 20?65 1?42 250 20?85 1?50 246 21?44 1?55 460 21?74 1?59 388 Nepal 21?71 1?33 1551 21?12 1?29 269 21?38 1?27 248 21?76 1?31 524 22?13 1?26 510 Niger 21?84 1?83 1157 20?82 1?90 230 21?43 1?85 182 21?94 1?60 427 22?70 1?63 318 Peru 21?32 1?27 2468 20?87 1?36 396 21?05 1?26 425 21?40 1?18 829 21?61 1?24 818 Uganda 21?48 1?59 811 20?72 1?87 134 21?36 1?40 156 21?67 1?50 257 21?76 1?49 264 Zambia 21?57 1?94 1764 20?87 2?14 298 21?20 2?01 301 21?62 1?82 566 22?06 1?75 599 Zimbabwe 21?45 1?82 1314 20?75 1?65 237 21?13 1?93 237 21?56 1?76 472 21?95 1?75 368
DRC, Democratic Republic of Congo.
Complementary feeding and linear growth 1979
https:/www.cambridge.org/core/terms. https://doi.org/10.1017/S1368980013002401
Table 4 Detailed comparisons- of length-for-age Z-scores (LAZ) between minimum dietary diversity groups by age category; secondary analysis of Phase V Demographic and Health Surveys data (2003–2008)
6 to 23 months-- 6 to 9 months 9 to 12 months 12 to 18 months 18 to 23 months Country LAZ 95 % CI nyes, nno LAZ 95 % CI nyes, nno LAZ 95 % CI nyes, nno LAZ 95 % CI nyes, nno LAZ 95 % CI nyes, nno
Azerbaijan Bangladesh 0?53 20?00, 1?06 24, 274 0?18 20?23, 0?60 44, 199 20?16 20?40, 0?09 146, 384 0?34* 0?11, 0?56 180, 367 Benin Cambodia Dominican Republic 0?16* 0?03, 0?28 1904, 811 DRC Non-breast-fed 1?36* 0?50, 2?22 35, 152 1?36* 0?02, 2?71 10, 159 1?40* 0?41, 2?39 21, 177 20?18 20?84, 0?49 55, 326 0?36 20?29, 1?01 45, 239 Breast-fed 0?11 20?38, 0?61 96, 749 Egypt 0?42* 0?03, 0?81 154, 498 20?28 20?66, 0?10 237, 257 20?31* 20?59, 20?03 643, 360 20?14 20?45, 0?18 661, 252 Ethiopia Ghana 0?00 20?70, 0?71 30, 99 0?66* 0?07, 1?24 56, 87 0?39* 0?00, 0?79 162, 140 20?37 20?84, 0?11 130, 86 Honduras 0?04 20?16, 0?24 235, 304 20?10 20?31, 0?10 337, 191 20?07 20?22, 0?09 710, 306 0?34* 0?16, 0?51 648, 211 Haiti India 0?21* 0?13, 0?30 2017, 10 178 Liberia 0?24* 0?02, 0?45 325, 1079 Mali Namibia Nepal 0?24* 0?10, 0?37 494, 1013 Niger 20?79 21?88, 0?29 9, 217 0?73 20?14, 1?59 15, 166 20?32 20?83, 0?20 43, 371 0?66* 0?06, 1?27 31, 273 Peru Non-breast-fed 0?31* 0?06, 0?55 557, 93 Breast-fed 0?00 20?13, 0?13 1341, 411 Uganda 1?19* 0?47, 1?91 18, 115 20?06 20?68, 0?55 27, 123 0?25 20?16, 0?66 67, 179 0?06 20?37, 0?50 59, 184 Zambia Zimbabwe
DRC, Democratic Republic of Congo. *Significant at 5 % level.
-Estimated difference, 95 % confidence interval and sample sizes (nyes, nno) based on ANOVA models as presented in Table 2.
--Minimum dietary diversity main effect estimate (difference in LAZ found in the whole age interval) when interaction with age was not statistically significant.
1980 A W Onyango et al. . https://doi.org/10.1017/S1368980013002401 https:/www.cambridge.org/core
. University of Basel Library
, on
11 Jul 2017 at 16:20:14
LAZ category were less likely than the others to be receiving a diet with the minimum diversity. These results are consistent with those summarized in Table 4. Exam-ining age-related changes in median dietary diversity, it was remarkable that the countries with consistently low diversity experienced the largest declines in LAZ. Niger, for example, had the largest decline in length-for-age (1?9 Z-scores) from the youngest through to the oldest age group in the sample. Correspondingly, the propor-tions with LAZ,22 increased from 25 % in the group aged 6–9 months to 70 % at 18–23 months, with a dietary diversity median constant at 1 in this LAZ stratum. In the Mali sample, the average child aged 6–9 months received no complementary feeds (median dietary diversity 5 0) and for the older age groups, only one food group (median dietary diversity 5 1). Accordingly, length-for-age declined by 1?6 Z-scores, from 20?4 at 6–9 months to 22?0 at 18–23 months. Similar patterns were observed in DRC and Ethiopia where median dietary diversity increased from 1 at 6–9 months to 2 at 18–23 months, and length-for-age declined by 1?3 or larger Z-scores. Conversely, median dietary diversity in Peru and the Dominican Republic increased from 3–4 at 6–9 months to 5 at 18–23 months and associated declines in length-for-age were 0?7 and 0?6 Z-scores, respectively.
Discussion
Results of the present analysis confirm a pattern that has been previously documented where children in developing countries experience systematically declining length-for-age
during the CF period(1,17). There is justifiable concern to
intervene before the cumulative deficits in linear growth
become irreversible after age 2–3 years(18,19) with adverse
consequences in adulthood and for future generations(7). In
addition to the need to prevent/treat infections and promote continued BF, there is growing recognition that poor CF contributes to the characteristic negative growth trends observed in developing countries and needs focused attention and its own tailored interventions. To this end, indicators of CF quantity and quality were included in the IYCF indicators for assessing practices, identifying and targeting populations at risk, and monitoring and evaluating
IYCF interventions(8).
Among the CF indicators examined in the present analysis, dietary diversity was associated with improved linear growth more consistently than was meal frequency. Others have reported similar positive associations between
dietary diversity and child growth(4,10,20), in some cases
identifying animal-source foods as the main factor
asso-ciated with improved linear growth(21–23). The increasing
likelihood of becoming stunted between the ages of 6 and 23 months in some countries, particularly in sub-Saharan Africa, appeared to be associated with inadequate diver-sification of the diet. This was especially well illustrated in
Mali and Niger where length-for-age dropped by .1?6 Z-scores in contrast to comparatively lower declines in the Dominican Republic and Peru, where CF indicators were a lot more favourable and dietary diversity increased with age. For the indicator that combines dietary diversity and meal frequency, the proportions of children receiving a minimum acceptable diet were very low, pointing to inadequacies in both quality and quantity of CF in the majority of the countries studied. In Zimbabwe, only minimum meal frequency compliance was associated with attained linear growth after adjusting for the covariates. However, this association was negative for reasons that cannot be explained within the scope of available data.
In six of the countries included in the present analysis (Azerbaijan, Benin, Cambodia, Haiti, Mali and Namibia), none of the CF indicators was significantly associated with attained linear growth in models adjusting for maternal and household-level covariates. We did not find any published reports with comparable analysis of CF practices and their association with linear growth for Azerbaijan, Mali or Namibia.
The lack of association between feeding indicators and linear growth in Benin is not new: the analysis of DHS
data by Arimond and Ruel(4)also failed to find a significant
association between dietary diversity and length-for-age in this country. On the other hand, exposure to aflatoxins (ingested through complementary foods) has been
asso-ciated with stunting(24), and another study in Benin
described high intestinal parasite loads in pre-school children who also received diets that were low in energy and Fe and that contained high amounts of fibre and
phytate(25). As happened for Benin, dietary diversity had a
non-significant association with length-for-age in models adjusted for a selection of covariates in Arimond and
Ruel’s analysis of Haiti DHS 2000 data(4). For Zimbabwe
(DHS 1999), the same authors found an effect estimate of 0?59 LAZ for children in the top compared with the lowest
tertile of dietary diversity(4). Two recent studies from
Zim-babwe have reported that CF diets are low in diversity and
energy density(26), and that household factors contribute
importantly to poor feeding, for example beliefs against children consuming animal-source foods, legumes, fruits and vegetables, as well as competing demands on mothers’ time that limit their ability to feed their children
adequately(27). Analysing the survey data for Cambodia
also used for the present paper (DHS 2005), Marriott et al. found a lower risk of stunting among the children aged 6 and 11 months whose feeding complied with all the
age-relevant indicators(13).
We acknowledge that the present analysis has the typical limitations of using cross-sectional data that were collected for other purposes than to study the relationship between growth and CF. Attained length is the result of cumulative exposures to multiple factors that cannot be captured in the complementary diet consumed in a single day, even with adjustment for important household variables. Additionally,
Complementary feeding and linear growth 1981
https:/www.cambridge.org/core/terms. https://doi.org/10.1017/S1368980013002401
creating dichotomous variables reduces precision relative to the original measurement scale of the CF variables and entails loss of power to detect significant associations between them and growth outcomes.
These results nevertheless provide a few potentially useful insights with regard to programmes/interventions addressing CF. In the first place, because stunted growth is the result of multifaceted influences, expectations about improvements in response to single interventions should be modest. Overall, age-related declines in LAZ were larger than the positive effect estimates associated with improved CF. Two variants of food assistance programmes in Haiti with preventive interventions (including CF) among 6–23-month-olds and curative interventions (food supplements) targeting underweight 6–59-month-olds had
effect estimates of 0?34 and 0?18 LAZ, respectively(28,29).
Improved CF is a preventive intervention whose timeliness makes it attractive as a measure to mitigate decline in length-for-age before the cumulative deficits of stunting become irreversible after age 2 years. In the present analysis, positive effect estimates associated with minimum dietary diversity ranged widely from 0?2 to 1?4 LAZ. The largest estimated differences were in two countries (DRC and Uganda) where only small proportions of the sample received minimum dietary diversity and the standard deviations around the mean LAZ were large. This positive deviance may be due to additional health-promoting practices that characterize households that feed varied diets to their toddlers.
Our results and others’ show that dietary diversification has potential to improve linear growth. However, some of the benefits may be annulled if the foods included in the diversified diet carry infectious agents associated with
poor hygiene(5,30). In regions where weaning foods are
likely conduits of aflatoxins, which suppress linear growth, it is critical to take necessary measures to keep
complementary foods safe(31,32).
Although the selection of foods available in the countries we studied must be quite diverse, using four food groups to define minimum dietary diversity appears to capture diet quality in a manner that makes it comparable across the world’s developing regions. This gives credence to the use of this indicator for multi-country comparisons, especially when associated child growth is a question of interest. In this regard, minimum acceptable diet may be a useful descriptor of CF quantity and quality but perhaps its derivation leads to a loss of precision in relation to its likely contribution to growth outcomes.
Acknowledgements
Sources of funding: This analysis was conducted at the WHO as part of Promoting Healthy Growth and Pre-venting Childhood Stunting, a project funded by the Bill and Melinda Gates Foundation. The funder had no role in the design, analysis or writing of this article. The authors
alone are responsible for the views expressed in this publication and they do not necessarily represent the decisions or policies of the WHO or of Boston College. Conflicts of interest: No author has a personal or financial conflict of interest. Ethics: Ethical approval was not required to conduct the secondary analysis of DHS data. Authors’ contributions: The analysis plan was conceptualized by A.W.O and E.B., and reviewed and developed further by M.d.O, M.d.C.C. and C.G. E.B. analysed the data and wrote up the methods section, A.W.O. drafted the manuscript that was critically reviewed and refined by all authors. Acknowledgements: Special thanks are extended to Kathryn G. Dewey, Kim F. Michaelsen, Chessa Lutter and Bernadette Daelmans for reviewing the analysis plan and manuscript, and to Monica Kothari and Noureddine Abderrahim for providing DHS data codes and results from previous ana-lyses of the DHS data.
References
1. Victora CG, de Onis M, Hallal PC et al. (2010) Worldwide
timing of growth faltering: revisiting implications for interventions. Pediatrics 125, e473–e480.
2. Brown LV, Zeitlin MF, Peterson KE et al. (1992) Evaluation
of the impact of weaning food messages on infant feeding practices and child growth in rural Bangladesh. Am J Clin Nutr 56, 994–1003.
3. Bhandari N, Bahl R, Nayyar B et al. (2001) Food
supplementation with encouragement to feed it to infants from 4 to 12 months of age has a small impact on weight gain. J Nutr 131, 1946–1951.
4. Arimond M & Ruel MT (2004) Dietary diversity is
associated with child nutritional status: evidence from 11 Demographic and Health Surveys. J Nutr 134, 2579–2585.
5. Humphrey J (2009) Child undernutrition, tropical enteropathy,
toilets, and handwashing. Lancet 374, 1032–1035.
6. Imdad A, Yakoob AY & Bhutta ZA (2011) Impact of
maternal education about complementary feeding and provision of complementary foods on child growth in developing countries. BMC Public Health 11, Suppl. 3, S25.
7. Victora CG, Adair L, Fall C et al. (2008) Maternal and child
undernutrition: consequences for adult health and human capital. Lancet 371, 340–357.
8. World Health Organization/UNICEF/US Agency for
International Development/Academy for Educational
Development–Food and Nutrition Technical Assistance-2/ University of California at Davis/International Food Policy Research Institute (2008) Indicators for Assessing Infant and Young Child Feeding Practices. Part 1. Definitions. Geneva: WHO.
9. Lutter CK, Daelmans BMEG, de Onis M et al. (2011)
Undernutrition, poor feeding practices, and low coverage of key nutrition interventions. Pediatrics 128, e1–e10.
10. Ruel MT & Menon P (2002) Child feeding practices are
associated with child nutritional status in Latin America: innovative uses of the Demographic and Health Surveys. J Nutr 132, 1180–1187.
11. Rah JH, Akhter N, Semba RD et al. (2010) Low dietary
diversity is a predictor of child stunting in rural Bangladesh. Eur J Clin Nutr 64, 1393–1398.
12. Marriott BP, White A, Hadden L et al. (2012) World Health
Organization (WHO) infant and young child feeding indicators: associations with growth measures in 14 low-income countries. Matern Child Nutr 8, 354–370.
13. Marriott BP, White AJ, Hadden L et al. (2010) How well are infant and young child World Health Organization (WHO) feeding indicators associated with growth outcomes? An example from Cambodia. Matern Child Nutr 6, 358–373.
14. WHO Multicentre Growth Reference Study Group (2006)
WHO Child Growth Standards: Length/Height-for-Age, Weight-for-Age, Weight-for-Length, Weight-for-Height and Body Mass Index-for-Age: Methods and Development. Geneva: WHO; available at http://www.who.int/child growth/publications/technical_report_pub/en/index.html
15. World Health Organization (2010) WHO Anthro for Personal
Computers: Software for Assessing Growth and Development of the World’s Children (version 3.1). Geneva: WHO; available at http://www.who.int/childgrowth/software/en/
16. Rutstein SO & Kiersten J (2004) The DHS Wealth Index.
DHS Comparative Reports no. 6. Calverton, MD: ORC Macro.
17. Shrimpton R, Victora CG, de Onis M et al. (2001)
Worldwide timing of growth faltering: implications for nutritional interventions. Pediatrics 107, e75.
18. Martorell R, Khan K & Schroeder D (1994) Reversibility of
stunting: epidemiological findings in children from devel-oping countries. Eur J Clin Nutr 48, Suppl. 1, S45–S57.
19. Stein AD, Barnhart HX, Wand M et al. (2004) Comparison
of linear growth patterns in the first three years of life across two generations in Guatemala. Pediatrics 113, e270–e275.
20. Steyn NP, Nel JH, Nantel G et al. (2006) Food variety and
dietary diversity scores in children: are they good indicators of dietary adequacy? Public Health Nutr 9, 644–650.
21. Marquis GS, Habicht J-P, Lanata CF et al. (1997) Breast milk
or animal-product foods improve linear growth of Peruvian toddlers consuming marginal diets. Am J Clin Nutr 66, 1102–1109.
22. Dror DK & Allen LH (2011) The importance of milk
and other animal-source foods for children in low-income countries. Food Nutr Bull 32, 227–243.
23. Krebs NF, Mazariegos M, Tshefu A et al. (2011) Meat
consumption is associated with less stunting in four diverse low-income settings. Food Nutr Bull 32, 185–191.
24. Gong YY, Cardwell K, Hounsa A et al. (2002) Dietary
aflatoxin exposure and impaired growth in young children from Benin and Togo: a cross sectional study. BMJ 325, 20–21.
25. Dossa RAM, Ategbo EAD, de Koning FLHA et al. (2001)
Impact of iron supplementation and deworming on growth performance in preschool Beninese children. Eur J Clin Nutr 55, 223–228.
26. Paul KH, Muti M, Chasekwa B et al. (2012) Complementary
feeding messages that target cultural barriers enhance both the use of lipid-based nutrient supplements and underlying feeding practices to improve infant diets in rural Zimbabwe. Matern Child Nutr 8, 225–238.
27. Paul KH, Muti M, Khalfan SS et al. (2011) Beyond food
insecurity: how context can improve complementary feeding interventions. Food Nutr Bull 32, 244–253.
28. Ruel MT, Menon P, Habicht JP et al. (2008) Age-based
preventive targeting of food assistance and behaviour change and communication for reduction of childhood undernutrition in Haiti: a cluster randomised trial. Lancet 371, 588–595.
29. Donegan S, Maluccio JA, Myers CK et al. (2010) Two
food-assisted maternal and child health nutrition programs helped mitigate the impact of economic hardship on child stunting in Haiti. J Nutr 140, 1139–1145.
30. Motarjemi Y, Ka¨ferstein F, Moy G et al. (1993) Contaminated
weaning food: a major risk factor for diarrhoea and associated malnutrition. Bull World Health Organ 71, 79–92.
31. Gong Y, Hounsa A, Egal S et al. (2004) Postweaning
exposure to aflatoxin results in impaired child growth: a longitudinal study in Benin, West Africa. Environ Health Perspect 112, 1334–1338.
32. Khlangwiset P, Shephard GS & Wu F (2011) Aflatoxins and
growth impairment: a review. Crit Rev Toxicol 41, 740–755.
Complementary feeding and linear growth 1983
https:/www.cambridge.org/core/terms. https://doi.org/10.1017/S1368980013002401