on behalf of the British Occupational Hygiene Society doi:10.1093/annhyg/met018
992
Exposure of Highway Maintenance Workers to Fine
Particulate Matter and Noise
REto MEiER
1, WayNE E. CasCio
2, BRigitta DaNusER
1and
MiCHaEl RiEDikER
1*
1Institute for Work and Health [Institut universitaire romand de Santé au Travail], University
of Lausanne and University of Geneva, Route de la Corniche 2, CH-1066 Epalinges - Lausanne,
Switzerland; 2Environmental Public Health Division, National Health and Environmental Effects
Research Laboratory, US EPA, Research Triangle Park, NC 27711, USA
Received 31 August 2012; in final form 15 March 2013; Advance Access publication 29 May 2013 in this study, we assessed the mixed exposure of highway maintenance workers to airborne particles, noise, and gaseous co-pollutants. the aim was to provide a better understanding of the workers’ exposure to facilitate the evaluation of short-term effects on cardiovascular health endpoints. to quantify the workers’ exposure, we monitored 18 subjects during 50 non-consecutive work shifts. Exposure assessment was based on personal and work site measure-ments and included fine particulate matter (PM2.5), particle number concentration (PNC), noise (leq), and the gaseous co-pollutants: carbon monoxide, nitrogen dioxide, and ozone. Mean work shift PM2.5 concentrations (gravimetric measurements) ranged from 20.3 to 321 μg m−3 (mean 62 μg m−3) and PNC were between 1.6 × 10⁴ and 4.1 × 10⁵ particles cm−3 (8.9 × 10⁴ particles cm−3). Noise levels were generally high with leq over work shifts from 73.3 to 96.0 dB(a); the averaged leq over all work shifts was 87.2 dB(a). the highest exposure to fine and ultrafine particles was measured during grass mowing and lumbering when motorized brush cutters and chain saws were used. Highest noise levels, caused by pneumatic hammers, were measured during paving and guardrail repair. We found moderate spearman correla-tions between PNC and PM2.5 (r = 0.56); PNC, PM2.5, and Co (r = 0.60 and r = 0.50) as well as PNC and noise (r = 0.50). Variability and correlation of parameters were influenced by work activities that included equipment causing combined air pollutant and noise emissions (e.g. brush cutters and chain saws). We conclude that highway maintenance workers are frequently exposed to elevated airborne particle and noise levels compared with the average population. this elevated exposure is a consequence of the permanent proximity to highway traffic with additional peak exposures caused by emissions of the work-related equipment.
Keywords: exposure assessment; highway; mixed exposure; noise; particle monitoring—ultrafines; respir-able dust
iNtRoDuCtioN
Highway maintenance workers spend most of their work time in traffic and are constantly exposed to traffic-related emissions that have been linked to myocardial infarction (Bigert et al., 2003; Peters
et al., 2004) as well as increased cardiovascular mor-bidity and mortality (Hoek et al., 2002; Beelen et al., 2009). Traffic emissions are composed of a complex mixture of particulate and volatile air pollutants on one hand and noise on the other. Levels of particu-late matter (PM), carbon monoxide (CO), nitrogen oxides as well as volatile compounds including alde-hydes and hydrocarbons are significantly elevated in traffic environments (Roorda-Knape et al., 1998; Zhu et al., 2002; Riediker et al., 2003; Kaur et al., *Author to whom correspondence should be addressed.
Tel: +41-21-314-74-53; Fax: +41-21-314-74-30; e-mail:
2007; Beckerman et al., 2008). An important air pol-lution compound in regard to health effects is the particulate fraction originating from engine exhaust, brake wear, tire wear, and road surface abrasion (Riediker et al., 2004; Thorpe and Harrison, 2008). The PM fraction includes coarse particles with aero-dynamic diameters between 2.5 and 10 μm, fine par-ticles (PM2.5) with diameters <2.5 μm, and ultrafine particles (UFP) with diameters <0.1 μm. Direct effects of PM on the cardiovascular system are well established (Brook et al., 2010) and recent studies with focus on UFP suggest an important role of this fraction due to its small size and large surface area (Ibald-Mulli et al., 2002; Peters et al., 2006; Samet
et al., 2009). Although many studies have investi-gated health effects of traffic exposure in relation to air pollution, fewer have addressed health effects of traffic noise. There is evidence that traffic noise interacts with the cardiovascular system (Babisch, 2008) and it has been directly linked to myocardial infarction (Babisch et al., 2005; Selander et al., 2009; Huss et al., 2010) and hypertension (Fuks et al., 2011; van Kempen and Babisch, 2012). Although elevated noise levels during resting periods and at night may be most critical, cumulative exposure to high noise levels in occupational settings has also been related to hypertension (van Kempen et al., 2002; Sbihi et al., 2008; Stokholm et al., 2013).
Workers in traffic environments are exposed con-tinuously to particles and noise and may therefore be at higher risk for cardiovascular diseases compared with the average population. Elevated exposure to air pollutants has been reported for policemen (Crebelli et al., 2001; Riediker et al., 2003) and workers exposed to motor exhaust (Lewné et al., 2007). Noise was not measured in these studies. Only a few studies describe combined particle and noise measurements at traffic locations (Boogaard
et al., 2009; Can et al., 2011; Ross et al., 2011) and the same is true for combined health effects that were assessed in cohort studies only recently (Beelen
et al., 2009; Selander et al., 2009; Huss et al., 2010; Fuks et al., 2011) and only for long-term effects. Highway maintenance workers are frequently exposed to air pollutants and noise originating from road traffic or working equipment as generators or brush cutters. This mixed exposure may contribute to an increased risk for cardiovascular diseases. Our exposure assessment for this worker population serves as the basis to evaluate probable cardiovascu-lar health effects and to develop strategies to better protect the workers’ health.
The aims of our study were to better define the workers’ exposure to traffic stressors, particularly
inhalable particles and noise, for the purpose of eval-uating short-term effects on cardiovascular health endpoints. Exposure data were collected in collabo-ration with eight maintenance centers of the Swiss Road Maintenance Services located in the cantons Bern, Fribourg, and Vaud in western Switzerland. Repeated measurements with 18 subjects were conducted during 50 non-consecutive work shifts between May 2010 and February 2012, equally dis-tributed over all seasons. We hypothesized that the workers’ exposure significantly exceeds the expo-sure of the average population what could lead to an increased risk for cardiovascular diseases. In this article, we present the mixed exposure of highway maintenance workers to PM2.5, particle number con-centration (PNC), and noise as well as to the co-pol-lutants CO, nitrogen dioxide (NO2), and ozone (O3).
MEtHoDs
Study design
To assess the workers exposure to inhaled parti-cles and noise as well as gaseous co-pollutants, we used a methodology based on personal and work site measurements. To examine PM2.5 and noise exposure, the subjects were equipped with a personal dust monitor and a noise dosimeter. Additional parameters were assessed at the work site with measurement devices fixed on a hand-cart that was co-located with the workers in the field. Sample inlets were attached to a plate on the cart handle ~1 m above ground. Work site meas-urements included PNC, CO, NO2, O3 as well as sampling of PM2.5 for gravimetric analysis and PM4 for determination of elemental carbon (EC) and organic carbon (OC) levels. In parallel, we also measured temperature and humidity. Real-time measurements (PM2.5Real-time, noise, PNC, CO, temperature, and humidity) were handled in a time resolution of 1 min and merged accord-ing to time. Work site filter samples (PM) as well diffusive samplers (NO2, O3) were exposed over full work shifts. Measurements were conducted during 50 work shifts between May 2010 and February 2012 in collaboration with the Swiss Road Maintenance Services on highways in west-ern Switzerland. The Ethical Committee from the University of Lausanne approved the study, and all research volunteers provided written consent. Measurement of fine PM
PM2.5 was measured by light scattering in real time (1-min resolution) using a personal DataRam
particulate monitor pDR1000 (Thermo Scientific, Waltham, MA, USA) that was attached on the subjects’ back. As the DataRam is known to over-estimate PM2.5 in humid conditions, the data were corrected for relative humidity (RH) according to Richards et al. (1999): PMcorrected = exp(0.68 * ln (1 − RH) + 0.35) * PMmeasured. PM2.5 was also measured gravimetrically with sampling on 37-mm polytetrafluoroethylene (PTFE) filters #225-1709 from SKC (SKC Inc., Eighty Four, PA, USA) at the work site. The filters were placed in a Personal Environmental Monitor (PEM) #761-203B (SKC) connected to a Leland Legacy sampling pump (SKC) with a flow rate of 10 l min−1. After storage in standard atmosphere for at least 24 h, the filters were weighted before and after exposure with a Sartorius Microbalance from Mettler Toledo (Greifensee, Switzerland). Exposed filters were always compared with a lab-oratory blank to adjust for temperature-related variations. For quality assurance (QA), gravimet-ric measurements were performed in duplicates on 16% of the assessments: results differed in average by 15.7%.
Determination of elemental, organic, and total carbon
EC and OC contents of PM4 were determined using plasma-cleaned 37-mm Pallflex quartz filters 2500QAT-UP (Pall Corporation, Port Washington, NY, USA). Sampling was performed at the work site with a flow sampler S2500 from DuPont (Wilmington, DE, USA) and a Casella Dust Cyclone (Ideal Industries, Sycamore, IL, USA) at a sampling rate of 2 l min−1. EC and OC were determined following the standard NIOSH 5040 procedure (Birch and Cary, 1996). Carbon measurements were always corrected with field blanks. EC samples from 16 work shifts were below the quantification limit of 3 μg m−3 for a sampling duration of 8 h. In order to calculate an adequate mean and standard deviation (SD) over all work shifts, we used a tobit regression to account for this not quantified data. For QA, 12% of the carbon measurements were performed in duplicates: results differed in average by 6.1% for OC and 36.6% for EC.
Measurement of UFP
PNCs were measured at the work site with a mini-DiSC, developed at the University of Applied Sciences Northwestern Switzerland (Fierz et al., 2011). For sampling, we used the 0.8-μm cutoff
impactor and Nalgene 180 clear plastic tubing. Logging interval was 1 s and for analysis, data were averaged over 1 min. QA measurements confirmed validity of these measurements under highway conditions for the particle size range from 16 to 300 nm (Meier et al., 2013).
Measurement of gaseous pollutants
CO was measured at the work site with the CO monitor T15n (Langan Products, San Francisco, CA, USA) in 1-min resolution. NO2 and O3 con-centrations were measured with short-term dif-fusive samplers from Passam AG (Männedorf, Switzerland) exposed at the work site over full work shifts. Samples were always taken in dupli-cates and analyzed in the laboratories of Passam AG. O3 duplicates differed on average by 24.9%; NO2 samples by 6.7%. The quantification limit for O3 samples was 7.6 p.p.b. for an exposure of 8 h, which was not achieved on 24 work shifts (mostly during winter time). In order to calculate an ade-quate mean and SD over all work shifts, we used a tobit regression to account for this unquantified data.
Noise measurement
Noise was measured with the noise dosimeter type 4500 from Bruel & Kjaer (Nærum, Denmark) in standardized ISO85-mode with a measurement range from 70 to 140 dB(A), A-Filter for RMS detector and C-Filter for peak detector. Time weighting was fast and values were stored in 1-min resolution. Microphones were attached near the ear of the subjects by clipping them to the shirt or jacket. During lunch and quiet work tasks, the lower threshold of 70 dB(A) was not always achieved (34% of all intervals over 1 min). For the calculation of an adequate Leq over the full work shift, these non-detected noise levels were replaced with 67 dB (A). As sensitivity analysis, these values were replaced with 20 dB(A), which resulted on average in a 0.05 dB lower Leq over the full work shift (SD = 0.1). The small impact of this non-quantified values is due to the logarith-mic nature of noise and the relatively high noise levels beside the quiet periods. In order to adapt noise levels to the use of hearing protectors, we took notes of the exact time periods when the sub-jects used earplugs or earmuffs. Leq corrections were based on the A-weighted long-term equiva-lent continuous sound level (Leq) as we did not measure the C-weighted Leq or frequency bands. Noise levels were corrected by 25 dB if earmuffs
[single number rating (SNR) = 30] and by 20 dB if preformed earplugs (SNR = 25) were used. Correction factors were defined according to pro-posed real-world corrections for hearing protec-tors (Dantscher et al., 2009).
Measurement of temperature and humidity
Temperature and humidity were measured with HOBO data loggers U12-012 (Onset Computer Corporation, Cape Cod, MA, USA) that were fixed to the personal dust monitors as well as to the handcart at the work site. Data were logged in 1-min resolution.
Stationary measurements of air pollutants
Time-matched measurements of PM10, PNC, CO, NO2, and O3 of the stationary measurement sta-tions in Härkingen (highway site) and Payerne (countryside), Switzerland, were obtained from the Swiss National Air Pollution Monitoring Network (NABEL) in a time resolution of 10 min. Data were provided by the NABEL and MeteoSwiss (EMPA, 2011).
Record of activity, work site, and the use of hearing protectors
The activity and type of the work site of the sub-jects were recorded by the researcher accompany-ing the subjects duraccompany-ing their work shift. Activities and work sites were translated into predefined codes attributed to the corresponding time peri-ods. Work sites were defined as: indoor, in the garage of the maintenance center, in the car/truck, at roadside, off-road (>100 m away from highway or behind a major obstacle), or inside tunnels. Periods when the subjects were using earplugs or earmuffs were recorded similarly. Periods were flagged if a subject was away from the measure-ment devices at the work site. Away was defined as not being in the same working environment for >3 min, i.e. working at a different place; e.g. being outside while cart is inside car or working at a dis-tance of >50 m from the handcart.
Data treatment and statistical analysis
Data of all real-time measurements were pro-cessed with the standard software delivered with the corresponding device and imported into STATA (StataCorp. 2011). Activity, work site, use of hearing protectors, and other field remarks were attributed to the data according to time. STATA was used for statistical analysis. Linear regression models of log-normal distributed air
pollution data were calculated with logarith-mized data (using natural logarithm). Tobit mod-els (Tobin, 1958; Wild et al., 1996) were used to calculate means, SDs, and regression models for parameters with values below the quantification limit (O3 and EC): Tobit models were applied on logarithmized data followed by the calculation of arithmetic mean and SD with standard formula based on geometric statistics assuming log-nor-mal distributions.
Imputation of missing data
Missing and excluded real-time data were replaced with estimations in order to calculate adequate means over full work shifts. Missing air pollution data were replaced by estimates based on a corre-lated pollutant extrapocorre-lated to the distribution of the missing pollutant for the same subject, activity, and type of work site. Estimations of noise data were based on the parallel noise measurement of the second subject if both subjects worked at the same site. If no parallel noise data were avail-able, values were replaced based on existing data for the same subject, activity, and type of work site. Missing values were not replaced if the activ-ity and work site of the subject were not known. Estimations were only considered for the calcula-tion of the averaged exposure over work shifts and not for calculation of activity-specific exposure where missing was ignored. If a real-time variable was missing for >50% of a work shift, the work shift was not considered for summary statistics of this variable.
REsults
Characterization of the database
For 38 work shifts, two subjects were equipped with personal measurement equipment, whereas only one subject was equipped for 12 work shifts. This resulted in a total of 88 personal assessments during 50 work shifts. The duration of a work shift was 8.5 h (SD = 25 min), including work breaks. This was slightly shorter than a normal work shift as the subjects underwent a health assessment before maintenance work and exposure measure-ment started. During maintenance work, the sub-jects conducted the usual work tasks and did not make adaptations for the study.
The analysis of PM2.5Real-time is based on data from 86 personal assessments during 49 work shifts. PM2.5Real-time of two subjects during one work shift was not recorded. A total of 0.5% of
the PM2.5Real-time data during the 86 assessments were missing because the DataRam was not operational; 0.4% were excluded because the RH was >95% or the instruments were influenced by splash water (e.g. during car cleaning with high pressure water). A total of 90% of missing and excluded PM2.5Real-time values were replaced with estimations based on subject, activity, work site, and daily variation of a correlating variable. The analysis of personal noise measurements is based on data from 82 personal assessments during 50 work shifts with 3.6% missing data that were replaced with estimations. Six assessments were not used as >50% were missing because of micro-phone and battery failures. Exposure to UFP is based on data from 50 work shifts with 4.8% missing and exposure to CO on data from 49 work shifts (no data for one work shift because of battery failure). UFP and CO data were excluded for the individual assessments if subjects were absent, which was the case during 4.6% of the exposure measurements. Seventy-five percent of the missing or excluded UFP data and 71% of the excluded CO data were replaced with estima-tions. Data could not be replaced if the activity and work site of a subject were not known. Data from PTFE filter samples were available for all 50 work shifts; data from quartz filter samples to determine EC and OC fractions for 49 work shifts (pump failure during one shift). Data of NO2 and O3 samples were available from all 50 work shifts. Temperature and humidity measurements were also available for all 88 personal assessments dur-ing all 50 work shifts.
Work activities
The subjects spent most of the time driving between maintenance centers and work sites or between work sites (19.2%), followed by preparatory work (12.5%), usually in the garage at the maintenance center. Work tasks at the maintenance center also included office work (5.2%) and maintenance work at the center (1.8%). Maintenance work in the field included mowing with brush cutters (8.7%), collecting fallen leaves, stones, and litter (cleaning 7.0%), maintenance of electrical instal-lations outside (3.1%) and inside tunnels (1.4%), signalization (4.8%), repair of guard rails (3.1%), lumbering (2.0%), and other activities (5.8%) including small paving repair work, cleaning sewer conduits, snowplowing, repair of deer fences, up/ unload truck, and application of herbicides for weed control. Lunch and other work breaks, which were included in the exposure measurements,
contributed to 20.7%. Subjects were occasionally absent and activity therefore not attributed to the measured data for 4.6%.
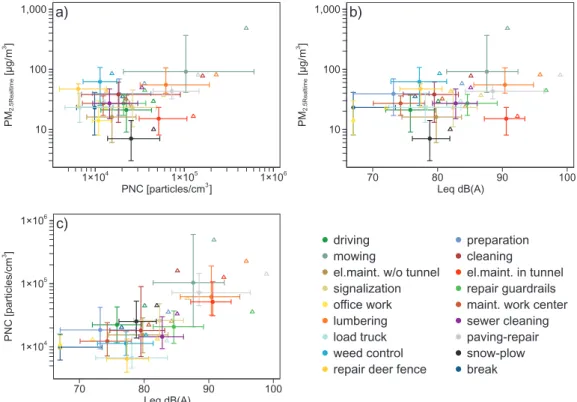
Activity-specific exposure to particles and noise Real-time exposure data of particles and noise were analyzed separately for the different main-tenance activities. For the activity-specific analy-sis, we calculated the average noise level as well as geometric means (GM) and geometric standard deviations of particle exposure shown in Table 1. Figure 1 shows scatter plots with the activity-specific median and quartile range as well as the arithmetic means of PM2.5Real-time, PNC, and Leq for each activity. We have seen that mowing, lum-bering, and pavement repair combined elevated fine particle and UFP concentrations with high noise levels. Electrical maintenance work in tun-nels was related to the highest PNC and noise levels but concentrations of PM2.5 inside tunnels were surprisingly low. Mean geometric diameters of UFP were between 28 and 55 nm. Diameters were smaller for activities in proximity to traffic; the smallest diameters were encountered dur-ing mowdur-ing, lumberdur-ing, and pavement repair (<32 nm). During mowing and cleaning, we found very heterogeneous particle levels. Noise levels were constantly high during most of the mainte-nance activities. Levels over 90 dB(A) were meas-ured inside tunnels or during the use of noisy working equipment.
Exposure during work shifts
Arithmetic means of exposure during work shifts were calculated to assess the daily exposure of the subjects. Summary statistics are given in Table 2; box plots for averaged data of work shifts are pro-vided in Fig. 2. High particle concentrations were measured during work shifts with lengthy mowing events. Work shifts including mowing or cutting wood were usually also related to high OC and EC concentrations. Noise levels averaged over full shifts were usually high, exceeding 85 dB(A) on 46% of the valid assessments. Correction of ear noise levels by 25 dB for earmuffs and 20 dB for earplugs led to significantly decreased ear noise exposure. However, it was still >85 dB(A) during 13 assessments (16%). The variability of exposure parameters between work shifts was relatively high with SDs from 50% (NO2) to >100% for PM2.5Real-time, PNC, noise, and CO. The variabil-ity within shifts was even higher with differences of >200%, except for temperature and humidity
that showed lower variability within than between shifts (Table 2).
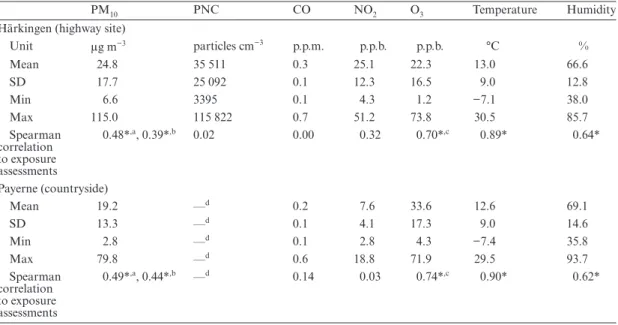
Exposure data collected during work shifts were compared with data of two stationary measure-ment stations, situated next to the Highway A1 in Härkingen, Switzerland, and a station located in the countryside in Payerne, Switzerland, operated by the NABEL and MeteoSwiss. Air pollution parameters of both stations were significantly lower than measurements from the exposure assessments, only the O3 levels were higher (Table 3). Stationary
data for corresponding time periods of the differ-ent maintenance activities are provided in Table 1. Correlations of air pollutants, noise, and
meteorological parameters
Personal PM2.5Real-time concentrations corre-sponded well to PM2.5Mass measured at work site (Pearson correlation = 0.88). This correlation was slightly improved by correcting PM2.5Real-time for humidity (without correction Pearson correla-tion = 0.83). Personal PM2.5Real-time measurements Table 1. Personal, work site, and time-matched stationary measurements of particles and noise according to maintenance activity. GM and GSD are given for particle exposure, averaged Leq for noise.
Work task During no. of work shiftsa
No. of
subjects Personal assessments Work site assessments Fixed station NABEL GM of PM2.5Real-time (μg m−3) (GSD) No. of obsb PM 2.5Real-time Leq [dB(A)] (SD [dB(A)]) No. of obsb (Leq) GM of PNC (particles cm−3) (GSD) No. of obsb (PNC) GM of PM10 Härkingen (GSD) GM of PNC Härkingen (GSD) Driving 49c 18 18.4 (3.0) 8038 80.1 (5.9) 7808 23 192 (2.9) 4842 17.8 (1.9) 19 329 (2.9) Preparation 48 18 34.0 (3.1) 5169 83.7 (8.3) 5005 19 929 (2.8) 3074 19.0 (1.9) 23 470 (2.9) Mowing 13 9 129.6 (4.7) 3881 90.8 (7.1) 3503 108 773 (7.1) 2245 22.9 (1.6) 17 152 (2.8) Cleaning 9 9 30.5 (3.6) 3201 85.2 (6.2) 2765 28 919 (5.8) 1824 20.8 (2.0) 30 412 (2.6) Signalization 18c 16 21.8 (3.0) 2070 87.2 (6.6) 1867 28 032 (2.9) 1274 18.7 (1.7) 18 851 (2.7) Repair guardrails 5 8 27.1 (2.2) 1405 96.7 (7.4) 1370 21 170 (2.6) 794 15.6 (1.3) 21 881 (2.3) Office work 6d 3 15.3 (2.8) 1351 72.0 (8.0) 1349 11 981 (1.5) 1071 22.3 (1.8) 31 113 (2.7) Electrical maintenance without tunnel 5c 4 12.9 (2.9) 1163 84.3 (7.2) 1357 13 840 (3.2) 808 13.0 (1.5) 17 460 (2.6) Electrical maintenance in tunnel 3 4 12.8 (2.4) 806 92.3 (5.3) 692 64 741 (2.9) 477 13.2 (1.5) 34 649 (1.7) Maintenance work at maintenance center 2 3 24.0 (2.2) 833 80.7 (6.7) 833 14 148 (2.2) 444 17.5 (1.3) 17 497 (2.5) Lumbering 4 3 60.3 (2.3) 745 95.8 (7.0) 715 84 238 (3.6) 496 28.4 (2.2) 16 827 (3.0) Sewer cleaning 2 4 25.8 (2.7) 607 85.1 (5.9) 539 18 760 (2.6) 327 23.1 (1.3) 21 427 (1.5) Load truck 7e 9 20.8 (2.5) 450 83.5 (8.0) 438 8272 (2.4) 231 11.4 (1.9) 8262 (2.8) Paving repair 3 2 45.0 (2.5) 319 98.9 (8.1) 319 82 555 (2.5) 318 26.6 (1.2) 22 358 (2.5) Weed control 2d 2 53.2 (2.9) 277 80.3 (5.6) 277 12 008 (2.0) 85 13.0 (1.0) 29 933 (2.1) Snowplowf 1 1 7.0 (2.6) 273 82.0 (4.5) 274 27 639 (2.6) 270 71.2 (1.1) 95 947 (1.5) Repair deer fence 2 1 38.9 (1.6) 265 82.0 (5.8) 168 8069 (2.4) 257 49.2 (1.1) 8099 (1.4) Break 50c,d 18 20.1 (3.3) 9034 76.5 (8.5) 8387 10 950 (2.5) 4924 19.9 (1.9) 19 485 (2.9) aShift only counted if activity was performed for >15 min.
bNumber of measured minute averages. cOne work shift less for PM
2.5Real-time.
dOne work shift less for PNC. eOn work shift less for noise.
running in parallel for two subjects correlated well (Pearson correlation = 0.88 during 37 paral-lel assessments). Personal measurements of noise exposure during full work shifts were moderately correlated (Pearson correlation = 0.54 during 34 parallel assessments). Spearman correlations between the different airborne pollutants and noise were calculated based on the work shift averages and are shown in Table 4. Moderate correlations were found between PNC, CO, and PM2.5. Noise was moderately correlated to PNC but only weakly to PM2.5. Coefficients of linear regression models between logarithmized work shift averages are pro-vided in the Supplementary Table S1 at Annals of Occupational Hygiene online. Table 3 shows the correlations of the work shift averages to time-matched data from the fixed stations in Härkingen and Payerne:PM2.5 and O3 were moderately corre-lated with both stations, NO2 showed weak corre-lation to the station at the highway. PNC and CO did not correlate with stationary data.
DisCussioN
Exposure assessments during highway mainte-nance work showed that maintemainte-nance workers
were regularly exposed to elevated particle and noise levels compared with the average popula-tion. Particle as well as noise exposure varied in relation to different maintenance activities from clean and quiet conditions during office work to conditions with elevated particle and noise exposure during activities at roadside as signali-zation or electrical maintenance work. Exposure to particles and noise reached very high levels if a work task included the use of particle and/or noise emitting working equipment such as brush cutters, chain saws, generators, and pneumatic hammers. The low UFP diameters that were measured during the use of motorized working equipment indicate that combustion emissions from these small engines contributed substantially to the high particle levels. However, dispersion of soil dust, release of plant sap and pollen as well as resuspension of deposited PM may also have played a role—although more likely for fine and coarse particle mass rather than total particle number. The high UFP and noise levels in tunnels can be explained by constant particle and noise emissions of highway traffic. Low PM2.5 levels inside tunnels are likely a consequence of clean environmental conditions and a good ventilation
10 100 1,000 PM 2.5Realtime [µg/ m 3 ] 1×10⁴ 1×10⁵ 1×10⁶ PNC [particles/cm 3] a) 10 100 1,000 PM 2.5Realtim e [µg/ m 3] 70 80 90 100 Leq dB(A) b) 1×10⁴ 1×10⁵ 1×10⁶ PNC [particles/cm 3 ] 70 80 90 100 Leq dB(A) c) driving preparation mowing cleaning
el.maint. w/o tunnel el.maint. in tunnel signalization repair guardrails office work maint. work center lumbering sewer cleaning load truck paving-repair weed control snow-plow repair deer fence break
Fig. 1. Scatter plots with activity specific exposure to PM2.5Real-time, PNC, and noise. Graphs show medians with quartiles (cross) and arithmetic means (triangles) of exposure parameters for the different activities.
of the tunnel: UFP do not stay inside the tunnel very long and photochemical processes leading to accelerated agglomeration do not take place due to lacking ultraviolet radiation. Elevated and inhomogeneous particle levels during cleaning were mainly influenced by two work shifts dur-ing which the subjects were followed by a mowdur-ing
tractor causing high particle emissions. The high PM2.5 levels during weed control can neither be explained with working equipment nor with traf-fic volume or environmental background levels. Although gravimetric PM2.5 measurements of the two affected work shifts corresponded well to the real-time data, we cannot exclude that the light Table 2. Summary of exposure parameters per work shift with arithmetic mean and range as well as SD between and within work shifts.
Unit Mean Min Max Between
shift SDa Within shift SDb No. of work shifts No. of personal or work site
assessments PM2.5Real-time μg m−3 79.5 9.0 723.5 113.4 (143%) 167.1 (210%) 49 86c PM2.5Mass μg m−3 61.8 20.3 321 53.5 (87%) —d 50 50e PNC particles cm−3 88 660 15 524 406 534 97 670 (110%) 198 024 (223%) 50 50 e UFP sizef nm 48.0 30.4 78.7 9.6 (20%) 15.9 (33%) 50 50e Leq dB(A) 87.2 73.3 96.0 5.0 (317%) 8.9 (770%) 50 82c
Peak noiseg events 3.6 0.0 27.0 4.9 (135%) —d 50 82c
CO p.p.m. 0.8 0.1 5.5 1.0 (117%) 1.9 (228%) 49 49e NO2 p.p.b. 57.6 15.6 155.2 28.7 (50%) —d 50 50e O3 p.p.b. 11.4 b.q.h 46.5 9.7 (85%) —d 50 50e OC μg m−3 24.8 3.4 129.5 17.8 (72%) —d 49 49e EC μg m−3 4.7 b.q.h 18.6 3.4 (73%) —d 49 49e Temperature °C 20.2 8.1 32.6 5.9 (29%) 3.6 (18%) 50 88c Humidity % 51.1 34.9 76.4 10.0 (19%) 9.0 (18%) 50 88c Duration hh:mm 08:31 07:32 09:53 00:25 (5%) —d 50 88e
aConsidering averages over work shift.
bConsidering minute averages during work shifts. cPersonal assessment.
dOnly assessed for full work shift. eWork site assessment.
fGeometric mean diameter.
gPeak noise events with noise levels >135 dB(C). hBelow quantification limit (7.6 p.p.b. for O
3; 3 μg m−3 for EC). 10 50 100 1,000 µg/ m 3 a PM2.5Realtime 10 50 100 1,000 µg/ m 3 b PM2.5Mass 1×10⁴ 1×10⁵ 1×10⁶ particles/c m 3 c PNC 70 75 80 85 90 95 100 dB(A ) d Leq
Fig. 2. PM2.5, PNC, and Leq averaged over work shifts; (a) personal PM2.5Real-time; (b) gravimetrically measured PM2.5Mass
scatter measurements were influenced by herbi-cide spray aerosols. High PM2.5 concentrations during deer fence repair were related to elevated environmental background concentrations and low particle concentrations during truck loading can be explained by the work sites situated either off road or underneath a highway bridge in the countryside. Low PM2.5 concentrations during snowplow cannot be explained conclusively, but were likely a consequence of local precipitations washing out particles. High noise levels during
guardrail repair were caused by assembling the metal barriers and reached very high levels when a pneumatic hammer was used to drive guardrails into the ground.
To calculate the contribution of different main-tenance activities to the total particle exposure, we multiplied the duration of an activity during the 50 work shifts of exposure assessment with the mean exposure level (Fig. 3). We could see that mowing was the biggest contributor by far as it combined high exposure with long duration. However, these Table 3. Time-matched air pollutant data of two stationary sites located near to a highway and in the countryside. Spearman correlations are based on averages over work shifts. Data provided from the NABEL and MeteoSwiss.
PM10 PNC CO NO2 O3 Temperature Humidity
Härkingen (highway site)
Unit μg m−3 particles cm−3 p.p.m. p.p.b. p.p.b. °C % Mean 24.8 35 511 0.3 25.1 22.3 13.0 66.6 SD 17.7 25 092 0.1 12.3 16.5 9.0 12.8 Min 6.6 3395 0.1 4.3 1.2 −7.1 38.0 Max 115.0 115 822 0.7 51.2 73.8 30.5 85.7 Spearman correlation to exposure assessments 0.48*,a, 0.39*,b 0.02 0.00 0.32 0.70*,c 0.89* 0.64* Payerne (countryside) Mean 19.2 —d 0.2 7.6 33.6 12.6 69.1 SD 13.3 —d 0.1 4.1 17.3 9.0 14.6 Min 2.8 —d 0.1 2.8 4.3 −7.4 35.8 Max 79.8 —d 0.6 18.8 71.9 29.5 93.7 Spearman correlation to exposure assessments 0.49*,a, 0.44*,b —d 0.14 0.03 0.74*,c 0.90* 0.62* aCorrelation to PM 2.5Real-time. bCorrelation to PM 2.5Mass.
cCorrelation on measured data only (not considering estimates for not quantified samples). dNo data available.
*Correlation significant (P < 0.01).
Table 4. Spearman correlations between air pollutants, noise, and meteorological parameters averaged over work shifts (arithmetic means).
PM2.5Real-time PM2.5Mass PNC Leq CO NO2 O3 EC OC Temperature
PM2.5Mass 0.80* 1.00 PNC 0.56* 0.48* 1.00 Leq 0.28 0.25 0.50* 1.00 CO 0.50* 0.51* 0.60* 0.40* 1.00 NO2 −0.33 −0.20 −0.02 −0.02 −0.09 1.00 O3 0.27 0.30 −0.13 0.07 0.21 −0.19 1.00 EC −0.10 −0.02 0.02 −0.10 −0.09 0.70* −0.16 1.00 OC 0.67* 0.64* 0.57* 0.19 0.54* −0.14 0.11 −0.03 1.00 Temperature 0.14 0.29 −0.06 0.03 0.25 −0.09 0.68* 0.01 0.07 1.00 Humidity −0.08 −0.10 0.15 −0.03 −0.21 0.01 −0.47* 0.11 −0.11 −0.32 *Correlation significant (P < 0.01).
contributions cannot be generalized for individual workers as they conducted certain activities more of less often than the mixed sample of workers.
All exposure parameters showed a high variabil-ity within and between work shifts. This variabilvariabil-ity can be explained by the mix of different mainte-nance activities and changing environmental back-ground on different work shifts. Exposure during ‘clean’ activities were comparable with levels at the highway site in Härkingen and corresponded to data found in the literature: PM2.5Real-time concentration during driving (arithmetic mean 29.0 μg m−3) is in the same range as levels inside patrol cars in North Carolina (Riediker et al., 2003) and Swedish taxi drivers but lower than exposures involving Swedish bus and lorry drivers (Lewné et al., 2006). The GM of PM2.5Real-time dur-ing preparatory work was lower than values for Swedish garage workers working with petrol and diesel vehicles (Lewné et al., 2007). PNC during roadside activities without particle emitting work-ing equipment were comparable with measure-ments at a highway toll station in Taiwan (Cheng
et al., 2010) if adapted for the measured size range of the miniDiSC (Meier et al., 2013). On the other hand, they were clearly lower than reported for the 9-lane Freeway 405 in Los Angeles (Zhu
et al., 2002). However, comparison of PNC with literature data has to be interpreted with care as PNCs have a high temporal and spatial vari-ability. Concentrations of EC and OC were lower than values measured at a highway toll station in Taiwan (Shih et al., 2008) but comparable
with previously published concentrations at traf-fic locations that are summarized by Shih et al. (2008). NO2 levels were >2-fold higher than at the highway site in Härkingen and 1.4- to 3.8-fold higher than reported for other traffic locations (Gilbert et al., 2003; Can et al., 2011; Ross et al., 2011) and inside patrol cars (Riediker et al., 2003).
Maintenance activities with motorized equip-ment were associated with strongly elevated levels of both particles and noise. This seems to be the main reason why the correlation between PM2.5 and PNC was higher than previously reported for traffic environments (Boogaard et al., 2009, 2010) and also explain the correlation between PM2.5 and CO. Moderate correlations of PNC and CO to noise can be attributed to simultaneous com-bustion and noise emissions from motorized work equipment and highway traffic. The low correla-tion of PM2.5 and noise can be explained by the dependency of PM2.5 on the environmental back-ground rather than local combustion emissions. In contrast to previously published data for traffic locations (Davies et al., 2009; Ross et al., 2011), we did not see any correlation between noise and NO2. Interestingly NO2 and EC were very well correlated and the only two pollutants that only showed weak correlations with any other param-eter. High correlation between these two pollut-ants in proximity to highways has been described before (Ross et al., 2011). Personal PM2.5Real-time and work site PM2.5Mass correlated well but the range of the real-time measurements was wider. These differences are likely a consequence of the
53.9 9.4 9.3 7.3 7.0 2.32.1 1.81.5 5.5
% of PM
2.5dose
49.7 13.0 10.0 5.2 5.2 4.8 3.22.1 2.0 4.8% of PNC dose
mowing cleaning driving lumbering
preparation break signalization paving repair
el.maint. tunnel rep. guardrails office work
different measurement techniques and real-time values exceeding the gravimetric values by 50% or more can be explained by overestimation of the personal DataRam (Liu et al., 2002). Despite generally small distances between the two meas-urements (<10 m), we suggest that large measure-ment differences (>70% during 9 work shifts) were due to different distances from pollution sources.
We could confirm our hypothesis that mainte-nance workers are exposed to elevated particle and noise levels compared with the average popula-tion. Mean PM2.5 levels were about three to eight times higher than residential exposure of the Swiss population represented by the cohort of the swiss study on air pollution and lung disease in adults (SAPALDIA) (6.9–24.9 μg m−3) (Liu et al., 2007). Noise levels were considerably higher than resi-dential traffic noise during daytime for the same cohort (50.5 dB(A)) (Dratva et al., 2012). PNCs were ~3–20 times higher compared with residential exposure in four European Cities (4.5 × 10³–2.6 × 10⁴ particles cm−3 in the size range 7 nm–3 μm) (Puustinen et al., 2007). Although exposure to air pollutants was elevated in comparison with envi-ronmental background concentrations, no param-eter reached critical values in comparison with 8-h occupational exposure limits as defined by Swiss legislation (SUVA, 2012). No statement can be made about O3 exposure, which is regulated with a short-term limit that cannot be compared with the work shift mean that we measured. This short-term limit may have been exceeded, as this was the case at the highway site in Härkingen. PNC cannot be compared with limits as there are no regulations for this parameter. However, PNC showed a very large increase in comparison with environmental background concentrations. Noise levels frequently exceeded 85 dB(A), a typical limit for prevention of hearing loss. Hearing protectors were available at all time and usually used by workers as needed, although less often when noise was caused by high-way traffic but not the work task itself.
The elevated exposure to particles may lead to an elevated cardiovascular risk even if occupa-tional exposure limits are not exceeded. Assuming an average non-work-related background expo-sure of 20 μg m−3, the additional exposure of an 8.5-h work shift with a mean exposure of 62 μg m−3 leads to an increase of almost 15 μg m−3. According to current knowledge, such short-term elevations lead to an increased relative risk for daily cardiovascular mortality of 0.6–1.5% (Brook et al., 2010). Extrapolated on a full year with 235 workdays, the occupational contribution
is responsible for an increase of 10 μg m−3. On the long-term, this additional exposure leads to an elevated risk for cardiovascular mortality of a fac-tor of 1.06–1.76 (Brook et al., 2010).
CoNClusioNs
Highway maintenance workers are exposed to elevated levels of fine particle and UFP as well as noise compared with the average population. This elevated exposure is a consequence of close proximity to highway traffic but peak exposure levels occur when motorized working equipment as brush cutters, chain saws, generators, and pneumatic hammers are used. The largest poten-tial for occupational exposure reduction seems to be with these devices. Although exposure to air pollutants were not critical if compared with occupational exposure limits, the elevated expo-sure to particles and noise may lead to a higher risk for cardiovascular diseases in this worker population.
suPPlEMENtaRy Data
Supplementary data can be found at http:// annhyg.oxfordjournals.org/.
FuNDiNg
This study was funded by grant NO 124954 from the Swiss National Science Foundation.
Acknowledgements—The authors thank the Swiss Road
Maintenance Services and in particular the participat-ing subjects for the administrative support and excellent cooperation during the field measurements. The authors also thank Pascal Wild for statistical consulting and Simon Deslarzes for carbon analysis. The research described in this article has been reviewed by the US Environmental Protection Agency and approved for publication. The con-tents of this article do not necessarily represent Agency policy nor does mention of trade names or commercial products constitute endorsement or recommendation for use.
REFERENCEs
Babisch W. (2008) Road traffic noise and cardiovascular risk. Noise Health; 10: 27–33.
Babisch W, Beule B, Schust M et al. (2005) Traffic noise and risk of myocardial infarction. Epidemiology; 16: 33–40. Beckerman B, Jerrett M, Brook JR et al. (2008) Correlation
of nitrogen dioxide with other traffic pollutants near a major expressway. Atmos Environ; 42: 275–90.
Beelen R, Hoek G, Houthuijs D et al. (2009) The joint association of air pollution and noise from road traffic
with cardiovascular mortality in a cohort study. Occup Environ Med; 66: 243–50.
Bigert C, Gustavsson P, Hallqvist J et al. (2003) Myocardial infarction among professional drivers. Epidemiology; 14: 333–9.
Birch ME, Cary RA. (1996) Elemental carbon-based method for occupational monitoring of particulate die-sel exhaust: methodology and exposure issues. Analyst; 121: 1183–90.
Boogaard H, Borgman F, Kamminga J et al. (2009) Exposure to ultrafine and fine particles and noise during cycling and driving in 11 Dutch cities. Atmos Environ; 43: 4234–42.
Boogaard H, Montagne DR, Brandenburg AP et al. (2010) Comparison of short-term exposure to particle number, PM10 and soot concentrations on three (sub) urban loca-tions. Sci Total Environ; 408: 4403–11.
Brook RD, Rajagopalan S, Pope CA 3rd et al. (2010) Particulate matter air pollution and cardiovascular disease: an update to the scientific statement from the American Heart Association. Circulation; 121: 2331–78.
Can A, Rademaker M, Van Renterghem T et al. (2011) Correlation analysis of noise and ultrafine particle counts in a street canyon. Sci Total Environ; 409: 564–72. Cheng YH, Huang CH, Huang HL et al. (2010)
Concentrations of ultrafine particles at a highway toll collection booth and exposure implications for toll col-lectors. Sci Total Environ; 409: 364–9.
Crebelli R, Tomei F, Zijno A et al. (2001) Exposure to benzene in urban workers: environmental and biologi-cal monitoring of traffic police in Rome. Occup Environ Med; 58: 165–71.
Dantscher S, Sickert P, Liedtke M. (2009) Sound attenu-ation of hearing protectors in use at work (Vol. Report 4/2009e). Sankt Augustin, Germany: German Social Accident Insurance.
Davies HW, Vlaanderen JJ, Henderson SB et al. (2009) Correlation between co-exposures to noise and air pol-lution from traffic sources. Occup Environ Med; 66: 347–50.
Dratva J, Phuleria HC, Foraster M et al. (2012) Transportation noise and blood pressure in a population-based sample of adults. Environ Health Perspect; 120: 50–5.
EMPA. (2011) Technischer Bericht zum Nationalen Beobachtungsnetz für Luftfremdstoffe (NABEL) 2011. Dübendorf, Switzerland: Swiss Federal Laboratories for Materials Science and Technology. Available at http:// www.empa.ch/plugin/template/empa/*/114172. Accessed 14 December 2012.
Fierz M, Houle C, Steigmeier P et al. (2011) Design, cali-bration, and field performance of a miniature diffusion size classifier. Aerosol Sci Technol; 45: 1–10.
Fuks K, Moebus S, Hertel S et al. (2011) Long-term urban particulate air pollution, traffic noise, and arterial blood pressure. Environ Health Perspect; 119: 1706–11. Gilbert NL, Woodhouse S, Stieb DM et al. (2003) Ambient
nitrogen dioxide and distance from a major highway. Sci Total Environ; 312: 43–6.
Hoek G, Brunekreef B, Goldbohm S et al. (2002) Association between mortality and indicators of traffic-related air pollution in the Netherlands: a cohort study. Lancet; 360: 1203–9.
Huss A, Spoerri A, Egger M et al. (2010) Aircraft noise, air pollution, and mortality from myocardial infarction. Epidemiology; 21: 829–36.
Ibald-Mulli A, Wichmann HE, Kreyling W et al. (2002) Epidemiological evidence on health effects of ultrafine particles. J Aerosol Med; 15: 189–201.
Kaur S, Nieuwenhuijsen MJ, Colvile RN (2007) Fine par-ticulate matter and carbon monoxide exposure concen-trations in urban street transport microenvironments. Atmos Environ; 41: 4781–810.
Lewné M, Nise G, Lind ML et al. (2006) Exposure to parti-cles and nitrogen dioxide among taxi, bus and lorry driv-ers. Int Arch Occup Environ Health; 79: 220–6. Lewné M, Plato N, Gustavsson P. (2007) Exposure to
par-ticles, elemental carbon and nitrogen dioxide in workers exposed to motor exhaust. Ann Occup Hyg; 51: 693–701. Liu LJ, Curjuric I, Keidel D et al. (2007) Characterization
of source-specific air pollution exposure for a large population-based Swiss cohort (SAPALDIA). Environ Health Perspect; 115: 1638–45.
Liu LJ, Slaughter JC, Larson TV. (2002) Comparison of light scattering devices and impactors for particulate measurements in indoor, outdoor, and personal environ-ments. Environ Sci Technol; 36: 2977–86.
Meier R, Clark K, Riediker M. (2013) Comparative testing of a miniature diffusion size classifier to assess airborne ultrafine particles under field conditions. Aerosol Sci Technol; 47: 22–8.
Peters A, Veronesi B, Calderón-Garcidueñas L et al. (2006) Translocation and potential neurological effects of fine and ultrafine particles a critical update. Part Fibre Toxicol; 3: 13.
Peters A, von Klot S, Heier M et al. (2004) Exposure to traffic and the onset of myocardial infarction. N Engl J Med; 351: 1721–30.
Puustinen A, Hämeri K, Pekkanen J et al. (2007) Spatial variation of particle number and mass over four European cities. Atmos Environ; 41: 6622–36.
Richards LW, Alcorn SH, McDade C et al. (1999) Optical properties of the San Joaquin Valley aerosol collected during the 1995 integrated monitoring study. Atmos Environ; 33: 4787–95.
Riediker M, Devlin RB, Griggs TR et al. (2004) Cardiovascular effects in patrol officers are associated with fine particulate matter from brake wear and engine emissions. Part Fibre Toxicol; 1: 2.
Riediker M, Williams R, Devlin R et al. (2003) Exposure to particulate matter, volatile organic compounds, and other air pollutants inside patrol cars. Environ Sci Technol; 37: 2084–93.
Roorda-Knape MC, Janssen NAH, De Hartog JJ et al. (1998) Air pollution from traffic in city districts near major motorways. Atmos Environ; 32: 1921–30. Ross Z, Kheirbek I, Clougherty JE et al. (2011) Noise,
air pollutants and traffic: continuous measurement and correlation at a high-traffic location in New York City. Environ Res; 111: 1054–63.
Samet JM, Rappold A, Graff D et al. (2009) Concentrated ambient ultrafine particle exposure induces cardiac changes in young healthy volunteers. Am J Respir Crit Care Med; 179: 1034–42.
Sbihi H, Davies HW, Demers PA. (2008) Hypertension in noise-exposed sawmill workers: a cohort study. Occup Environ Med; 65: 643–6.
Selander J, Nilsson ME, Bluhm G et al. (2009) Long-term exposure to road traffic noise and myocardial infarction. Epidemiology; 20: 272–9.
Shih TS, Lai CH, Hung HF et al. (2008) Elemental and organic carbon exposure in highway tollbooths: a study
of Taiwanese toll station workers. Sci Total Environ; 402: 163–70.
StataCorp. 2011. Stata Statistical Software: Release 12. College Station, TX: StataCorp LP
Stokholm ZA, Bonde JP, Christensen KL et al. (2013) Occupational noise exposure and the risk of hyperten-sion. Epidemiology; 24: 135–42.
SUVA. (2012) Grenzwerte am Arbeitsplatz 2012. Luzern, Switzerland: Swiss National Accident Insurance Organization.
Thorpe A, Harrison RM. (2008) Sources and properties of non-exhaust particulate matter from road traffic: a review. Sci Total Environ; 400: 270–82.
Tobin, J. (1958) Estimation of relationships for limited dependent variables. Econometrica; 26: 24–36.
van Kempen E, Babisch W. (2012) The quantitative rela-tionship between road traffic noise and hypertension: a meta-analysis. J Hypertens; 30: 1075–86.
van Kempen EE, Kruize H, Boshuizen HC et al. (2002) The association between noise exposure and blood pres-sure and ischemic heart disease: a meta-analysis. Environ Health Perspect; 110: 307–17.
Wild P, Hordan R, Leplay A et al. (1996) Confidence intervals for probabilities of exceeding threshold lim-its with censored log-normal data. Environmetrics; 7: 247–59.
Zhu Y, Hinds WC, Kim S et al. (2002) Concentration and size distribution of ultrafine particles near a major highway. J Air Waste Manag Assoc; 52: 1032–42.