Associations
of peak shifts in age-prevalence
for human malarias with bednet
coverage
T. Smith’J, J* L. K. Hiii>3, B. Genton’!‘, I. MIleti, M. Booth*, N. Gibson’+, A. Narara’ and
M. P. Alpers’ ‘Papua New Guinea Institute of Medical Research, I? 0. Box 378, Madang, Papua New Guinea; ‘Swiss Tropical Instit~re, Socinsrrusse 57, Postjack CH-4002, Base& Switzerland; 3SchooE of Public Health and Tropical Medicine,
‘james Cook University, Townsville, Queenstand 4811, Australia Abstract
Effects of bednet coverage (C) on prevalence of malaria were analysed using data from 1990-92 from 9 Papua New Guinean villages. Effects of coverage varied by age, resulting in a shift in age ofpeakprevalence from 4.7 (C = 0%) to 11.6 (C = 100%) years for PZ~smodiumful&pantm, from 3.4 to 4.9 years for i? vivax and from 11.0 to 16.8 years for l? malaldae. In small areas with no bednets the age distribution of P. falciparum parasitaemia was like that of a holoendemic area. Where coverage was complete the pattern
corresponded to mesoendemicity. Thus, protracted use of bednets can result in profound changes in the endemicity of malaria even when coverage is incomplete and without insecticide treatment. Average entomological inoculation rates (EIRs) estimated from indoor landing rates on individuals without bednets were 35, 12 and 10 infectious bites per person per annum for I? falcipanrm, I? vivax and P. maluriue, respectively. Logistic regression analyses indicated that the EIR estimate for I? fazciparum was related to prevatence of this species independently of effects of bednet coverage. However, the recent EIR still accounted for much less variation than did the bednets. A similar pattern was seen for P. malariae, while there were no significant relationships between the recent EIR and the parasite positivity for l? uivax. It is concluded that short-term variations in inoculation rate are not important determinants of parasite prevalence in this population.
Keywords: malaria, Plasmodium fukiparum, Plasmudiunz vivax, Pl~modium malariae, prevalence, age, endemicity,
bednets, entomological inoculation rates, Papua New Guinea
Introduction
Bednets have long been used as protection against mosquitoes (LXWXAY & GIBSON, 1988), but have only
recently become a cornerstone of malaria control strate- gies. This renewed interest is because insecticide-treated nets (ITNs) have been shown to substantially reduce malaria morbidity and mortality (reviewed by LENGELER, 1998). A major operational concern for ITN pro- grammes is that high rates of re-treatment are difficult to achieve. Hence it is important to understand how well the nets will function once the insecticide has been lost. Observational studies (e.g., CAMPBELL et& 1987) have suggested that untreated nets (UT&) also protect against malaria; however, the only randomized con- trolled trial (RCT) found no significant effects (SNOW et al., 1988).
In contrast to the results of that RCT, we previously observed that the prevalence of Plasmodium jakiparum parasitaemia was strongly negatively correlated with levels of UTN use measured at the village level in the Wosera area of Papua New Guinea (GENTON et al.,
1994, 1995). There was a stronger relationship between infection prevalence and the proportion using UTNs of persons living within 25 m (C), than there was between infection status and self-repon-ed bednet use at the individual level (HII et al., 2001). This is probably because the bednets act by reducing the vectorial capa- city of the mosquitoes, especially their survival rate, rather than because of individual protection (HII et al., 2001).
The UTNs in the Wosera had been present for several years at the time of the study, so a possible explanation for differences between our results and those from The Gambia (SNOW et aE., 1988) is that effects of bednets accumulate only slowly. Long-term reduction in the transmission rate of a parasite can have cumulative effects, characteristically increasing the age at which the maximum prevalence is reached (ANDERSON & MAY, 1992) and reducing the actual peak prevalence. Together these variables show the strength of the peak
‘Deceased.
Address for correspondence: Dr T. Smith, Department of
Public Health and Epidemiology, Swiss Tropical Institute,
Socinstrasse 57, Postfach CH-4002, Base], Switzerland; e-mail [email protected]
shift in prevaIence (WOOLHOUSE, 1998), and thus indicate the effect of bednet coverage on exposure to parasites and hence acquired immunity.
We have now anal$ed age-variation in patterns of malaria infection in the Wosera. for villages with different levels of UTN coverage, using a sta&ical approach based on the malaria model of ARON (1983). This analysis enabled us to estimate the strength of the peak shift associated with UTN use for each malaria snecies. Using a geographical information system and ipatial statistical models, we also estimated human biting rates, ma, for the 6 different vector species in each of 205 small STOWS of houses, for each of 6 ueriods of 4 months. We &&pIied the diting rates by- circumsporozoite rates determined by ELISA to estimate entomological inocu- lation rates (EIRs) for each of I? falciparum, IJ. vivax and P. maZariae and then used these estimates to investigate how short-term variation in EIR affected the prevalence of infection in different age-groups. Finally, we com- pared these effects with those of UTN coverage. Methods
Study area and malariological surveys
The present study comprises supplementary analyses of malariological survey data collected during 1990-92 as part of the Malaria Vaccine Evaluation and Epidemi- ology Project in the Wosera area of Papua New Guinea. Malaria parasitaemia is perennial with an overall pre- valence of 60%; 55% of infections are due to P. fakiparum, 25% to l? vivax and 20% to I? malariae
(for details see GENTON et al., 1995). Six different malaria vectors are present (HII et al., 1997).
Antimalarials are available mainly from 3 health centres and 6 aid posts, but both chloroquine and amodiaquine resistance are common (our unpublished data; SAPAK etal., 1991).
House positions were recorded using a hand-held global positioning system device (Trimble Navigational Europe, London) and validated against sketch maps. Bednet coverage (C) was quantified by the proportion of questionnaire responses, from houses within a radius of 25 m, that indicated UTN use the previous night [see HII et aE. (200 l)] .
Between July 1990 and July 1992 a total of 10001 blood slides were prepared from 7, approximately 4- monthly, sample surveys of 10 villages (GENTON et al.,
T. SMITH ETAL.
2
1995). During these survevs, randomly chosen indivi- duals- were identified accoiding to previously obtained demoaanhic information. and interviewed on UTN usage-fo; the previous night, history of illness and drug consumption during the previous week,
Estimation of entomological inoculatibn rate (EIR) The EIR is the average number of human-biting anophelines collected per person per night (ma) multi- plied by s, the proportion with sporozoites.
To obtain estimates of the EIR, all houses with recorded positions within 80 m of each other were grouped into a single cluster, which was assigned the location of the centroid of the positions of the component houses. Each cluster was assigned a distinct estimate of ma derived from conditional autoregressive (CAR) mod- els, fitted to the indoor landing rate data as described previously (SMITH et al., 1995; HII et ul., 1997) by smoothing cluster data over a radius of 500 m. Separate models were fitted for each Anopheles species and for each inter-survey interval (approximately 4 months). A lag period of 2 weeks was applied to allow for pre-patent periods. The mosquito densities associated with any one parasitological observation were thus the average ex- pected density over the interval starting 2 weeks before the previous survey and ending 2 weeks before the current survey, and allowing for heterogeneities in the sampling effort.
Sporozoite positivity was determined separately for each anopheline species by an ELJSA test for circum- sporozoite antigen in the head and thorax (for details see
HII et al., 2001). Estimates of s for P, falcipunun and P. vivm were derived from logistic regression models fitted to the observed proportion of infe&ve mosquitoes as a function ofC ~HII etaZ.. 20011. seoaratelvforeachvector species. For $. malati& for &h&h there was no signifi- cant relationship between UTN coverage and sporozoite rates, a single value [taken from the results of HII et al. (ZOOl)] was assumed for the sporozoite rate for each anopheline species.
Statistical models for age-prevalence curves
The empirical age-prevalence curves were rather irregular when broken down according to categories of UTN coverage, making it difficult to compare categories and leading to uncertainties in the peak prevalences and the ages at which these prevalences were achieved. A simplified version ofthe model ofARON (1983) was fitted to smooth the estimated age-prevalence curves. This family of models was chosen empirically because it gave much better fits to the age-prevalence curves than did simple spline-smoothing techniques, although it is known that the model of anti-malaria immunity which these models estimate is not realistic (ANDERSON &
MAY, 1992).
We ignored host mortality (which is small compared with parasite turnover rates), but treated the host popu- lation as consisting of susceptible, infected and immune individuals in the proportions x: y: .z, respectively where:
dx/da =YZ - LX dy/da = Lx - 113’ dz/da =yy ~ vz
Since we justify the use of the model because of its fit to the data, rather than because the parameter estimates were meaningful, we remark here only that h was originally intended to be the force of infection, and y and Y to cluantifi anti-Darasite inununitv. To fit this model, the-boundary condition x = 1; y 4 0; z = 0 was assumed for age a = 0.5 years (to allow for maternal immunity) and the expected values of X, y, z at each subsequent age, a, conditional on the vector ofparameter estimates, were computed by numerical integration using the Adams-Gear algorithm (GEAR, 1977). The maximum likelihood solutions for the parameters h, v
and y were computed from the expected value of the age- specific prevalence, y/(x + y + z), assuming binomial errors. Possible effects of UTN coverage on the age- prevalence curves were incorporated by allowing para- meters h, y and v to vary with C. The parameters were taken to be Iinear functions of C, since preliminary analyses did not show any significant deviations from linearity. The statistical significance of effects of UTN coverage was tested using likelihood ratio (LR) tests and the most appropriate model was determined via a back- ward elimination procedure.
Conventional logistic regression analyses were also used to test the statistical significance of UTN coverage, logarithmically transformed EIR, and age as determi- nants of parasite prevalence. Models including random effects terms to allow for correlation between successive observations on the same individual indicated that such within-host correlations do not have any substantial effects on these analyses.
Results
A total of 6249 blood-slide readings were analysed, corresponding to 2355 different individuals whose house positions were geocoded and hence could be included in the analysis. I? fakiparum was found in 39-O%, P v&x in 18.8% and P. mahriae in 13*9% of these slides.
The average EIR estimate for each malaria species is shown in Table 1. Although UTN coverage is highest in the centre ofthe study area (HII et al., 2001), neither EIR estimates for l? jakiparum (Fig. 1) nor those for the other species (not shdwn)showeh iy obvious spatial pattern. Prevalence of all 3 Plasmodium snecies tended to be highest in the south-west of the study area (Fig. 2).
There was surprisingly little relationship between prevalence and the estimated EIR. The logistic regres- sion analvses indicated that the EIR estimate for l? falciparu~ was related to prevalence of this species, but prevalence increased by only a factor of 1.3 for every lo- foId increase in EIR. P. malusdue showed a similar relationshiD (Table 11. Analysis of interactions indicated that these k@ects were not-significantly dependent on either age or the UTN coverage (Table 1). There was no significant relationship between the recent EIR and prevalence of P viuax.
Prevalence of each malaria species varied by age, and in I? fulcipamm also depended &the coverage bfbednets within a 25-m radius (Fig. 3). The effect of UTN coverage was substantially- greater than that of EIR (Table 1 and Fig, 3). The effects of increasing UTN coverage on I? falciparum prevalence were highest in the younger age-groups, with only small effects in adults. There was a clear tendency for peak prevalence to decrease, and occur at a greater ag;, as UTN coverage increased. For P. vivax. UTN coveraPe had overall no statistically significant effect on prevglence, although analysis of the age-coverage interaction suggested shat coverage was associated with reduced prevalence in very young children, but possibly even an increase in pre- valence in the old. For P malariae, UTN coverage was associated with a substantial reduction in prevalence, but this reduction was not significantly age-dependent.
Indenendent of the effects of UTN coveraae and those of the l?IR, the receipt of a prescription for &imalarials in the previous month was associated with substantially lower prevalence of all 3 species.
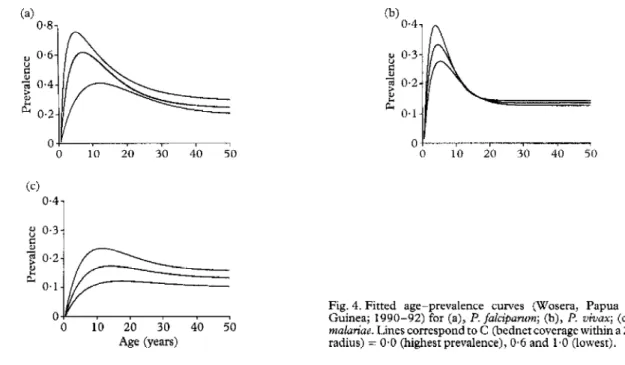
It was difficult to locate the true maxima in the age- prevalence curves (Fig. 3), since there are considerable fluctuations in them, presumably due to random varia- tion. Attempts to smooth them with non-parametric splines gave unsatisfactory results (not shbwn), but curves estimated usine the model of &ON 119831 (Firr. 4) gave good fits to-tie prevalence data. ‘Analysis Gf likelihood ratios (Table 2) indicated that the most appropriate model for P. jalcipawn was one in which h decreased with UT&I coverage, y increased with UTN coverage and v was independent of coverage. For both
Table 1. Logistic regression analysis of predictors of prevalence of malaria (Wosera, Papua New Guinea, 1990-92)
P. f&pawn P. vivax l? malariae
EIR (infective bites/person-year) Increase in prevalence with 1 O-fold increase in EIR
Mean (SD)
Test of relationship between prevalence and log (EIR)
Effect of antimalarial prescription in previous month on prevalence Test of relationship between prevalence and antimalarial prescription Test of relationship between prevalence and C Estimated OR (95% CL) LR x2 (P-value) 1 d.f. Estimated gF% CL) LR x2 (P-value) 1 d.f. LR x2 (P-value) 1 d.f. Test of age dependence LR x” of relationship of C to (P-value) prevalence 5 d.f. 35.4 (34.5) 12-l (10.9) 9-6 (8,9) 1.28 (l-10, l-50) 1.07 (0.87, 1.32) 1.32 (1.04, 1.68) 9.9 (O-002) O-3 (04) 5-2 (0.02) 0.55 (0.41, 0.75) 0.28 (0.17,0.44) 0.13 (0.05, O-36) 16.0 (< 0.00 1) 39.9 (< 0.00 1) 31.6 (< O*OOl) 90.9 (< O*OOl) 0.1 (0.7) 34.2 (< 0.001) 53.1 (< 0.001) 14.7 (0.01) 5.7 (0.3)
EIR, entomological inoculation rate; C, bednet coverage; OR, odds rario; CL, confidence limits; d.f., degrees offreedom; LR, liketihood
.!...
D>L /
kilometres j
Fig. 1. Estimated average annual EIR Ear F. falcipanrm by cluster in the Wosera area of Papua New Guinea (1990-92). Annual number of infective bites/person: (e), > 40; (a), 26 40;(Q)5-20;(0),0-5.
P. vivax and l? malariae the final model was also one in which h decreased with coverage, but for these species neither y nor Y was dependent on C. Table 3 gives parameter estimates for these models.
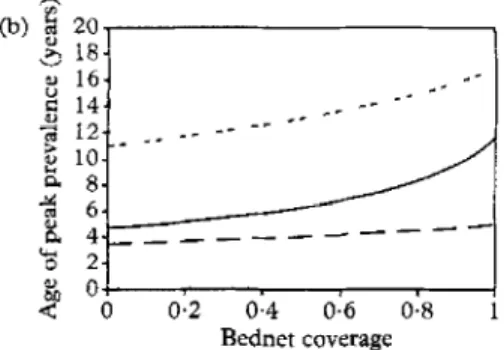
For all 3 malaria species, the peak prevalence deter- mined from the best-fitting age-prevalence curves de- creased as UTN coverage increased (Fig. 5a), whilst the age ofpeak prevalence increased (Fig. 5b). In the case of I? falciparum, the age of peak prevalence increased from 4.7 years (C = 0%) to 1 I.6 (C = lOO%), whereas there were smaller changes for P. vivax (from 3.4 to 4.9 years) and for I? malariae (11.0 to 16.8 years). For I? fakiparum the peak prevalence at 100% coverage was about half of that at zero coverage. Proportionately, the effect of UTN coverage on peak prevalence of P. malatiue was less. The age of peak prevalence for P. oivax was the lowest and this species was also anomalous in that there was minimal effect of coverage on age of peak prevalence. Figure 5c summarizes these observations as the estimated relation- ship between peak prevalence and the age of peak prevalence for each species. The strength of the peak
shift is estimated by considering first the length and then the gradient of each curve. Thus, P. falciparum showed the greatest shift, followed by l? malutiue and finally P z&ax.
Discussion
As in the nearby Madang province (CA-ITANI et al., 1986; BURKOT et aZ., 1987), spatial distributions of the major malaria vectors in the Wosera area of Papua New Guinea are highly focal (HII er aZ., 1997), and there is extreme spatial variation in malaria transmission and prevalence. Unlike in Madang, UTN coverage (C) not vector density is the main determinant of I? fakiparum and l? malariae prevalence. Neither C, nor entomologi- cally defined exposure, explained the distribution of l? vivax in the Wosera population.
Characteristically, in high-endemicity areas, varia- tions in exposure affect mainly children (MOLINEAUX
& Gwcc~~\, 1980). In keeping with this, C measures average exposure over long periods, and its effect on prevalence of I? falciparum was strikingly age-dependent (Figs 3 and 4) with the biggest differences in children aged 2-9 years. In contrast, prevalences of both I? falct’pantm and P. malariae infection were related to the estimates of EIR (which measures recent exposure) in a largely age-independent way. This finding is what we would expect if acquired immunity has little effect on infection rates, so that individual inoculations transiently add to point prevalence irrespective of the age or immunological status of the host. Slow accumulation of small effects explains why the maximum effect on prevalence is in older children. The resulting contrast in age-prevalence patterns for P. fdcz@xm between areas of low and high UTN coverage is similar to that between holo-endemic and meso-endemic villages in Senegal (RoGIER&TRAPE,~~~~).
Slow accumulation of effects on prevalence could also explain the absence of efficacy against infection of UTNs in the RCT of SNOW et al. (19 8 8). Most RCTs of ITNs in areas of high endemicity have repot-ted only modest effects on prevalence (reviewed by LENGELER, 19981, even where transmission and disease incidence were reduced substantially (DYE et al., 1996). Patterns of net distribution during a trial are necessarily different
T. SMITH ETAL.
LL!-..--..-~ _______ ^ ______ _...._ _~ ._,..._... - .-..
Fig. 2. Prevalence of parasitaemia by cluster (Wosera, Papua
New Guinea; 1990-92) for (a), R falcipanm; (b), I? wivux; (c), P. muluriue. (I), parasite positive; a), parasite negative. The area of the pies is proportional to the population registered in each cluster at the end of 199 1. Thin lines correspond to rivers
[see Hn er al. (1997) for names of villages and rivers].
from those beforehand, and randomization cannot be maintained long enough to allow estimation of effects of long-term use.
Smoothing of age-prevalence curves made it possible to visualize the shifts in age and value of peak infection prevalence associated with UTN coverage. While overall prevalence appeared as only a poor indicator of intensity of transmission (because prevalence in adults was little affected by C), age of peak prevalence and the estimated prevalence at that age were very sensitive indicators. Age and value of peak prevalence are used as measures of endemicity of several other parasites (WOOLHOUSE,
1998), but have been little used in malariology. This may be because malaria prevalence data are generally aggregated into fairly wide age-groups and stochastic
044 1 ,
0 10 20 30 40 50
Age (ye=@
Fig. 3. Observed age-prevalence curves (Wosera, Papua New Guinea; 1990-92) for (a), P. fakiparum; (b), I? &ax; (c), I? malark (O---O), C <O-16; (&-.A), 0.50 < C < 0.67; (a- *), O-84 < C, where C is the bednet coverage within a 25-m
radius. To avoid cluttering the figure, data for other values of C are not shown.
variation makes it difficult to obtain good estimates of peaks.
The extents of the peak shifts indicate the nature of acquired immunity to the 3 malaria species. Generally, when age-related data ate stratified by an exposure variable, a peak shift is evidence for exposure-dependent acquisition of immunity. In the present analysis the strongest peak shift was found for I?
fdctjmarm,
suggest- ing that exposure is the most important determinant of the rate at which immunity is acquired to this species.The early maximum in the age-prevalence curve for l? &ax together with the very limited peak shift suggests that immunity to this species is acquired very rapidly, largely independently of transmission intensity, The inoculation rate for P, viwax is high enough to ensure that most children are infected very early in life and it seems possible that immunity against parasites of this species is rapidly acquired and subsequently continually boosted by relapses. Standard treatment guidelines in Papua New Guinea do not recommend radical cure of l? v4erax and, since the relapses arise from hypnozoites, their occur- rence is little dependent on the local inoculation rate.
While the EIR for l? mdariue was similar to that of P. ti~ax, the age of peak prevalence was higher than for either of the other 2 species. This was combined with generally low infection prevalences, and a low degree of convexity in the age-prevalence profiles. Overall, these features led to an intermediate degree of peak shift, implying that exposure does play a role in the acquisition
(4 0.8 8 0.6 & -a a.4 E e, 0.2 0 k 0 10 20 30 40 50 (cl 0.4, 0
Fig. 4. Fitted age-prevalence curves (Wosera, Papua New Guinea; 1990-92) for (a), P. falciparum; (b), P. uivax; (c), P. 0 10 20 30 40 50
Age (YeaN
makviue. Lines correspond to C (bednet coverage within a 25-m
radius) = 630 (highesr prevalence), 0.6 and 1.0 (low@.
Table 2. LikeIihood ratio tests comparing the final model for age-prevalence curves with the fuIl and minimal models
Species Best-fitting model
Minimal model [all constant) LR
statistic d.f. P-value
Full mode1 (all linear) LR
statistic d.f. P-value l? fdcipamm h and y linear with C
Y constant
l? vivax 1 linear with C y, v constant
I? malariae h linear with C y, v constant
See the text for explanations of the methods used.
183.3 2 < 0.001 0.02 1 0.9
12.5 1 < O*OOl 1.4 2 o-2
49.6 1 < 0.001 1.9 2 0.2
Table 3. Parameter estimates from the final models fox age-prevalence cutves
Parameter P. falcipamm I? vivax I? malariae
h O-529-0-430 c 0*316-0,158 c 0.063-0,038 C
Y 0*060-0.022 C 0.27 1 0.143
V 0,026 0.054 0.048
Units are per year. See the text for details of the methods used. of immunity to this species, but that the level of exposure
was insufficient to confer substantial immunity.
Our results confirmed that an adequate fit of the modified ARON (1983) model does not necessarily mean that it is an appropriate description of the underlying processes. By analysing the same dataset longitudinally,
GENTON et al. (1995) estimated that the force of infection for I? falcipamm is of the order of 2 per year. This compares with an estimate of h between 0.10 (100% UTN coverage) and 0.53 (zero UTN coverage) derived from the present model. The higher rates ob- served by GENTON ef al. (1995) also accord with those estimated from longitudinal data in other highly endemic areas (BEKESSY et al., 1976; SMITH et al., 1999a). Transition rates estimated from studies of turnover of individual infections defined by polymerase chain reac- tion (PCR) are even higher (SMITH er al., 1999b).
The limited sensitivity of malaria microscopy raises a further problem with the interpretation of the simplified ARON (1983) models. Namely, that microscopy consid- erably underestimates the prevalence. PCR gives con-
siderably higher E falcdpanrna prevalence estimates in Wosera than does microscopy, especially in older in- dividuals (FELGER etal., 1995). In I? V&.X the existence of a hypnozoite stage further complicates the dynamics of peripheral parasitaemia, leading to long-term cryptic infection with recurring relapses. The model makes no attempt to capture this process. The dynamics of P malariae infection are not well understood, but this species is also known to be very frequently cryptic.
In a companion paper, analysing vector bionomics, we consider whether peculiarities ofthe local vector biology explain the impact of the UTNs (HII st al., 2001). As regards practical consequences, our results indicate that even a moderate coverage of UTNs can delay the achievement of peak prevalence and decrease the peak value for both l? fakipamm and P. nzalatiae, even when nets are not insecticide-impregnated. Even incomplete coverage of non-impregnated nets could thus have important public health implications. However, these implications, in terms of rates of malaria morbidity and mortaliry in Wosera, remain to be established.
6 T. SMITH ETAL. 01 4 0 0.2 0.4 0.6 04 1 Bednet coverage 2 0.2~- -. -_ -- -_ 0.1.- 0-l 2 7 12 17
Age of peak prevalence (years) Acknowledgements
We thank the Wosera villagers for generously participating, and the staff of Kunjingini Health Centre and the Papua New Guinea Institute of Medical Research in Madang and Maprik for technical support. Neal Alexander and Allan Schapira provided useful comments on an earlier draft. The Medical Research Advisory Committee of Papua New Guinea gave clearance. United States Agency for International Development grant no. 9365967.89 supported field and laboratory work. Swiss National Science Foundation Grants 32-43427.95 and 31-52984.97 supported data analysis and interpretation. References
Anderson, R. M. & May, R. M. (1992). In#ctius Dtieases of fr;s~tzs. Dynamics and Conrml. Oxford: Oxford University Aron, i L. (1983). The dynamics of immunity boosted by
exposure to infection. Matkemat&d Biosciences, 64,249-259. Bekessy, A., Molineaux, L. & Storey, J. (1976). Estimation of
incidence and recovery rates of Plumodium fakipontm para- sitaemia from longitudinal data. B&sin of&e World He&k Organization, 54,6&S-691.
Burkot, T. R., Graves, P. M., Cattani, J. A., Wirtz, R. A. & Gibson, F. D. (1987). The efficiency of sporozoite transmis- sion in the human malarias, Phntodium falfipawu and I? vivax. Bulletin of the World Health Organization, 65,375-380. Campbell, H., Byass, P. & Greenwood, B. M. (1987). Bed-nets
and malaria suppression. Las-z&t, ii, 859-860.
Cattani, J. A., Moir, J. S., Gibson, F. D., Ginny, M., Palno, J., Davidson, W. & Alpers, M. P. (1986). Small-area variations in the epidemiology of malaria in Madang Province. Papua New Guinea MedicaEJoumul, 29, i 1 - 17,
Dye, C., Lines, J. D. & Curtis, C. F. (1996). A test of the malaria strain theory. Parasi~oiogy Today, 12,89-90.
Wlger, I., Tavul, L., Narara, A., Genton, B., Alpers, M. &Beck, H. P. (1995). The use of the polymerase chain reaction for more sensitive detection of Plasmodium falciparum. Papua New Guinea MedtialJousnal, 38,52-56.
Gear, C. W. (1977). NPcmetial Initial V&e l+oblems in Ordinary L?afferenrialEquatins. Englewood Cliffs, New Jersey: Prentice Hall.
Genton, B., Hi;, J., Al-Yaman, F.,Paru,R., Beck, H.-P., Ginny, M., Dagoro, H., Lewis, D. & Alpers, M. P. (1994). The use of untreated bednets and malaria mfecrion, morbidity and immunity. Annals of Tropical Medicine and Par&t&~, 8, 263-270.
Genton, B., Al-Yaman, F., Beck, H.-P., Hii, J., M&or, S., Narara, A., Gibson, N., Smith, T. & Alpers, M. I?. (1995). The epidemiology of malaria in the Wosera area, East Sepik Province of Papua New Guinea, in preparation for vaccine trials. I. Malariometric indices and immunity. AmnaLF of Tropical Medicine and Para.&&~, 89,359-376.
Hii, J., Smith, T., Mai, A., Mellor, S., Lewis, D., Alexander, N.
(b)
Bednet coverage
Fig. 5. Relationships between peak malaria prevalence, age of peak prevalence and bednet coverage (Wosera, Papua New Guinea; 1990-92), for different Plasmodium species. (a) Peak prevalence by bednet coverage; (b) age of peak prevalence by bednet coverage; (c) peak prevalence by age ofpeak prevalence. (-), I? fakipamm; (- -), P. tivax; (- - -), P. m&&e.
& Aipers, M. P. (1997). Spatial and temporal variation in abundance of AnuphLs species (Diptera: Culicidae) in a malaria endemic area in Papua New Guinea. Journal of Medical Entomology, 34,2 12-Z 17.
Hii, J, L. K., Smith, T.,Vounatsou, P., Alexander, N., Mai, A., Ibam, E. & Aipers, M. P. (200 1). Area effects ofbednet use in a malaria-endemic area in Papua New Guinea. Trunzactiom of rhe Ruyd Society of Tropi>al Medicine and Hygiene, 95,7- 13. Iengeler, C. (1998). Insecticide-treated bednets and curtains for malaria control. In: Infectious Diseases Module of ne CockraneDatabaseofSystematic Reviews, Garner, P., Gelband, H., Olliaro, P. & Sahnas, R. (editors). Oxford: The Cochrane Collaboration.
Lindsay, S. W. & Gibson, M. E. (1988). Bednets revisited-otd idea, new angle. Para.sit&y Today, 4{IO), 270-272. Molineaux, L. & Gramiccia, G. (1980). The G&k l+ojecz.
Research on the Epidemiolu~ and Con& of Malaria in the Sudan Sawanna of West Africa. Geneva, Switzerland: World Health Organization.
Roder, C. & Trape. J.-F. (1995). Etude de l’acsuisition de la pr&unition enzones d’holo- et de meso-endemie palustre d Dielmo et B Ndiop (Senegal): resultats preliminaires, 1990-
1994. M&xine Tropic& 55 (4 supplement), 71-76. Sapak, P., Garner, I’., Baea, M., Narara, A., Heywood, I’. &
Alpers, M. (1991). Ineffectiveness of amodiaquine against Plasmodium falcipatum malaria in symptomatic young chil- dren living in an endemic malarlous area of Papua New Guinea. 3ourncd of Tropical Paediattics, 37, I-6.
Smith, T., Charlwood, J. D., Takken, W., Tanner, M. 81 Spiegelhalter, D. (1995). Mapping the densities of malaria vectors within a single village. Acta Tropica, 59, 1 - 18. Smith, T., Beck, H.-P., Kitua, A., Mwankusye, S., Felger, I.,
Fraser-Hurt, N., It-ion, A., Alonso, P., Teuscher, T. & Tanner, M. (1999a). Age dependence of multiplicity of Pkwmodium fakipamcm infection and of other malariological indices in an area of high endemicity. Transactions of the Royal Society of Tro&ai Medicine and Hyg&ne, 93, supplement I, S 1 i 15-S1120.
Smith, T., Felger, I., Fraser-Hurt, N. &Beck, H.-P. (1999b). Effects ofinsecticide-treated nets on the dynamics ofmultiple Plasmodium fukipawm infections. Transa&ns of rhe Royal So&y of TtbpicaalMedicdne and Hygikne, 93, supplement 1, Sli 53-51157.
Snow, R. W., Rowan, K. M., Lindsay, S. W. & Greenwood, B. M. (1988). A trial of bed nets (mosquito nets) as a malaria control strategy in a rural area of The Gambia, West Africa. Transactions of the RcryQI Society of Tropical Medicine and Hygiene, 82,212-215.
Woolhouse, M. E. J. (1998). Patterns in parasite epidemiology: the peak shift. Parasitology Today, 14,42&434.
Received 8 September 1999; revised 16~une 2000; accepud for publication 20 June 2000