Spatial Statistics of the Cytoskeleton
Martin Hanf1·2, Heinrich Walt3, Thomas Leemann2, Diethelm Würtz1JSwiss Center for Scientific Computing, Zürich
2Institut für Biomedizinische Technik und Medizinische Informatik, Universität/ Zürich 3Forschungsabteilung Gynäkologie, Departement für Frauenheilkunde,
Universitätsspital Zürich ABSTRACT
The three dimensional structure of the various types of cy-toskeletal filaments (CSK) constitutes the cell's shape äs well äs the interior organization of cell organelles. Since changes in the numerous phases of cells towards neoplastic transformations are known to affect the morphology of the cell it can be assumed that these mo hological changes can be quantitatively described by means of the cy toskele-ton. Thus the investigation of the structural organization of the cytoskeletal meshwork appears to be a promising ap-proach to develop new quantitative methods for histopa-thology.
The development of the confocal laser scanning micro-scope (CLSM), which are experienced since the eighties from merely a concept to a versatile and powerful tool in science and in daily practical use. Together with the avail-ability of specific immunological markers for the CSK pro-teins, the CLSM opened up the way for the analysis of the 3-D structure of this fascinating cell constituent.
The complex meshwork of the cytoskeleton reveals a wide variety of patterns, demanding an appropriate description to cover its genuine properties for a quantitative analysis. In this paper we show that the CSK can be modelled with spatial point and area processes and present the statistical methodology for its structural analysis.
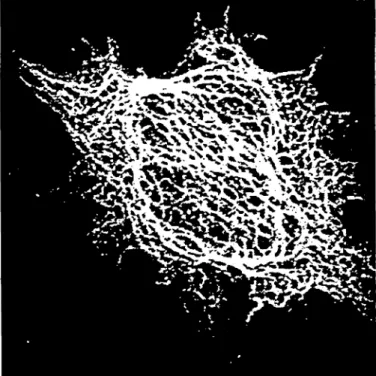
Figure 1: Projection ofa CLSM Image ofthe cytoskel-eton. Image provided by Prof. Komitowski, Division Histodiagnostic and Palhomorphological Documenta-tion, German Cancer Research Center, Heidelberg, Germany.
GRAPH REPRESENTATION OF THE
CYTOSKELE-TON
The thickness of CSK fibers ränge from 4 nm (actin fila-ments), 10 nm (intermediate filaments) to 25 nm (microtu-bules). Therefore these structures can not be resolved perfectly with confocal laser microscopy, which provides a axial resolution of about 230 nm for a wavelength of 442 nm [1]. Consequently, any direct measurement on the spa-tial distribution of structures by means ofthe density of flu-orescence dye attached to the CSK fibers can not be regarded reliable. However, whereas the thickness and the number of fibers in a bündle can not be conclusively deter-mined, the length ofthe filaments and the overall structural organization of the meshwork can serve äs a basis for an analysis.
Figure 2: Graph representalion of the skeletonized CLSM Image (Figure 1).
The topological properties of the meshwork can be de-scribed adequately in terms of graph theory, representing the structures äs a graph G(V,E) with the sets of vertices V and edges E. Figure 2 shows the graph of the cytoskeleton äs extracted from figure 1. Weighting the edges corre-sponding to their length we yield a planar, undirected and
weighted graph.
A variety of properties like the distribution of the degrees of vertices, i.e. the number of edges of a vertex, are now available for classification purposes [2]. Here we like to present an analysis based on the cycle basis of the graph, which is defined äs the set of elemeniary and independent cycles, such that any other cycle can be written äs a linear combination ofthe cycle basis [3],
SPATIAL PROCESSES
Although phenomenological parameters like the degree of the vertices can be easily defined on the graphs, their rele-vance for the analysis of the CSK is not given a priori. A more fundamental approach is to model the structures of interest and to apply statistical tests to investigate the sig-nificance of the properües found. Spatial point and area processes are a natural choice for the modelling of the ex-perimental data, since they allow in principle to incorpo-rate a priori Knowledge of pattern formation process of the CSK.
However, before considering detailed and worked out hy-potheses on the underlying processes which form the struc-ture of the cytoskeletal meshwork, it is obvious to Start with the most basic Poisson process. This process is de-fined by the following properties [5]:
l.) The number of points in any given set has a Poisson dis-tribution mean.
2.) The counts in disjoint sets are independent.
Thus, the poisson process serves äs an idealized represen-tation of complete spatial randomness (CSR).
Point processes are able to model the spatial distribution of the vertices or center points of enclosed areas, but they can not capture the topological properties of the CSK graph. However, using the Dirichlet tessellation, we can trans-form the point processes to patterns which resemble the CSK graphs and can apply a Statistics based on the cycle basis which is particularly sensitive to periodic or regulär spatial structures. A detailed introduction and analysis of this test is given in [4].
RESULTS
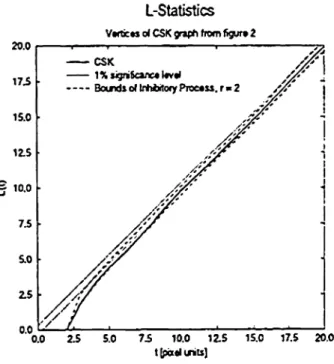
Figure 3 shows Ripley's L-Statistics which is based on the expected number of points within diameter t (in pixel units) around any other point [5].
L-Statistics
V«tic*j et CSK graph ftom Sgw» t
20.0
Bouidioftnh&toryPfOctss.r·^ ///
0.0 2.5 5.0 IS 10.0 12.5 15.0 17.5 20.0 t(paelinitt]
Figure 3: Ripley's L-Statistic for the CSK graph offig-ure 2.
The experimental data deviates significantly from the CSR hypothesis only for diameters t < 5. However, since the vertices of the graph are restricted to an image grid, it is ob-vious, that vertices'can not be closer than 2 pixel units
without losing the property of being different vertices. Thus, this deviation has to be regarded äs an artefact of sampling process. Considering an 'inhibitory random process' which does not allow two points within the given radius is able to model this artefact.
Figure 4 shows the Cycle Base Statistics results for the same data. Though also this test does not show significant deviation from the null hypothesis of complete spatial ran-domness, some structure in the distribution of the perime-ters of the cycles is apparent, suggesting periodicity in the data.
Cycle Basis
r«duc«d graph o( CSK frotn figur· 2 0.14 smooCtwd di jtntxibon. vnrxjow 112« 5 2 »igitu band o»» Poilson proctu
0.00
0 25 » 75 100 125 150 175 200 P*(im«t*f ( · imitsj
Figure 4: Cycle Basis-Statistics for the CSK graph of figure 2.
CONCLUSION
Both tests show that the data analysed in this study can be modelled by a Poisson process within the chosen signifi-cance level of 99%. Deviation from the null hypothesis of a complete spatial random process can be attributed to sampling artefacts due to the image grid.
Although the choice of the significance level is arbitrary, a reliable classification of the cytoskeletal meshwork for di-agnostic purposes demands a significant deviation from a random process. According to the given data, the usage of the CSK structures äs a basis for diagnosis is a task which has to be performed carefully.
REFERENCES
[1] Wilson T., 1990, Confocal Microscopy, Academic Press Inc., London
[2] Karnaoukova, S., 1995, Zur Strukturanalyse des
Zy-toskeletts, Dissertation, Universität Heidelberg und Deutsches Krebsforschungszentrum (DKFZ) Heidel-berg
[3] Berge, C., 1973, Graphs and Hypergraphs, Norm-Hol-land Publishing Company Amsterdam
[4] Hanf, M. 1996, On the Spatial Statistics of the Cy-toskeleton, Dissertation, to be submitted to
Zürich
[5] Ripley, B.D, 1981, Spatial Statistics, Wiley, New York