HAL Id: cea-02442307
https://hal-cea.archives-ouvertes.fr/cea-02442307
Submitted on 16 Jan 2020HAL is a multi-disciplinary open access
archive for the deposit and dissemination of sci-entific research documents, whether they are pub-lished or not. The documents may come from teaching and research institutions in France or abroad, or from public or private research centers.
L’archive ouverte pluridisciplinaire HAL, est destinée au dépôt et à la diffusion de documents scientifiques de niveau recherche, publiés ou non, émanant des établissements d’enseignement et de recherche français ou étrangers, des laboratoires publics ou privés.
the osiris material reactor
F. Malouch, F. Lopez
To cite this version:
F. Malouch, F. Lopez. Validation of the neutron calculation tool anubis v3 for the osiris material reactor. RRFM/IGORR 2016 - the European Research Reactor Conference will be jointly organised with IGORR, the International Group Operating Research Reactors, Mar 2016, Berlin, Germany. �cea-02442307�
VALIDATION OF THE NEUTRON CALCULATION TOOL ANUBIS V3
FOR THE OSIRIS MATERIAL REACTOR
Fadhel MALOUCH
(*), Franck LOPEZ
Den-Service d’études des réacteurs et de mathématiques appliquées (SERMA), CEA, Université Paris-Saclay, F-91191 Gif-sur-Yvette, France
ABSTRACT
ANUBIS is a deterministic calculation scheme, based on the 2D transport code APOLLO2 and the 3D-diffusion code CRONOS2, developed for the simulation of the OSIRIS Material Testing Reactor (CEA-Saclay Center). To enhance the tool performances, several improvements have been implemented in the version 3 ANUBIS V3, in particular for the cross sections library generation using a 2D full core transport computation to feed the 3D diffusion calculation. ANUBIS V3 has been validated against TRIPOLI-4® Monte Carlo calculations and experimental results.
1.
Introduction
OSIRIS is a material testing reactor located at the CEA-Saclay center and operated from 1966 to 2015. A specific neutron simulation tool, called ANUBIS, was developed for the reactor operation-safety calculations. ANUBIS is a deterministic calculation scheme based on the 2D-transport code APOLLO2 and the 3D-diffusion code CRONOS2 (developed by CEA).
The OSIRIS core contains different types of elements: 38 standard fuel elements, 6 control elements (hafnium absorber in upper part and fuel “follower” in lower part), up to 7 beryllium elements (reflector), MOLY devices, water boxes for in-core experiments, etc. The wide variety of core configurations and their relative heterogeneity make the core difficult to simulate with traditional methods (transport-diffusion calculation scheme). Indeed, the classical approach used to generate the homogenized cross-sections library that are needed in the 3D diffusion core calculation is based on a fuel assemblies modeling in 2D infinite lattice, the depletion calculation being performed with a 281-group transport calculation. Although this assumption appears justified in large PWR where a major proportion of assemblies are surrounded by similar ones (fundamental mode approximation), this is not the case in the OSIRIS reactor where each assembly is always surrounded by different element.
Therefore, we intend to improve the diffusion core calculation by taking into account the neighborhood of each fuel element in the cross section generation. Several improvements have been implemented in the version 3 of ANUBIS (ANUBIS V3), in particular for the generation of the cross sections library within a 2D full-core configuration (at the neutron transport stage using APOLLO2).
ANUBIS V3 has been validated using the TRIPOLI-4® Monte Carlo code (developed by CEA) and experimental results issued from OSIRIS operation. The reactivity and the power distributions obtained with ANUBIS V3 and TRIPOLI-4® were compared for a set of realistic configuration of OSIRIS reactor. Measurements of control rods efficiency, neutron flux in fuel and neutron flux in experimental locations were performed in the ISIS reactor which is the
(*) Corresponding Author (fadhel.malouch@cea.fr)
mock-up of OSIRIS. The method of cross sections library generation within full core configurations gives satisfactory results on both reactivity and power map comparisons. In this paper, we present first the OSIRIS reactor and the ANUBIS V3 calculation scheme. Then, we detailed the recent improvement of the cross sections library generation within a 2D full-core configuration (neutron transport stage). Finally, we present the main results of the Monte-Carlo and the experimental validation.
2.
OSIRIS MTR reactor
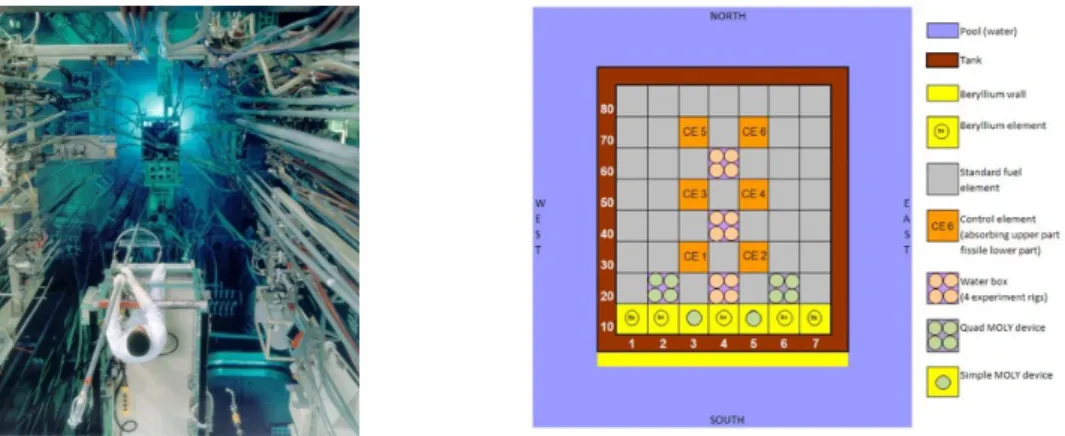
OSIRIS is a material testing reactor located at the CEA-Saclay site and operated from 1966 to 2015. It is a 70 MWth pool type light water reactor with an open core (Fig. 1.).
Fig 1. View of the OSIRIS reactor (left) and radial cross-section of the OSIRIS core (right) The core is a compact unit (70×80×90 cm3). The core tank contains a centrally located rack
containing 56 cells of 8×8×90 cm3 each one. These cells are loaded with 38 standard fuel
elements, 6 control elements (hafnium absorber in upper part and fuel “follower” in lower part) and up to 7 beryllium elements (in row 10, south side). The remaining cells (in particular 24, 44 and 64) are dedicated to in-core experiments with high fast neutron flux (about 2×10¹⁴
n.cm-2.s-1).
3.
Neutron calculation scheme
The OSIRIS reactor is constituted of a large amount of different elements (core, reflector, experimental setup…) which can be present or not in normal operation. This wide variety of core configurations and their relative heterogeneity make the core difficult to simulate with traditional methods (transport-diffusion calculation scheme). Indeed, the classical approach used to generate the homogenized cross-sections library that are needed in the 3D diffusion core calculation is based on a fuel assemblies modeling in 2D infinite lattice, the depletion calculation being performed with a 281-group transport calculation. Although this assumption appears justified in large PWR where a major proportion of assemblies are surrounded by similar ones (fundamental mode approximation), this is not the case in the OSIRIS reactor where each assembly is always surrounded by different element. Therefore, we intend to improve the diffusion core calculation by taking into account the neighborhood of each fuel element in the cross section generation. The ANUBIS V3 computation scheme can be divided into three distinct phases.
3.1 Phase 1: Depletion calculation of fuel assemblies at nominal temperature
First we calculate the depletion of fuel assemblies (standard and follower) in 2D infinite lattice and save the composition of fuel medium for each depletion step. The transport calculation is performed with the MOC linear solver of APOLLO2-8.4 with 281 energy groups, with critical leaks, and a degree 1 of cross-sections anisotropy.
Fig 2. Quarter geometry (generated by SILENE) of standard fuel assembly (left) and follower fuel assembly (right): fuel in red, water in blue, boron in yellow, aluminium in grey
3.2 Phase 2: Media recovery for core calculation with chosen temperatures
For each assembly present in the actual core being studied, the fuel media composition is read as a function of the burnup in the database generated in Phase 1. A 2D infinite lattice transport calculation is performed for each assembly with the actual fuel and moderator temperatures. The computed flux (281 energy group) is then used to spatially homogenize each assembly into four macro media.
In a second step, a 2D transport calculation is performed on a 2D core geometry in which each fuel assembly is modeled by four macro media. The flux computed is used to generate a 6-group cross-section library with different cross-section values for elements in different location. The transport calculation is performed with the MOC linear solver of APOLLO2-8.4 with 281 energy groups, with axial leaks, and a degree 3 of anisotropy. An equivalence Transport-Diffusion is performed at the end of transport calculation in order to generate a set of equivalence coefficients for each calculation configuration.
3.3 Phase 3: Core calculation in 3D Diffusion
The 6 energy groups cross sections library is read by CRONOS2.12 and used to calculate the core (both static and depletion calculation) in 3D diffusion with a dual finite mixed element method. The description of fuel assemblies is similar to macro-regions used in APOLLO2 transport 2D calculation. The choice of the right cross-section library to use for a given rod configuration is performed vertically. For instance, if rod 3 is down, rod 4 is half extracted and rod 6 is ¾ extracted, we’ll use a set of 3 cross-section library to describe each area (configuration rod 3 down for first area, rod 3 and 4 down for next area and rod 3, 4 and 6 down for last area).
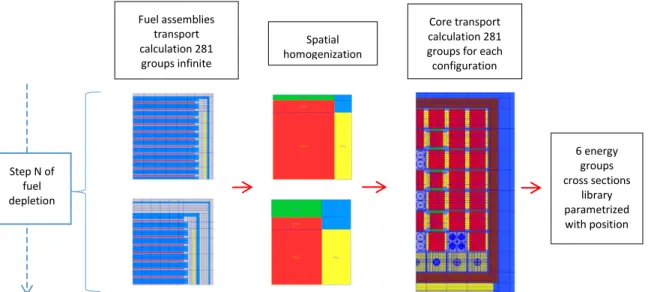
Fig 3. Schematic layout for assemblies recovering within the full core geometry for cross section library generation
Fuel assemblies transport calculation 281 groups infinite Spatial homogenization 6 energy groups cross sections library parametrized with position Core transport calculation 281 groups for each configuration
Step N of fuel depletion
4.
Monte Carlo Validation with TRIPOLI-4®
The reactivity and 2D power distributions obtained with ANUBIS V3 (3D, 6 groups diffusion) and TRIPOLI-4® [3] (3D continuous-energy Monte-Carlo code) were compared for a set of
realistic configuration of OSIRIS reactor. Two effective cycle were chosen for this depletion comparison (F192 2T and F185 3T). A large amount of realistic rod configurations were modeled starting from three control rods down to all control rods up (for a total of 20 configurations calculated). In the following, “34d6h” means that control rods 3 and 4 are down and 6 is halfway up, other rods being up by default.
4.1 Reactivity
Two effective cycle were chosen for this comparison (F192 2T and F185 3T). A large amount of realistic rod configurations were modeled starting from three control rods down to all control rods up (for a total of 20 configurations calculated).
*34d6h means rods 3, 4 are down, rod 6 is half extracted and others are up
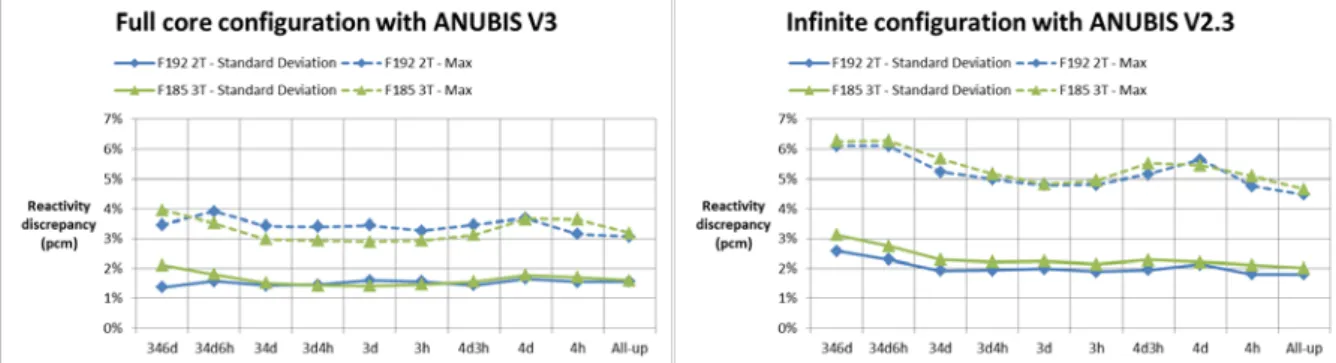
Fig 4. Reactivity discrepancies between ANUBIS V3 (and V2.3) and TRIPOLI-4® reference calculations (statistical uncertainties 1σ around 6 pcm) for a wide variety of realistic control
rods configurations for two representative cycles
We obtain a good agreement between ANUBIS V3 calculations and TRIPOLI-4® reference calculations (Fig 4). Indeed all the discrepancies lay between -200 and -25 pcm for all realistic core configurations (2T and 3T) which is very satisfactory (the initial goal for the scheme was +/- 1000 pcm). In comparison, calculations with infinite configuration generation of cross-section libraries (with ANUBIS V2.3) were conducted for both cycles and show reactivity discrepancies between -1016 pcm and -629 pcm.
4.2 2D power map per assembly
The power per assembly relative discrepancies are below 4.0% for all realistic core configurations with a standard deviation around 1.6% (Fig 5). In comparison, calculations with infinite configuration generation of cross-section libraries (with ANUBIS V2.3) show discrepancies below 6.3% with a standard deviation around 2.3%.
*34d6h means rods 3, 4 are down, rod 6 is half extracted and others are up
Fig 5. Power per assembly relative discrepancies between ANUBIS V3 (and V2.3) and reference
4.3 2D power map per plate
CRONOS2 yields the power in each mesh cell as a second order polynomial function in directions X and Y. Although the fuel plates are not explicitly described in CRONOS2, we can compute the power distribution within an assembly by interpolating the polynomial function. We calculate a map of 22 plates x 4 subdivisions power values per standard assembly and 17 plates x 4 subdivisions power values per follower assembly for a total of 3752 power values. We present here the “All-rods-up” configuration for F192 cycle.
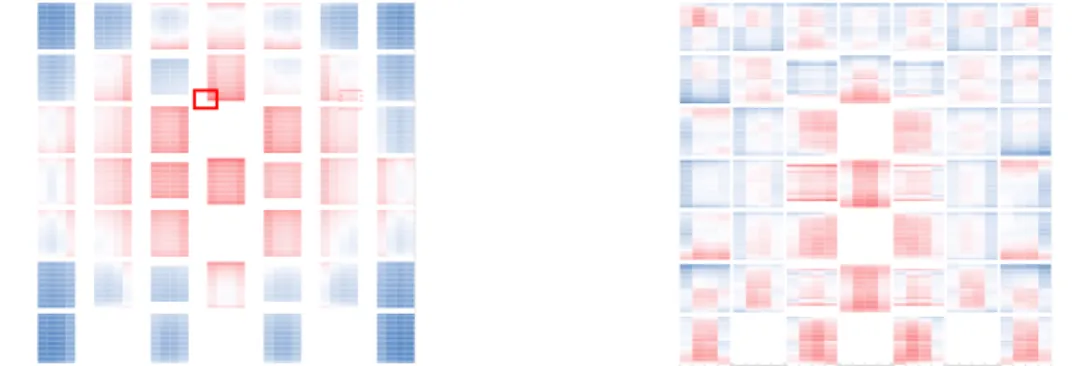
Fig 6. 2D power map plate per plate (left) and map of relative discrepancies between ANUBIS V3 and TRIPOLI-4® (right)
The power peaking factor is located in the bottom left corner of assembly 74 in both ANUBIS V3 and TRIPOLI4 calculations. It is materialized by a red square in Fig 6. The relative discrepancy at the power peaking factor between the 3D diffusion calculation and the Monte Carlo reference calculation is +3.4%. The relative discrepancies lay between -10% and +7% with a standard deviation of 2.2%. The largest discrepancies are obtained in low power area.
5.
Experimental Validation
5.1 Control Rods Efficiencies
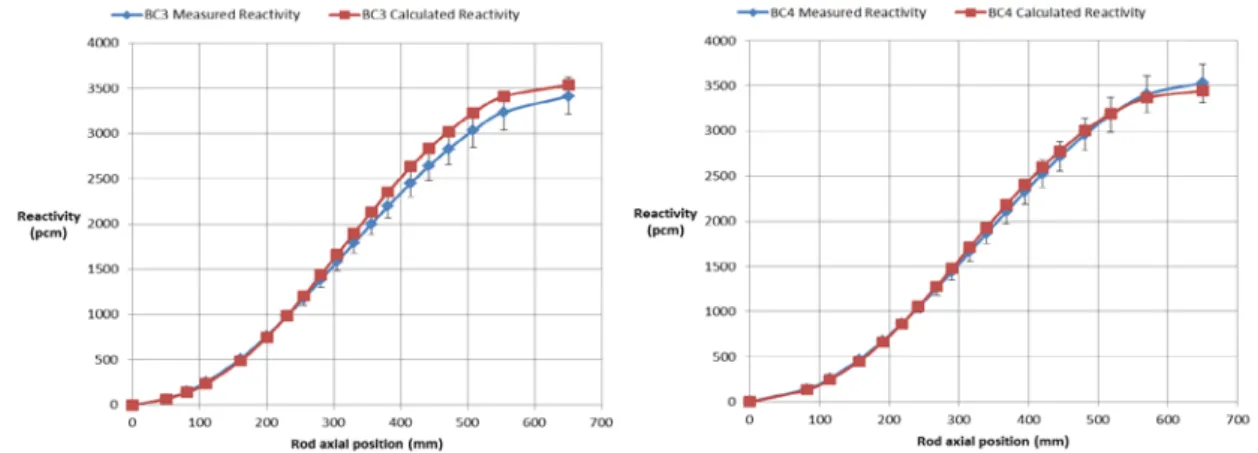
We present here the validation of the control rods efficiency. These rods are the two central rods which are used in reactor operation (3 and 4) and the North-West rod (6) used for reactor divergence. The calculation shows a good agreement with the measurements with relative discrepancies on the integral efficiency of +3% and -2% for control rod 3 and 4 respectively (Tab 1). The relative discrepancy for the end of control rod 6 is -26% but represents only -122 pcm. The measure uncertainties have been evaluated to 6% at 1 sigma. Moreover the calculation shows a very good agreement with the reference TRIPOLI-4® calculation for all control rods with relative discrepancies below 2%.
Control Rod Measured Intregral Efficiency (pcm) TRIPOLI-4 Calculated Integral Efficiency (pcm) C-T4/M ANUBIS-V3 Calculated Integral Efficiency (pcm) C-A3/M C-T4/C-A3 end of BC6 475 354 0.74 353 0.74 1.00 BC3 3420 3543 1.04 3537 1.03 1.00 BC4 3530 3501 0.99 3445 0.98 0.98 Total 7425 7398 1.00 7335 0.99 0.99
The Fig 7 shows the axial efficiencies profiles of rods 3 and 4 measured and calculated with ANUBIS V3. The profiles in “S” are well reproduced by calculation and stay in the margin of 1 sigma of measurement uncertainty.
1 sigma error bar
Fig 7. Control rods efficiency measured and calculated with ANUBIS-V3 with axial position around criticality
5.2 Gap to criticality in exploitation
For most of the cycles conducted in OSIRIS reactor, the historic of control rods position was recorded and could be used to simulate a major part of the reactor life.
We decided to simulate several cycles which represent a wide variety of reactor configurations. By fixing the control rods positions, we can verify that the computed reactivity is closed to criticality. The calculation of 37 cycles (more than 4 years of exploitation) is obtain with 426 calculated points and is presented in Fig 8. It shows gaps to criticality between -632 pcm and +549 pcm which is satisfactory and consistent with the objective of calculation scheme (+/- 1000 pcm). The average value is -34 pcm with a standard deviation of 298 pcm (99% are below 2 sigma). We have to remind that sources of uncertainty are plenty, due to the large amount of input data necessary to simulate more than 4 years of exploitation (loading maps, control rods positions, power levels, experimental loads, etc).
Fig 8. Gap to criticality during irradiation for 4.4 years of exploitation and its distribution around criticality
6.
Conclusion
The method of cross sections library generation within full core configurations gives satisfactory results on reactivity, power map distribution, thermal flux in fuel assembly, and thermal and fast flux in experimental locations for both verification and validation (flux comparisons not shown on this paper). Moreover the comparison with traditional infinite lattice calculation method shows major improvements on reactivity and power map distribution. Further flux comparisons in experimental locations should be conducted with OSIRIS reactor in order to reduce the uncertainty on power level which is not well known in ISIS reactor.
7.
References
[1] R. Sanchez et al., “APOLLO2 year 2010,” Nucl. Eng. Technol., Vol. 42, No. 5, 2010, pp. 474-499.
[2] Lautard et al., 1990, Lautard J.J., Loubière S., Fedon-Magnaud C., “1990. CRONOS2, a modular computational system for neutronic core calculations”, IAEA Specialist Meeting on Advanced Calculational Methods for Power Reactors, Cadarache, France.
[3] E. Brun, F. Damian, C.M. Diop, E. Dumonteil, F.X. Hugot, C. Jouanne, Y.K. Lee, F. Malvagi, A. Mazzolo, O. Petit, J.C. Trama, T. Visonneau, A. Zoia, “TRIPOLI-4®, CEA, EDF and AREVA reference Monte Carlo code”, Annals of Nuclear Energy, Volume 82, August 2015, Pages 151–160