HAL Id: tel-02532715
https://tel.archives-ouvertes.fr/tel-02532715
Submitted on 6 Apr 2020HAL is a multi-disciplinary open access archive for the deposit and dissemination of sci-entific research documents, whether they are pub-lished or not. The documents may come from teaching and research institutions in France or abroad, or from public or private research centers.
L’archive ouverte pluridisciplinaire HAL, est destinée au dépôt et à la diffusion de documents scientifiques de niveau recherche, publiés ou non, émanant des établissements d’enseignement et de recherche français ou étrangers, des laboratoires publics ou privés.
Matteo Cerruti
To cite this version:
Matteo Cerruti. High-Energy emission from Active Galactic Nuclei. High Energy Astrophysical Phenomena [astro-ph.HE]. Université de Paris 7 - Denis Diderot, 2012. English. �tel-02532715�
Universit´e de Paris-7 Denis Diderot Observatoire de Paris-Meudon Laboratoire Univers et Th´eories (LUTH)
Ecole Doctorale d’Astronomie et Astrophysique d’Ile-de-France
High-Energy emission from
Active Galactic Nuclei
PhD Thesis
Defended by :
Matteo CERRUTI
Before the jury composed by:
President:
Etienne PARIZOT
Referee:Laura MARASCHI
Referee:
Frank RIEGER
Gilles HENRI
Benoît LOTT
Supervisor:
Catherine BOISSON
Supervisor:
Andreas ZECH
iii
E quando dottore lo fui finalmente, non volli tradire il bambino per l’uomo.
Un medico Non al denaro, non all’amore né al cielo Fabrizio De André
Contents
Introduction xix
0.1 Active galactic nuclei . . . xix
0.1.1 The discovery of quasars . . . xx
0.1.2 The AGN zoo . . . xxi
0.1.3 The unification model . . . xxiii
0.1.4 Silent super-massive black holes . . . xxiv
0.2 TeV astronomy . . . xxv
0.2.1 The current generation of IACTs . . . xxviii
0.2.2 The future of TeV astronomy . . . xxix
I
Radio-quiet active galactic nuclei
1
1 Seyfert 1 galaxies and the problem of the soft excess 3 1.1 Introduction . . . 31.2 Seyfert galaxies . . . 3
1.2.1 Type 1 and type 2 . . . 4
1.3 The X-ray spectrum of Seyfert 1 galaxies . . . 6
1.3.1 The X-ray continuum . . . 6
1.3.2 The Fe Kα line and the Compton bump . . . 7
1.3.3 The soft X-ray excess . . . 8
1.3.4 The warm absorber . . . 10
1.4 The X-ray spectrum of Seyfert 2 galaxies . . . 12
2 Suzaku broad-band observations of Mrk 509 and Mrk 841 13 2.1 Introduction . . . 13 2.2 Data reduction . . . 16 2.2.1 Contaminating source: PKS 1502+106 . . . 17 2.3 Data analysis . . . 18 2.3.1 Light Curves . . . 18 2.3.2 Soft Excess . . . 22 2.3.3 Fe Kα emission line in Mrk 841 . . . 23 2.3.4 Hard Excess . . . 23
2.4 Modelling of the broad-band spectrum . . . 25
2.4.1 Double Comptonisation model . . . 25
2.4.2 Blurred reflection model . . . 28
2.4.3 Smeared absorption model . . . 29
2.5 Discussion . . . 30
II
Radio-loud active galactic nuclei
39
3 Blazars and emission models 41 3.1 Introduction . . . 41 3.2 Blazars . . . 41 3.3 Leptonic models . . . 44 3.3.1 Synchrotron-Self-Compton (SSC) . . . 45 3.3.2 External-Inverse-Compton (EIC) . . . 46 3.4 Hadronic models . . . 463.5 The TeV horizon . . . 48
4 Blazars at TeV with H.E.S.S. 51 4.1 Introduction . . . 51
4.2 The High Energy Sterescopic System (H.E.S.S.) . . . 51
4.2.1 The ATOM optical telescope . . . 53
4.3 H.E.S.S.data analysis . . . 54
4.3.1 Comparison of different analysis chains . . . 59
4.4 The round-up of H.E.S.S. AGN . . . 60
4.4.1 Radio-galaxies . . . 60
4.4.2 FSRQs . . . 62
4.4.3 LBLs . . . 63
4.4.4 HBLs . . . 64
4.4.5 Latest H.E.S.S. results on blazars . . . 66
4.5 Upper limits on undetected AGN . . . 72
5 A specific case : 1RXS J101015.9 - 311909 75 5.1 Introduction . . . 75
5.2 Detection of TeV emission with H.E.S.S. . . 76
5.2.1 Spectral and temporal analysis . . . 77
5.3 Multi-wavelength data . . . 79
5.3.1 Fermi . . . 79
5.3.2 Swift-XRT . . . 82
5.3.3 Swift-UVOT . . . 86
5.3.4 ATOM. . . 87
5.4 Modelling of the spectral energy distribution . . . 89
6 Constraining the SSC model parameters 93 6.1 Introduction . . . 93
6.2 The current status of the SSC-model constraints . . . 93
6.3 A new numerical algorithm . . . 98
6.4 Applications . . . 101
6.4.1 1RXS J101015.9 - 311909 . . . 102
CONTENTS vii
7 Development of a new lepto-hadronic code 119
7.1 Introduction . . . 119
7.2 Leptonic processes . . . 120
7.2.1 Primary electron distribution . . . 120
7.2.2 Synchrotron emissivity . . . 121
7.2.3 Inverse Compton emissivity . . . 122
7.2.4 Linear interpolation . . . 125
7.2.5 Pair-production absorption coefficient . . . 125
7.2.6 Pair injection and cooling of secondary particles . . . 126
7.3 Hadronic processes . . . 129
7.3.1 Implementation of SOPHIA . . . 129
7.3.2 Pair cascade . . . 130
7.3.3 Synchrotron emission from muons . . . 131
7.3.4 Bethe-Heitler pair production . . . 133
7.4 Physical constraints . . . 133
7.5 Applications . . . 134
7.5.1 Mrk 421 . . . 135
7.5.2 PKS 2155-304 . . . 137
8 On the spectral break in the GeV spectrum of 3C 454.3 145 8.1 Introduction . . . 145
8.2 The Fermi-LAT result . . . 145
8.3 External inverse Compton on the Lyα line . . . 148
8.4 Modelling of the SED . . . 149
A Perspectives of detection of high redshift blazars with CTA 155 A.1 Introduction . . . 155
A.2 Detection of steady-state blazars . . . 156
A.3 Detection of flaring blazars . . . 156
B List of publications 159
List of Figures
1 The Seyfert 1 galaxy MCG - 6 - 30 - 15. . . xxi
2 Example of the different morphology observed in radio-galaxies. . . xxii
3 Direct imaging of the dust torus in an active galactic nucleus. . . xxiii
4 Simplified scheme of the unified model of active galactic nuclei. . . xxiv
5 Motion of stars around SgrA?. . . xxv
6 The Fermi bubbles. . . xxvi
7 Diagram of the detection technique of Cherenkov telescopes. . . xxvii
8 Diagram of the production of Cherenkov light. . . xxvii
9 The MAGIC and VERITAS telescopes. . . xxix
10 H.E.S.S.II . . . xxix
11 The CTA observatory. . . xxx
12 The GATE prototype. . . xxxi
1.1 Example of optical and UV spectra from different Seyfert galaxies. . . 5
1.2 Polarization observation of Seyfert 2 galaxies. . . 6
1.3 Fe Kα emission line in NGC 3783 . . . 7
1.4 Example of six different soft X-ray excess in Seyfert 1 galaxies. . . 9
1.5 Schema of the different models explaining the soft X-ray excess. . . 10
1.6 Ionized absorption model for the soft-X-ray excess . . . 10
1.7 Schema of the visible-to-X-ray emission observed in Seyfert 1 and Seyfert 2 galaxies. . . 11
2.1 Suzaku/XIS0 image of Mrk 841 (first observation). . . 15
2.2 PKS 1502+106 spectrum as seen by Suzaku . . . 18
2.3 Mrk 509and Mrk 841 Suzakulight curves. . . 19
2.4 XISdata between 3 and 10 keV of the sum of Mrk 509 and Mrk 841 observations. . . 19
2.5 Mrk 509and Mrk 841 soft excess . . . 20
2.6 Contour plots of line-flux versus line-energy (source frame) for the narrow emission Gaussian line in Mrk 841. . . 24
2.7 Hard X-ray excess of Mrk 509 and Mrk 841, as view by Suzaku. . . 25
2.8 Ratio plot obtained for the fit of Mrk 509 data with a blurred reflection model with or without a broad emission Kα line . . . 29
2.9 Mrk 509broad-band fit for the three different models considered. . . 37
2.10 Mrk 841 broad-band fit for the three different models considered. . . 38
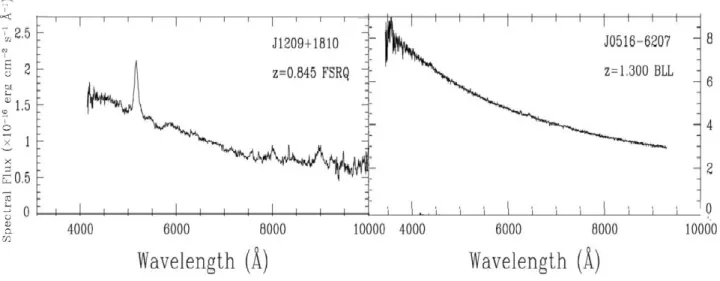
3.1 Example of optical spectra of blazars. . . 42
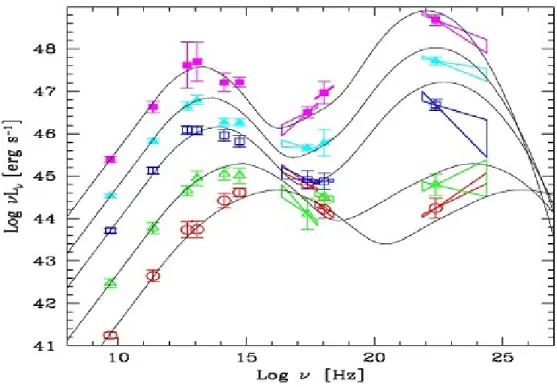
3.2 The so-called blazar sequence. . . 43
3.3 Example of SSC modelling of PKS 2155-304 . . . 47
3.4 Example of EIC modelling of 3C 454.3 . . . 47
3.5 Schema of the absorption of γ-ray photons by the extra-galactic background light. . . 50
3.6 Extra-galactic background light lower and upper limits. . . 50
4.1 Closer view of the H.E.S.S. mirror and camera. . . 52
4.2 Example of photon-triggered and hadron-triggered Cherenkov light. . . 53
4.3 Basic parameters used in the standard Hillas analysis . . . 55
4.4 Definition of the background regions used in the H.E.S.S. analysis . . . 57
4.5 Spectral analysis of H.E.S.S. data of PKS 2155-304, in 2010 . . . 59
4.6 Number of extragalactic sources detected by H.E.S.S. as a function of time. . . 60
4.7 TeV emission from radio-galaxies detected by H.E.S.S. . . 63
4.8 SED of AP Lib . . . 64
4.9 H.E.S.S.sky map centered on KUV 00311-1938 . . . 67
4.10 Significance over time and theta-squared plot for KUV 00311-1938. . . 67
4.11 Spectrum of KUV 00311-1938. . . 68
4.12 H.E.S.S.sky map centered on PKS 0301-243 . . . 68
4.13 Significance over time and theta-squared plot for PKS 0301-243. . . 69
4.14 H.E.S.S.sky map centered on *** ****-*** . . . 70
4.15 Significance over time and theta-squared plot for *** ****-***. . . 70
4.16 Spectrum of *** ****-***. . . 71
4.17 Lightcurve of *** ****-***. . . 71
5.1 Excess map of 1RXS J101015.9 - 311909 as seen by H.E.S.S., and theta-squared plot. . . 77
5.2 Excess map of 1RXS J101015.9 - 311909 as seen by H.E.S.S., and theta-squared plot, obtained with the ParisAnalysis package. . . 78
5.3 Detection contours of 1RXS J101015.9 - 311909 (for H.E.S.S. and Fermi-LAT). . . 79
5.4 Time-averaged spectrum of 1RXS J101015.9 - 311909 seen by H.E.S.S. and Fermi-LAT. . 80
5.5 Time-averaged VHE spectrum of 1RXS J101015.9 - 311909 measured by H.E.S.S., with the ParisAnalysis package. . . 80
5.6 Sky-map of 1RXS J101015.9 - 311909 as seen by Swift-XRT. . . 83
5.7 Angular distribution of X-ray photons from 1RXS J101015.9 - 311909. . . 84
5.8 Swift-XRT light-curve of 1RXS J101015.9 - 311909. . . 85
5.9 Swift-XRT spectra of 1RXS J101015.9 - 311909. . . 86
5.10 The two Swift-XRT spectra of 1RXS J101015.9 - 311909 for case A and case B. . . 87
5.11 Sky-map of 1RXS J101015.9 - 311909 as seen by Swift-UVOT in the V filter. . . 88
5.12 SED of 1RXS J101015.9 - 311909. . . 92
6.1 Constraints for the SED of 1RXS J101015.9 - 311909 in the B-δ plane. . . 97
6.2 Flow diagrams for chi-squared minimization algorithms. . . 99
6.3 Flow diagram for the new numerical algorithm for constraining the SSC model parameters.102 6.4 Comparison between the sampled values of the six observables considered in this study and their reconstructed value for the case of 1RXS J101015.9 - 311909. . . 105
6.5 Solutions of the SSC modelling of 1RXS J101015.9 - 311909 obtained with our algorithm. 106 6.6 Solutions of the SSC modelling of 1RXS J101015.9 - 311909 obtained with our algo-rithm, assuming α1 = 2.0. . . 107
6.7 Comparison between the sampled values of the six observables considered in this study and their reconstructed value for the case of PKS 0447-439. . . 116
LIST OF FIGURES xi
7.1 Comparison between the approximation by Katarzy´nski et al. (2001) or the exact
integra-tion over the pitch angle. . . 123
7.2 Comparison between the exact calculation for the inverse Compton emission or the linear interpolation approximation. . . 124
7.3 Comparison between the computation of the γ − γ absorption done using the δ-function cross-section or the formula given by Aharonian et al. (2008d). . . 127
7.4 Effect of synchrotron cooling on electron population. . . 128
7.5 Spectrum of the pairs composing the cascade triggered by photons coming from the π0 decay. . . 131
7.6 Effect of synchrotron cooling on muon population. . . 132
7.7 Acceleration and cooling time-scales for the hadronic modelling of PKS 2155-304. . . . 134
7.8 Hadronic modelling of Mrk 421. . . 136
7.9 Modelling of PKS 2155-304 in a SSC and a hadronic scenario. . . 141
7.10 Particle distribution for the SSC and hadronic model of PKS 2155-304. . . 142
7.11 Modelling of PKS 2155-304 in a mixed lepto-hadronic scenario. . . 143
7.12 Particle distribution for the lepto-hadronic model of PKS 2155-304. . . 144
8.1 Fermi-LAT lightcurve of 3C 454.3. . . 146
8.2 Fermi-LAT spectrum of 3C 454.3for different flux value. . . 147
8.3 Fermi-LAT spectrum of 3C 454.3modelled in a EIC scenario. . . 147
8.4 Modelling of the SED of 3C 454.3 in a EIC scenario. . . 150
8.5 Modelling of the SED of 3C 454.3 in a EIC scenario. Zoom on the Fermi energy band. . 150
A.1 Simulation of detection of low-state blazars with CTA. . . 158
List of Tables
2.1 Summary of the Suzaku observations on Mrk 509 and Mrk 841. . . 14 2.2 Best fit parameter values for the model powerlaw+ zgauss + zgauss + zgauss,
consider-ing XIS data between 3 and 10 keV. . . 21 2.3 Best fit parameter values for the broken power law model. . . 23 2.4 Best fit parameter values for the double Comptonisation model, with or without a
two-phase warm absorber. . . 34 2.5 Best fit parameter values for the blurred reflection model. . . 35 2.6 Best fit parameter values for the smeared absorption model. . . 36
4.1 Comparison between the Hillas and the Model analysis of the 2010 observations of PKS 2155-304. . . 58 4.2 Comparison between the spectral analysis of the 2010 observations of PKS 2155-304,
performed using the Hillas and the Model reconstruction methods. . . 58 4.3 Extra-galactic sources detected by H.E.S.S. up to July 2012, listed in order of type and
Right Ascension. . . 61 4.4 Upper limits on the AGN observed by H.E.S.S.. . . 73
5.1 Summary of good-quality data of H.E.S.S. observations of 1RXS J101015.9 - 311909 over the years 2006-2010. . . 76 5.2 Spectral properties of the Fermi-LAT analysis of 1RXS J101015.9 - 311909. . . 82 5.3 Swiftobservations available for 1RXS J101015.9 - 311909. . . 84 5.4 Best-fit parameters for the two models used for the fitting of the Swift-XRT spectra of
1RXS J101015.9 - 311909. . . 85 5.5 Summary of optical and ultra-violet data point of 1RXS J101015.9 - 311909used for the
analysis of the SED. . . 88 5.6 Summary of the parameters used for the modelling of the 1RXS J101015.9 - 311909 SED. 91
6.1 Summary of the constrained parameters for the SSC modelling of 1RXS J101015.9 -311909. . . 104 6.2 Coefficients of the fit performed to obtain an expression of νs(left) and νFν;s (right) for
the case of 1RXS J101015.9 - 311909. . . 104 6.3 Coefficients of the fit performed to obtain an expression of νFν;Fermi (left) and νFν;HES S
(right) for the case of 1RXS J101015.9 - 311909. . . 108 6.4 Coefficients of the fit performed to obtain an expression of ΓFermifor the case of 1RXS J101015.9
-311909. . . 108 6.5 Coefficients of the fit performed to obtain an expression of ΓHES S for the case of 1RXS J101015.9
-311909. . . 109 6.6 Summary of the constrained parameters for the SSC modelling of PKS 0447-439. . . 112
6.7 Coefficients of the fit performed to obtain an expression of νs(left) and νFν;s (right) for
the case of PKS 0447-439. . . 112
6.8 Coefficients of the fit performed to obtain an expression of ΓFermifor the case of PKS 0447-439. . . 112
6.9 Coefficients of the fit performed to obtain an expression of ΓHES S for the case of PKS 0447-439. . . 113
6.10 Coefficients of the fit performed to obtain an expression of νFν;Fermi (left) and νFν;HES S (right) for the case of PKS 0447-439. . . 115
7.1 Parameters used for the SSC and the hadronic modelling of PKS 2155-304. . . 140
8.1 Parameters used for the EIC modelling of 3C 454.3. . . 151
A.1 Simulation of detection of low-state blazars with CTA. . . 157
Etude de l’émission aux hautes énergies des
noyaux actifs de galaxies
Ce manuscrit résume les travaux effectués pendant les trois années de thèse doctorale au sein du LUTh (Laboratoire Univers et Théories) et de la collaboration H.E.S.S..
Le projet de recherche a été l’étude de l’émission aux hautes énergies (rayons X et rayons γ) des Noyaux Actifs de Galaxies (NAG), et a comporté deux parties distinctes: d’un côté l’étude de l’émission en rayons X des galaxies de Seyfert 1 (en s’intéressant particulièrement au problème de l’excès de rayons X-mous, ou soft-excess), et d’un autre côté l’étude de l’émission en rayons γ des blazars, en utilisant en particulier les données du réseau de téléscopes de type Cherenkov (pour l’observation de photons aux energies de l’ordre du TeV) H.E.S.S..
Après une courte Introduction sur les NAG et l’astronomie au TeV, nous décrivons tout d’abord l’émission aux rayons X des galaxies de Seyfert (Chapitre 1). Ce Chapitre est une introduction à l’étude détaillée de l’émission en rayons X de deux galaxies de Seyfert 1, Mrk 509 et Mrk 841, presentée dans le Chapitre 2. Une caractéristique importante de l’émission X de ce type de NAG est le soft-excess, qui ap-paraît comme un excès de flux au-dessous de environ 1 keV par rapport à l’extrapolation à basse énergie de la loi de puissance ajustée entre 3-10 keV. Dans ce Chapitre, nous nous concentrons en particulier sur l’interprétation de cette émission, en ajustant les données Suzaku avec trois modèles différents: une double Comptonisation, une réflexion sur la partie la plus interne du disque d’accrétion, et une absorption par un vent rélativiste. Alors que pour Mrk 841 les trois scénarios donnent des résultats statistiquement équivalents, pour Mrk 509 le scénario avec reflexion est exclu.
La deuxième partie commence par une introduction générale sur les blazars (Chapitre 3), avant de présenter le réseau de téléscope H.E.S.S., ainsi qu’une revue des NAG observés au TeV (Chapter 4). Nous présentons ensuite l’étude spécifique du blazar émetteur au TeV 1RXS J101015.9 - 311909 (Chapitre 5): l’analyse des observations éffectuées par H.E.S.S. et par d’autres observatoires dans l’optique, en rayons-X et rayons-γ (ATOM, Swift et Fermi) nous permet de construire la distribution spectrale d’énergie de la source. L’émission de 1RXS J101015.9 - 311909 est modélisée dans le cadre d’un modèle lep-tonique, de type synchrotron-self-Compton (SSC).
Les Chapitres suivants sont plus théoriques, et traitent de la modélisation de l’émission des blazars. Les modèles developpés dans la littérature scientifique peuvent être divisés en deux familles: leptoniques et hadroniques, selon que les particules responsables de l’émission soient des paires electrons/positrons ou des protons, respectivement. Concernant les modèles leptoniques, nous avons developpé un nouvel algorithme numérique pour la détermination des paramètres du modèle d’émission de type SSC (Chapter 6). Cette méthode, appliquée comme exemple au cas spécifique de 1RXS J101015.9 - 311909, montre
que, pour un blazar de type HBL (high-frequency-peaked BL Lac object), émetteur au GeV et au TeV, l’espace des paramètres du modèle SSC peut être bien determiné, et améliore les contraintes obtenues avec des formules analytiques. Nous pouvons aussi utiliser, sous certaines hypothèses, cet algorithme pour contraindre la distance d’un HBL dont on ne connait pas le redshift (application au cas de PKS 0447-439).
Dans le Chapitre 7 nous nous concentrons sur les processus d’émission de type hadronique, en de-crivant le développement d’un nouveau code stationnaire lepto-hadronique (qui prend en compte à la fois les processus leptonique et hadronique), et nous présentons une première application à Mrk 421 et à PKS 2155-304. Le code nous permet de modéliser l’émission des blazars dans un scenario soit lep-tonique soit hadronique, en changeant les paramètres de la région émettrice et des particules présentes. Des scenarios mixtes lepto-hadroniques (dans lesquels l’émission aux hautes énergies est associée aux deux composantes) peuvent être également étudiés dans ce contexte.
Nous terminons, dans le Chapitre 8, avec la modélisation de 3C 454.3, un blazar de type FSRQ (flat-spectrum-radio-quasar), dont le spectre au GeV est décrit par un processus de type inverse Compton sur les photons produits dans la Broad-Line-Region.
Les observations conjointes du téléscope Fermi (au GeV) et des téléscopes Cherenkov au sol (au TeV, comme H.E.S.S., MAGIC, VERITAS), ont permit d’observer la composante en rayons-γ des blazars avec une très bonne résolution en énergie. Le nouveau téléscope H.E.S.S. II (dont la prémière lumière a été obtenue pendant l’été 2012) va pouvoir améliorer notre connaissance des blazars, en permettant de baisser le seuil d’observation en énergie et donc d’étudier la partie du spectre compris entre Fermi et les télescopes de type Cherenkov.
La communauté de l’astronomie au TeV développe actuellement le réseau de nouvelle génération, CTA (Cherenkov Telescope Array). Le projet est dans sa phase préparatoire, et les prémiers prototypes sont en construction (comme par exemple le télescope SST-GATE, sur le site de l’Observatoire de Meudon). Dans ce contexte, en appendix A est présentée une perspective de détection par CTA de blazars au grand redshift.
Preface
In this thesis manuscript we tried to summarize the research work done during the last three years in the high-energy group of the LUTh laboratory, as well as in the H.E.S.S. collaboration.
The project deals with the study of high-energy emission from active galactic nuclei (AGN), where, whith high energy, we refer here to X and γ-rays. The thesis covers in fact two different aspects of the physics of AGN, firstly the study of the X-ray emission from Seyfert galaxies (radio-quiet AGN), and then of the γ-ray emission from blazars (radio-loud AGN).
We start then by providing a short introduction to the scientific context of AGN physics (by present-ing the unified AGN model), as well as of TeV astronomy.
In the first part we first describe the problem of the soft-X-ray excess in Seyfert galaxies (Chapter 1), before entering in the details of the study of Suzaku observations of two particular objects (Mrk 509 and Mrk 841, Chapter 2), presenting the data analysis and their modelling.
The second part starts with an introduction on the blazar physics (Chapter 3), before showing the results achieved by the H.E.S.S. telescope array on AGN (Chapter 4). A detailed study has been done on a particular blazar detected at TeV energies (1RXS J101015.9 - 311909), and is presented in Chapter 5.
The following chapters are more theoretical, and discuss the modelling of the observed blazar emis-sion. In particular, in Chapter 6 we discuss the constrains on the synchrotron-self-Compton model, presenting a new numerical algorithm to determine the best-fit solution, while in Chapter 7 we present a new stationary lepto-hadronic code, which can be used to model the blazar emission in leptonic, hadronic and mixed scenarios.
In Chapter 8 we present the problem of the spectral break observed in the GeV spectrum of 3C 454.3, and we model it consistently in an external-inverse-Compton scenario.
Finally we present a perspective for the detection of high-redshift sources with the future telescope CTA (Appendix A).
Introduction
Contents
0.1 Active galactic nuclei . . . xix
0.1.1 The discovery of quasars . . . xx
0.1.2 The AGN zoo . . . xxi
0.1.3 The unification model . . . xxiii
0.1.4 Silent super-massive black holes . . . xxiv
0.2 TeV astronomy . . . xxv
0.2.1 The current generation of IACTs . . . xxviii
0.2.2 The future of TeV astronomy . . . xxix
In this Chapter we describe the general scientific context of this work. In Section 0.1 we provide the historical background of the discovery of quasars and active galactic nuclei, and we present the current unification model. An important part of this thesis deals with the study of TeV emission from AGN, and largely benefits from observations taken by the H.E.S.S. experiment. For this reason, in Section 0.2 we present the basis of TeV astronomy, providing an introduction to the detection technique and describing the current generation of telescopes.
0.1
Active galactic nuclei
With the term active galaxy nucleus (AGN) we refer to any kind of galactic nucleus showing signs of ac-tivity related to accretion onto a super-massive black hole. A galaxy hosting an AGN is then called active galaxy. The observational signatures of activity can be different, and include detection of strong emis-sion lines in the optical spectrum1, strong radio-emission (often in the form of bipolar jets), broad-band continuum spectrum, rapid variability. The AGN class is not homogeneous, and is composed by a huge variety of objects, which differ in shape, luminosity, spectrum and temporal variability. These differences are understood today in the context of the unification scenario, which will be presented later. Before, we describe briefly the history of AGN observations, and the zoology of the different observational classes.
1The measurement of the line ratios is used to determine the excitation mechanism, and in particular, to discriminate
between normal HII regions and photo-ionisation by power-law continuum, which is characteristic of AGN (see Baldwin et al. 1981).
0.1.1
The discovery of quasars
Soon after the release of the first catalogs of radio astronomical sources (like the Cambridge catalog of radio sources, Edge et al. 1959), the attention was driven to powerful, very compact radio-sources. Their optical counterparts were identified as faint point-like sources, which showed strong variability and strong emission line in their optical spectrum. They where thus named quasi-stellar object (quasar, or QSO). One of the most important discoveries in the astronomy of the XX century was that the measurement of the redshift of these newly-identified object was suprisingly high (see for example Schmidt 1963, for the case of 3C273): once the Doppler redshift excluded (mainly through the non-detection of blue-shifted quasars), the cosmological redshift2was accepted as the explanation of the observed shift in frequency,
constraining the quasars as powerful extra-galactic sources. In fact, the high measured distance implies an appearent luminosity wich can reach 1048erg s−1.
The new question became then, what is the origin of such high luminosity? It can be easily shown (see e.g. Peterson 1997; Kembhavi & Narlikar 1999) that chemical reactions cannot provide such an energy, nor nuclear ones (which are responsible for the thermal emission from stars). The only source which can provide an amount of energy consistent with the observed luminosity is the graviational force. This solution implies, however, that the mass of the compact object responsible for the emission is of the order of 107 − 109 M
. General relativity imposes that such an object is a black hole, and, in order to
differentiate it from the black holes resulting from stellar collapse (with M• = O(M )), is called
super-massive black holes (SMBH).
The basic idea is that the gravitational potential energy of the material orbiting around the SMBH is converted into thermal emission through friction and viscosity in the accreting material, which forms an accretion disc around the central object. The same physical situation, on a different scale, is encountered in galactic black holes accreting material from a companion giant star (X-ray binaries).
An important step towards the understanding of quasars, was the discovery of nearby active galactic nuclei. They have been detected as nearby galaxies (mostly part of historical catalogs, as the Messier Catalog (Messier 1781) or the New General Catalog (NGC, Dreyer 1888)) which show a luminosity peak at their center. An example is shown in Fig. 1. Another unique feature is that their optical spectrum is characterised by emission lines with unusual intensity ratios with respect to the one observed in normal galaxies, where the emission lines come from the contribution of HII regions. In addition, these emission lines can be significantly broader than in normal galaxies, with a full-width-half-maximum in the range 5000-10000 km s−1 (for a recent review, see Véron-Cetty & Véron 2000). Their peculiarity was first noticed by Seyfert (1943), whose name remained to define the class of the Seyfert galaxies (which will be presented in more details in Chapter 1).
The question becomes than, are quasars and AGN linked? And in which way? The answers is yes, they are, and it will be discussed in the unification scheme Section. The idea is that Seyfert galaxies are low-luminosity AGN, observed only in nearby galaxies, while quasars are high-luminosity AGN, which outshine the emission of the associated galaxy. Before going into the details of the unification scenario, we provide some observational basis of all the different kinds of AGN.
2The Hubble’s law, relating the redshift to the distance was empirically discovered only a few decades before, in 1929
0.1. ACTIVE GALACTIC NUCLEI xxi
Figure 1: Left: optical image of the Seyfert 1 galaxy MCG - 6 - 30 - 15. Right: surface brightness of the object as a function of the integration radius, showing the contribution from the host galaxy (dashed line) and from the active nucles (dashed-dotted line). Taken from Arévalo et al. (2005).
0.1.2
The AGN zoo
The classification of AGN can be quite complicated at a first glance, and the reason is mainly its historical evolution. We have thus classes of AGN which merged during the last decades, new classes which were introduced, some others which were abandoned. The class of blazars, for example, which will be deeply discussed in the second Part of this thesis, is not a homogeneous group, and is composed by highly vari-able quasars (sometimes called Optically Violent Varivari-able quasars, OVV) and BL Lacertae objects (BL Lac). We try to describe here, in a simple (and not exhaustive) way, the different kind of AGN that can be encountered, providing the most recent name.
The most general classification of AGN is based on their radio flux (Kellermann et al. 1989). If their measured flux at 5 GHz is more than ten times their optical flux, they are called radio-loud AGN, while if it’s lower they are called radio-quiet AGN. As we will se later, this dichotomy represents one of the aspects of the unification scenario which remain unclear.
Radio-quiet AGN are called Seyfert galaxies (from Seyfert 1943), and they are distinguished in type-one Seyfert galaxies (or, simply, Seyfert 1), and type-two Seyfert galaxies (Seyfert 2). The observational threshold between the two sub-classes is the width of the emission lines observed in the optical spectrum: if we observe only narrow emission lines (of the order of hundreds km s−1) we call them Seyfert 2, while if we also see broad emission lines (of the order of thousands km s−1) we call them Seyfert 1.
The distinction between the two kind of Seyfert galaxies is not a true dichotomy, in the sense that we have observed intermediate Seyfert, which are then called Seyfert 1.5. In general, a Seyfert galaxy is nowadays identified by a continous index spanning the range 1.X to 2.0, indicating the amount of broad versus narrow line observed. However, a class of Seyfert galaxies which does not follow this simple schema exists, like the Narrow-Line-Seyfert-1 galaxies (NLS1, Osterbrock & Pogge 1985), which show a Seyfert-1 spectrum plus unusually narrow HI lines, with strong FeII emission and weak forbidden lines. More details on Seyfert galaxies will be given in Chapter 1.
Quasars share the same spectral properties of Seyfert 1 galaxies, but they have a higher luminosity. They can thus be seen as the brighter version of Seyfert 1 galaxies, being easily detected despite their high
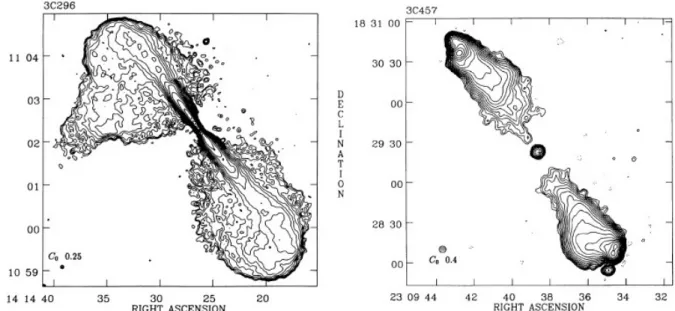
dis-Figure 2: Example of the different morphology observed in radio-galaxies. At the left, the radio image (at 20 cm) of the FR I radio-galaxy 3C296, at the right of the FR II radio-galaxy 3C457. Adapted from Leahy & Perley (1991)
tance. Hereafter we will thus adopt the term quasar to indicate an AGN whose host galaxy is not observed.
The archetype of radio-loud AGN are radio-galaxies. A radio-galaxy is defined as a radio-source whose optical counterpart is a resolved galaxy. Their radio morphology is characterized by a relativistic jet, which emits non-thermal emission (synchrotron radiation) in a wide range of frequencies, from radio to γ-rays. The radio-galaxies are divided in two sub-classes according to the morphology of their radio emission: if it is dominated by the core they are called FR I (from Fanaroff & Riley 1974), while if it is dominated by distant hotspots in the jet they are called FR II (the two symmetric hotspot representing the shock-front between the relativistic jet and the inter-galactic medium). This morphological dichotomy (shown in Fig. 2) corresponds to a luminosity dichotomy, with FR II radio-galaxies brighter than FR I.
If instead the host galaxy of the radio-source is not resolved, we call it generally radio quasar. Ac-cording to the spectral index in the radio band, we can call them Flat-Spectrum-Radio-Quasar (FSRQ) or Steep-Spectrum-Radio-Quasar (SSRQ) if the index α3is lower or higher than 0.5.
Radio-galaxies and quasars both show emission lines in the optical spectrum. If instead it is charac-terized by a continuum, non-thermal distribution, the AGN is called BL Lac object (from the name of the first object of this kind observed, the previously-thought variable-star BL Lacertae; the threshold for an object being classified as BL Lac is that the equivalent width of the emission lines in the spectrum has to be lower than 5 Å, see Angel & Stockman (1980)). The term blazar (merging of BL Lac and quasar, but also reminding of "to blaze") is adopted to refer to BL Lac objects and OVVs, which are considered two sub-classes of the same family, characterised by rapid variability and high and variable polarization. It is nowadays established that FSRQs also belong to the blazar class (Fugmann 1988), as they share the same properties of the OVVs. More details on blazars will be presented in Chapter 3.
3Spectral index in F
0.1. ACTIVE GALACTIC NUCLEI xxiii
Figure 3: The active galactic nucleus NGC 4261. Left: optical image of the galaxy with, in false-color, the rela-tivistic jets observed in radio. Radio: zoom on the inner part, showing the dust torus obscuring the central engine of the active galactic nucleus. (Credit HST/NASA/ESA, adapted from Jaffe et al. (1993))
0.1.3
The unification model
The unification model, developed in the 1980s, (for a review see Antonucci 1993; Urry & Padovani 1995) tries to explain the different kind of observed AGN in a consistent framework. The basic scenario is the presence, at the center of the system, of a central engine, the SMBH, which accretes matter in the form of an accretion disc. Part of the incoming matter is expelled in the form of a pair of polar, relativistic jets, which correspond to the jet observed in radio-galaxies.
The mechanism of the production of jets in AGN is one of the open-question in XXI century astrophysics. It seems clear nowadays that the production of jets is possible only in the presence of a strong magnetic field, which collimates the outflow, but the details of this mechanism remain unclear (for a recent review, see e.g. Camenzind 2005). The presence of the jets is considered as a necessary and sufficient condition for the observation of an AGN as radio-loud: if the jets are present we will see it as a radio-loud AGN, while if the system does not show relativistic jets, we will see it as a radio-quiet AGN.
This scenario explains thus the radio-dichotomy of AGN. It is important to underline, however, that this dichotomy is not fully explained nor theoretically supported, and remains a weak spot of the theory. Sev-eral authors claimed that the presence/absence of jets is linked to the spin of the central black hole (see e.g. Tchekhovskoy et al. 2010), but this hyopthesis has not been confirmed yet.
The second key-ingredient of the unification scenario, is a dust torus located on the same plane of the accretion disc, at a parsec-scale distance from the central black-hole. This affects the observation of the AGN because, if we see the system edge-on, the central region would be obscured by the torus, while if we observe it face-on, we can directly see the accretion disc and the inner core of the system.
Figure 4: Simplified scheme of the unified model of active galactic nuclei. Left: radio-quiet AGNs. The dusty torus is not shown, while the outflow represents a disk wind. Right: radio-loud AGNs, characterized by the presence of a relativistic jet.
The emission line observed in the optical spectrum are thought to be produced by clouds illuminated by the thermal emission from the accretion disc. The width of these lines is explained by Doppler broaden-ing, and is thus linked to the distance of the cloud from the center of the gravitational potential: narrow-emission lines map the farthest narrow-emission regions (narrow-line regions, NLRs), while broad-narrow-emission lines map the emission regions closest to the black hole (broad-line regions, BLRs).
If the observation of the central regions is obscured by the torus, we will thus see only the NLRs, while, if we observe the AGN face-on we will be able to detect the emission from the BLRs. This scenario ex-plains thus by a simple orientation effect the difference between Seyfert 1 galaxies and Seyfert 2 galaxies, naturally taking into account the intermediate objects.
The observational proofs of this interpretation are mainly two: the first, indirect, is the detection of broad-lines in Seyfert 2 galaxies when observed in polarized light. This is explained by considering that what we are observing in this case is the emission from BLRs scattered in the direction of the observer. The second proof is the direct observation of the dusty torus, like in the famous study of the nearby AGN NGC 4261, showed in Fig. 3 (Jaffe et al. 1993).
0.1.4
Silent super-massive black holes
The most important confirmation of the unification model of AGN comes from our own galaxy. In fact, it is now unanimously accepted that the very center of the Mily Way (called SgrA?) hosts a SMBH of 106 M , whose presence is detected indirectly by the orbital motion of stars in its gravitational potential.
In Fig. 5 (taken from Eisenhauer et al. 2005) we shows an image of the measured orbital motion of six stars around SgrA?, together with the measurement of their radial velocity. This observation shows that even non-actif galaxies can harbour a SMBH at their center, which does not show any sign of activity because it is not currently accreting matter.
Another important observation is the recent detection (Su et al. 2010), by the Fermi-LAT telescope (observing the sky in γ-rays, between 100 MeV and 100 GeV), of a pair of γ-ray lobes in our galaxy (called ”Fermi bubbles”), symmetric with respect to the galactic center (see Fig. 6). The origin of this newly-discovered component is currently under-debate, but one of the possibility is that it represents an
0.2. TEV ASTRONOMY xxv
Figure 5: Left: orbital motion of stars around SgrA?. Right: radial velocity of the six stars considered (same colour as for the left plot). Taken from Eisenhauer et al. (2005).
echo of a past activity of the Milky Way center. This would thus confirm that an AGN is the visible effect of accretion onto a SMBH, and that it can be turned on and off according to the matter reservoir.
0.2
TeV astronomy
TeV astronomy, which studies photons with an energy of the order of magnitude of the Tera-electonVolt, is nowadays a firmly-established part of astronomy, and is considered as an autonomous branch thanks to its particular detection technique (for a review, see for example Weekes 2003), which will be briefly presented in this Section.
The term γ-ray astronomy is used to describe the study of photons above ≈ 100 keV (i.e., more en-ergetic than X-rays). There is however a distinction between medium-energy γ-rays (ME, E ∈ [100 keV, 100 MeV]), high-energy γ-rays (HE, E ∈ [100 MeV, 100 GeV]) and very-high-energy γ-rays (VHE, E ∈ [100 GeV, 100 TeV]). In the following, we will adopt VHE astronomy as a synonym of TeV astron-omy. The difference between ME/HE and VHE astronomy is more than a simple practical distinction between the photon energy: in fact, while for E < 100 GeV the detection is done using space-telescopes which directly intercept the γ-ray photon, measuring its energy and incoming direction, above 100 GeV the observation is done with ground-based telescopes, and it is indirect.
What is observed is indeed the emission from the electro-magnetic shower triggered by the interaction of the TeV photon with the Earth atmosphere. The first process taking place is the pair production of an electron and a positron as a result of the interaction of the γ-ray with the atmosphere. The two leptons, by interaction with the atmosphere, emit bremsstrahlung radiation, which then pair-produces again. The characteristics of the shower (number of pairs produced, altitude and length of the shower) depend on the photon energy. If the electron-positron pairs composing the cascade are super-luminal in the
atmo-Figure 6: The Fermi bubbles in the Milky Way. The image represents the sky in galactic coordinates (the plane representing the Milky Way disc). Credits NASA/DOE/Fermi LAT/D.Finkbeiner et al.
sphere (i.e. their speed v is higher than c/n, where n is the refractive index of the medium), they emit Cherenkov light, which is observed on the ground. The energy and the direction of the incoming γ-ray is then reconstructed, on the basis mainly of the shape of the observed image and its intensity. The main problem of this detection technique is the background, which is represented by all the showers triggered by cosmis rays. It is however possible to discriminate between a photon-shower and a hadron-shower on the basis of the shape of the observed Cherenkov light, given the fact that a photon-shower is much more compact, as illustrated in Fig. 7. More details on the data analysis of TeV data, specifically for the case of the H.E.S.S. telescope array , will be provided in Section 4.
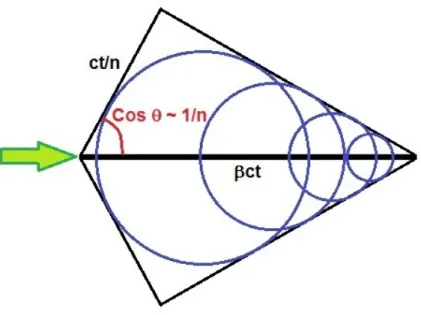
We recall here the basis of the Cherenkov emission, which is the basis of the TeV astronomy. When a charged particle crosses a dielectric medium, it induces a polarization in the surrounding molecules, which then radiate photons. If the particle is moving with a speed lower than the speed of light in the medium (c/n), the induced polarization is symetrical, and no effective radiation is emitted. The situation is different if the particle is travelling faster than the speed of light: in this case, the disturbance is asym-metrical (in the direction of propagation of the particle), and a net effect is produced. As shown in the sketch presented in Fig. 8, the different contributions produced along the path sum up constructively in a cone, characterized by an angle ϑ whose value is uniquely determined by the refractive index of the medium (if β ≈ 1) by cos ϑ = 1/n. The physical situation is in analogy to the one of acoustic waves, when an object travels at a speed higher than the speed of the sound, producing a Mach cone of acoustic waves.
The Cherenkov light has its peak emission in blue/ultra-violet (the spectrum is characterised by a 1/λ2 distribution), and it is responsible, for example, for the blue luminosity of the water-pool in nuclear reac-tors.
The VHE observatories (commonly abbreviated IACTs, for Imaging Atmospheric Cherenkov Tele-scopes) are thus optical telescopes looking at the blue Cherenkov light emitted by the interaction of the
0.2. TEV ASTRONOMY xxvii
Figure 7: Scheme of the detection technique of Cherenkov telescopes. The left inset shows the observed Cherenkov light produced by the shower triggered by the TeV photon. For comparaison, the right part shows a shower triggered by a proton. (Taken from Hinton & Hofmann (2009))
Figure 8: Diagram of the production of a cone of Cherenkov light by a relativistiv particle, going from the left to the right.
photon with the atmosphere. This emission has however two characterstics which challenge its detection: it is very faint and lasts for few nano-seconds. The detectors have thus to respond very fast, collecting at the same time enough photons to permit the characterization of the shower. On the other hand, a good spatial resolution is not required, given the fact that we are interested only in the overall image of the shower. The optimal solution (in term of costs) is a large segmentated mirror (i.e. composed by several blocks, allineated on the support structure) while the camera is made up of clusters of photo-multipliers. One of the peculiarity of TeV astronomy which is worth mentioning is that the measurement of the Cherenkov light is affected by the brightness of the sky, and, in particular, it is usually not worth to ob-serve in presence of Moon-light. This affects significantly the useful observing time of a TeV observatory. The first important success in TeV astronomy came in 1989, when the Whipple telescope (Cawley et al. 1990) detected the Crab nebula as the first TeV source (Weekes et al. 1989). For the work presented in this thesis, it is important to recall the first extragalactic source observed at TeV, Mrk 421, by Punch et al. (1992) (by the Whipple collaboration, as well). Among that generation of VHE telescopes, it is worth mentioning the Hegra (HEGRA Collaboration et al. 1999) and CAT (Barrau et al. 1998) telescopes, built respectively in Spain and France.
0.2.1
The current generation of IACTs
The current generation of IACTs is characterized mainly by stereoscopy: the observatory is composed by at least two telescopes, which detect the Cherenkov light at the same time, significantly improving the reconstruction of the direction of the incoming photons and the overall sensitivity.
There are nowadays three competitive TeV telescope arrays in the world (shown in Fig. 9 and 10):
• H.E.S.S. (High Energy Stereoscopic System)
is a system of four identical IACTs of 13 m of diameter each, located in the Khomas Highlands, in Namibia. It has been built by a collaboration mainly composed by French and German institutions, and is operative since 2004.
• MAGIC (Major Atmospheric Gamma-ray Imaging Cherenkov telescope)
is composed by a couple of different IACTs built in two different phases: the first one is operative since 2004, while the second has been completed in 2009. It is located in the Canary islands, and is supported mainly by German, Italian and Spanish institutions. The second telescope represents today the biggest operative IACT (17 m), and allows this system to observe at energies down to 25 GeV (see next section).
• VERITAS (Very Energetic Radiation Imaging Telescope Array System)
is composed by four identical IACTs, in Arizona. Operative since 2007, it is the successor of Whipple, and is supported by American institutions.
It is important to underline that the three observatories do not observe the same part of the sky, MAGIC and VERITAS being located in the Northern hemisphere, and H.E.S.S. being located in the Southern hemisphere. In particular, H.E.S.S. benefits from the view of the central region of the Milky Way: the TeV galactic survey performed by H.E.S.S. (Aharonian et al. 2005a; Chaves et al. 2008) represented a major result in TeV astronomy, leading to the detection of dozens of new sources, some of them still unidentified.
0.2. TEV ASTRONOMY xxix
Figure 9: Left: the two telescopes of the MAGIC observatory in the Canary islands. Right: the four-telescope array of VERITAS, in Arizona. (Credits: the MAGIC and VERITAS collaborations.)
Figure 10: The new telescope of the phase II of H.E.S.S., built in the middle of the four-telescope array of H.E.S.S. I. (Credits: the H.E.S.S. collaboration.)
0.2.2
The future of TeV astronomy
H.E.S.S. II
The H.E.S.S. telescope array, in its actual configuration of four 13 m IACTs, has a low-energy threshold of roughly 100 GeV. The measurement of the lower energies is limitated mainly by the faintness of their associated Cherenkov emission and by the cosmic-ray background: to detect them it is thus mandatory to increase the collecting surface. A current issue in γ-ray astronomy is that HE and VHE telescopes do not overlap in energy. In fact, the Fermi satellite (launched in 2008, and observing the GeV universe in an all-sky mode), starts loosing detecting efficiency at energies of the order of 100 GeV, exactly when H.E.S.S.starts being sensitive. The part of the spectrum in-between the two instruments is thus poorly known, given the fact that both telescopes are at their respective thresholds. To decrease the low-energy threshold, the H.E.S.S. collaboration has built a fifth telescope of 28m of diameter (more than twice the current H.E.S.S. telescopes, see Fig. 10), placed at the middle of the array. In this new configuration (H.E.S.S. II), the low-energy threshold is expected to be at roughly 20 GeV, significantly overlapping the Fermi-LAT energies. The fifth telescope will provide of course benefit also for the already studied range of energies, improving the overall sensitivity of H.E.S.S..
Figure 11: Top: rendering of the future CTA observatory, with four Large-Size-Telescopes (LSTs) in beetween a grid of Mid-Size-Telescopes (MSTs). Several Small-Size-Telescopes (SSTs) can be seen in the background. (Credits: the CTA consortium) Bottom: example of three different array configuration under study for the CTA telescope. The size of the circles is proportional to the size of the telescopes used (taken from Actis et al. 2011); configuration B, LSTs and MSTs; configuration C, MSTs only; configuration E, LSTs, MSTs and SSTs.
The official inauguration of this new phase of H.E.S.S. is planned at the end of September. Considering that at the beginning the observing time would be devoted to the characterization of the instrument, the first scientific results are expected for 2013.
CTA
At the same time that the current generation of IACTs is providing a huge scientifical outcome, estab-lishing TeV astronomy as a solid science, the community is already preparing the next generation of telescopes. The different collaborations running the three competitive instruments (MAGIC, H.E.S.S. and VERITAS) decided to merge, putting their efforts together to conceive, develop and build the TeV obser-vatory of the next decades, CTA (Cherenkov Telescope Array, Actis et al. 2011). Conceived as an open observatory (while the current observatories are private), CTA will consist of several dozens of telescopes, detecting photons from 30 GeV to 300 TeV, with a sensitivity one order of magnitude higher than current IACTs. It will be composed by three different kind of telescopes: few Large-Size-Telescopes (LSTs, with a diameter of 24 m), which cover the lowest energies, and represent the center of the array; several Mid-Size-Telescopes (MSTs, similar in dimension to H.E.S.S.), which cover the central part of the spectrum,
0.2. TEV ASTRONOMY xxxi
around the TeV; several Small-Size-Telescopes (SSTs, with a diameter of a few meters), placed more sparsely in the array and covering the highest energies. Some possibilities of the exact configuration of the array (which has not been defined yet) are shown in Fig.11. The project is currently in its preparatory phase, and the first prototypes of the different parts of the array (telescope structures, cameras, mirrors) are being studied. In order to have a good coverage of the sky, the plan is to build two sites, one in the southern hemisphere (more devoted to galactic sources, given the visibility of the central region of the Milky Way), and one in the northern hemisphere (more devoted to extra-galactic sources). However, the choice of the two sites has not been made yet. If the expected schedule will be respected, CTA is planned to be fully operational in the next decade (2018), providing new and exciting results in the field of γ-ray astronomy.
Prototyping CTA: the GATE project
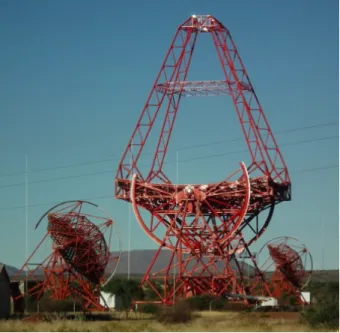
We present here, briefly, the prototype for the CTA small-size-telescopes currently in development in the Paris Observatory, as a result of a collaboration between different laboratories in the Paris region. The project, named GATE (for GAmma-ray Telescope Elements), is characterised by a new kind of design with respect to the Davies-Cotton one, adopted in the current generation of IACTs. It will consists, in fact, of a two-mirror telescope, in the so-called Schwarzschild-Couder (SC) configuration. The primary mirror will have a diameter of four meters. The main goal of the prototype is thus to show that a SC design can be efficiently built and used for the TeV astronomy.
The project, whose construction is expected to be completed in 2013, will be fully equipped (with mirrors and camera), and will remain in the Meudon campus for teaching puroposes.
A rendering of the GATE telescope once completed, is shown in Fig. 12
Figure 12: Rendering of the GATE project, prototype for the small-size-telescopes in the CTA array. The main mirror has a diamter of four meters
Part I
Radio-quiet active galactic nuclei
Chapter 1
Seyfert 1 galaxies and the problem of the soft
excess
Contents
1.1 Introduction . . . 3 1.2 Seyfert galaxies . . . 3 1.2.1 Type 1 and type 2 . . . 4 1.3 The X-ray spectrum of Seyfert 1 galaxies . . . 6 1.3.1 The X-ray continuum . . . 6 1.3.2 The Fe Kα line and the Compton bump . . . 7 1.3.3 The soft X-ray excess . . . 8 1.3.4 The warm absorber . . . 10 1.4 The X-ray spectrum of Seyfert 2 galaxies . . . 12
1.1
Introduction
In this Chapter we provide an introduction on Seyfert galaxies, presenting first their observational prop-erties in visible light, at the basis of their spectroscopic classification 1.2.1, as well as the observation in polarized light, which represented an important step for our comprehension of active galactic nuclei. We then enter in more details into the X-ray emission from Seyfert 1 galaxy discussing their general continuum spectrum (see Section 1.3.1), the iron Kα emission line (Section 1.3.2), the soft X-ray excess (Section 1.3.3) and the warm absorber (Section 2.4.1). For consistency, we also briefly discuss the X-ray emission from Seyfert 2 galaxies (see Section 1.4).
This Chapter represents an introduction to the work on modelling of the Suzaku spectra of the Seyfert 1 galaxies Mrk 509 and Mrk 841 presented in Chapter 2.
1.2
Seyfert galaxies
As discussed in the previous Chapter (Section 0.1.2), Seyfert galaxies are a class of AGN characterised by their radio-quietness (ratio of 5GHz-to-optical flux lower than 10), and by the fact that the host galaxy
is clearly detected (otherwise they would be called, by definition, quasars). They are thus observed in nearby galaxies. These two characteristics make Seyfert galaxies an interesting class of AGN: the ab-sence of relativistic jets (which dominate the emission in radio-loud AGN) permits us to better observe the inner core of the AGN, studying physical details that are hidden in radio-loud sources; their proximity permits us to observe them with higher photon statistics and spatial resolution compared to the luminous and distant quasars.
1.2.1
Type 1 and type 2
Seyfert galaxies are classified in type 1 and type 2 on a spectroscopic basis: if the emission line observed in the optical spectrum are narrow, we call them Seyfert 2, while if a broad component is present as well, we call them Seyfert 1. More correctly (see e.g. Khachikian & Weedman 1974), the distinction between the two classes is made regarding the relative width of the Balmer lines to the forbidden lines: if they have the same width, it is called Seyfert 2, while if the Balmer lines are broader, it is called Seyfert 1. As already said, this classification is not a clear dichotomy and according to the strength of the broad component we can have intermediate Seyfert galaxies (with an index going from 1.0 to 2.0). In Fig. 1.1 we show an example of optical spectra from two Seyfert galaxies, showing the different aspect of their emission lines.
A clue in the comprehension of AGN, came from observations of Seyfert 2 galaxies in polarized light (see e.g. Antonucci & Miller 1985): as shown in Fig. 1.2 for the case of Mrk 348, the polarized spectrum of a Seyfert 2 galaxy looks indeed like the spectrum of a Seyfert 1. In the framework of the unified model of AGN (see Section 0.1.3), this effect is explained by considering that the emission from the BLR, hid-den by the torus in the Seyfert 2 galaxies, emerges along the polar axis and is then scattered towards the observer (the polarization carrying the information on the scattering angle).
The classification scheme of Seyfert galaxies is however not so simple. A first issue comes from the fact that some Seyfert galaxies showed mutation in their broad component (see for example Cohen et al. (1986) for the case of Mrk 1018, or Aretxaga et al. (1999), for the case of NGC 7582): this effect could be explained by considering that the obscuring torus is patchy, and can sometimes reveal the hidden nucleus of a type 2 object, modyfing the ratio of broad and narrow emission lines.
Another aspect is that there is an important part of Seyfert galaxies which cannot be classified as type 1, nor type 2. Their spectrum is similar to a Seyfert 1 (including high-ionization lines, like FeVII and FeX, which are not present in Seyfert 2 galaxies), but they show strong permitted narrow lines. Given their peculiarity they have been classified outside the standard Seyfert 1-2 classification, and they are known as Narrow-Line Seyfert 1 (NLS1, Osterbrock & Pogge 1985).
Even though in the following they will not be discussed any more, it is important to recall here that their importance in the understanding of AGN physics grew significantly in the latest decades, and they are nowadays of particular interest in high energy astrophysics, given their strong soft X-ray emission and rapid variability (see e.g. Boller et al. 1996). Recently, they have also been established as a new class of γ-ray emitter in the GeV range by the Fermi telescope (Abdo et al. 2009c).
The observational classification of Seyfert galaxies is done in optical wavelenghts for historical rea-sons. However, the different optical properties reflect different spectral characteristics in X-rays. In the following we concentrate on the X-ray emission from Seyfert 1 galaxies, describing the key elements of the spectrum. A brief discussion of the X-ray spectrum of Seyfert 2 galaxies will be provided in Section 1.4.
1.2. SEYFERT GALAXIES 5
Figure 1.1: Example of optical spectra from different Seyfert galaxies. Top: optical and UV spectrum of the Seyfert 1 galaxy Mrk 509 (whose X-ray spectrum will be deeply studied in Chapter 2), showing the characteristic broad-emission lines. The two spectra have been taken in different period (one year of interval), showing the continuum and line variability. See in particular the vairation of the broad HeII line (4686 Å). Taken from Carone et al. (1996). Bottom:optical and UV spectrum of the Seyfert 2 galaxy IRAS 18325-5926, showing narrower emission line with respect to the top plot. Adapted from Trippe et al. (2010).
Figure 1.2: Top: spectrum of the Seyfert 2 galaxy Mrk 348, showing the characteristic narrow emission lines. Bottom: spectrum of the polarized emission, showing the broad component. Adapted from Miller & Goodrich (1990).
1.3
The X-ray spectrum of Seyfert 1 galaxies
The X-ray spectrum of Seyfert 1 galaxies can be well described by the following components:
• an underlying power-law continuum
• the Fe Kα line and the Compton bump
• the soft excess
• the warm absorber
1.3.1
The X-ray continuum
From the very beginning of X-ray astronomy it was found that the X-ray emission from Seyfert 1 galax-ies was characterised by a non-thermal power-law distribution, with a photon index comprised between 1.2 and 2.0 (with a mean value of 1.56 ± 0.04, as measured recently by Cappi et al. 2006, , using the XMM-Newtonsatellite).
Soft X-ray photons (for energies below 1 keV) are absorbed in the interaction with the neutral material in our own galaxy, preventing us from observing the energies between UV and X-rays. The observed continuum is indeed a power-law with exponential absorption: E−Γ exp[−NH ·σ(E)], where NH is the
hydrogen column density between the source and the Earth, and σ(E) the photo-electric cross-section.
The origin of this power-law emission is thought to be an inverse Compton process by a thermalized population of electrons in a hot (kT ≈ 100 keV) and optically thin (τ ≈ 1) region (called corona, see
1.3. THE X-RAY SPECTRUM OF SEYFERT 1 GALAXIES 7
Haardt & Maraschi 1993, as well as Fig. 1.7 for a schematic view), which scatters the thermal photons from the accretion disc. This view is also consistent with the detection of a high-energy cut-off around 100 keV (Gondek et al. 1996), which reflects the maximum energy of the electrons in the emitting region. However, the origin of this corona (its production mechanism) is not understood, nor the exact geometry (its shape and location with respect to the other components of the AGN).
1.3.2
The Fe Kα line and the Compton bump
A characteristic of the X-ray spectrum of Seyfert galaxies is the presence of the iron Kα emission line at energies around 6.4 keV. This feature, together with a hardening of the power-law continuum at energies above 10 keV (which can be seen as a ”bump” in the hard-X-rays), is explained as the reflected emission of the primary corona continuum over the disc and the molecular torus. The physical processes respon-sible of the reflected spectral distribution are mainly Compton scattering and fluorescence (for a more detailed review on the calculation of the reflected spectrum, see e.g. Kahn et al. (2005, Chapter 3)). The shape of the Fe Kα can be complex: first of all, it can be produced by different kinds of iron ionization state, which provide contributions at slightly different energies (from 6.4 keV for neutral iron, to 6.65 keV for FeXXIV; for this reason, the detection of a narrow 6.4 keV emission line is usally associated to reflection on cold material, as the molecular torus); second, when it is produced by reflection of the inner regions of the accretion disc, its shape can be significantly modified by the relativistic effects near the SMBH, resulting in both a broadening of the line, and in the formation of a red-wing (which is of primary importance, providing an access to the value of the SMBH spin, see Tanaka et al. (1995); Nandra et al. (1997) and Fig. 1.3).
Figure 1.3: Fe Kα emission line in NGC 3783, with the red-wing clearly visible. The bolded and dashed lines represent the best-fit solutions assuming a Schwarzschild and a Kerr geometry, respectively. Taken from Nandra et al. (1997).
1.3.3
The soft X-ray excess
The soft-X-ray excess represents an important feature in the Seyfert 1 X-ray spectrum, always observed, even though variable in both shape and strength. It appears as a featureless excess of emission above the low energy extrapolation of the 2-10 keV best-fit power law. Detected since the 80s (Pravdo et al. 1981; Arnaud et al. 1985), the origin of this component is still nowadays, about three decades after the discovery, one of the major open questions in AGN research (see e.g. Turner & Miller 2009).
Historically associated with the high energy tail of the accretion-disc black-body radiation, many authors (Czerny et al. 2003; Gierli´nski & Done 2004; Piconcelli et al. 2005; Crummy et al. 2006) have shown that modelling with a thermal continuum infers a characteristic ”temperature” higher than expec-tations (Shakura & Sunyaev 1976) that remains remarkably constant across a range of AGN despite a wide spread in black hole mass and AGN luminosity. Moreover, in bright and variable AGN the soft ex-cess does not follow the expected black-body luminosity-temperature relation (Ponti et al. 2006). Various studies have shown that the ratio of the soft excess, at 0.5 keV, to the extrapolation of the high-energy power-law emission has a very small scatter (Piconcelli et al. 2005; Miniutti et al. 2009), which is very different from what is observed in galactic black holes in the bright soft state, dominated by the disc black-body emission (e.g. Done et al. 2007).
The soft-excess shape seems to be related to the luminosity of the source. As shown in Fig. 1.4 (in which six different soft-excess shapes are shown, in order of increasing luminosity), faint sources show a sharp rise at energies less than 1 keV, while more luminous sources show a smoother spectrum, with the soft-excess starting already at 2 keV.
We describe now briefly the three competitive models developed to describe the soft-excess: in the next Chapter they will be more deeply discussed for the specific case of Mrk 509 and Mrk 841.
The double Comptonization model
The first idea investigated to explain the soft-excess was Comptonisation that might occur in the upper layer of the accretion disc (Czerny et al. 2003; Gierli´nski & Done 2004; Sobolewska & Done 2007). This model represents a natural extension of the disc-corona model (it assumes that there are indeed two Comptonisation regions, the hot and optically thin corona, responsible of the power-law continuum, and a second, colder, Comptonisation region, responsible of the soft-X-ray emission) and may explain the featureless shape of the soft excess.
The main issue of this model is that it is difficult to explain in such a scenario the constancy of the soft-excess temperature, while the black-hole mass (and the accretion disc temperature) spans a large range of values. The feedback between the coronal disc irradiation and the disc external-layers may provide however a mechanism to stabilize both the soft excess temperature and emission ratio relative to the power-law emission.
The blurred reflection model
The observed constancy of the soft excess temperature seems to suggest a nature tied to atomic processes, which can naturally explain its universal ”temperature”.
The first possibility is reflection of the power-law continuum produced by the corona over the accretion disc. The physical mechanism is the same as for the production of the Fe Kα line and the hard-X-ray bump, but this time the reflection is done on the inner regions of the accretion disc. If the upper layer of the accretion disc is ionized, the disc Compton reflection component will contain many X-ray lines
1.3. THE X-RAY SPECTRUM OF SEYFERT 1 GALAXIES 9
Figure 1.4: Example of six different soft X-ray excess in Seyfert 1 galaxies. From top to bottom, in order of increasing 2-10 keV luminosity, MCG-6-30-15, Mrk 766, NGC 5548, Mrk 509, 1H 0419-577 and PKS 0558-504. Taken from Pounds & Reeves (2002).
Figure 1.5: Schema of the different models explaining the soft X-ray excess. From left to right: double Comp-tonization, blurred reflection, smeared absorption. The different part of the diagrams are: SMBH, accretion disc (yellow), hot corona (blue), second corona (green, for the first model only), outflowing absorber (pink, last model).
Figure 1.6: Representation of how an ionised absorption can reproduce the soft-excess. The black line repre-sents the intrinsic power-law emission (withΓ = 2.7; the red line represents the absorbed emission; the blue line represents the absorbed emission when the smearing is taken into account. Taken from Gierli´nski & Done (2004).
(Ross & Fabian 2005) that will be broadened by the relativistic motion of the material on the surface of the accretion disc, forming a featureless continuum (Crummy et al. 2006).
The smeared absorption model
An alternative, based as well on atomic processes, is absorption by an ionised medium, which can im-print its main features in the soft X-ray band. If the absorber is moving relativistically (for example, in the form of a disc wind) it may, as well, produce a featureless curved continuum and reproduce the soft excess. In this scenario, the soft-excess would be indeed an absorption feature, and not an emission component, coming from the incorrect estimation of the intrinsic power-law spectral index produced in the hot corona (see Gierli´nski & Done 2004, , and Fig. 1.6).
Numerical simulations indicate however that, to reproduce the excess, the velocities of such a wind have to be extremely high (Schurch & Done 2008), suggesting that the flow has to be clumpy and/or only partially covering the source, or associated with a magnetically driven jet.
1.3.4
The warm absorber
The last component of the X-ray spectrum of Seyfert 1 galaxies we introduce, are the absorption features generated by the so-called ’warm absorber’. These absorption lines are present in the soft-X-ray part
1.3. THE X-RAY SPECTRUM OF SEYFERT 1 GALAXIES 11
Figure 1.7: Schema of the visible-to-X-ray emission observed in Seyfert 1 and Seyfert 2 galaxies. The key-ingredients are the same: continuum emission from the hot corona, reflection over the distant region of the accretion disc (and on the torus), absorption by ionized gaz, emission from broad and narrow line regions. For Seyfert 2 galaxies, the presence of the torus hiddens the inner region of the system, and the observed X-ray continuum is heaviliy absorbed. Please notice that the soft-X-ray excess component is not considered in this plot. The orizontal plot shows the broad-band spectrum observed in Seyfert 1 galaxies, while the vertical plot shows the braod-band spectrum observed in Seyfert 2 galaxies. Taken from Mushotzky et al. (1993).
of the spectrum, and are associated with an ionised medium (which explains the adjective warm). The current generation of X-ray satellites, with the excellent energy resolution provided by XMM-Newton and Chandra, permits a thorough study of the warm absorber properties, revealing a complex scenario, with multiple-phase absorbers (see also Section 2.4.1), occasionally blue-shifted with respect to the observer (i.e. associated with an outflow), and showing time variability in both ionisation and covering-factor. For a review of the status of our knowledge on the warm-absorber, see e.g. Turner & Miller (2009) and referencese therein.
In the next Chapter we will discuss the results achieved on the warm absorber observed in the Seyfert 1 galaxies Mrk 509 and Mrk 841, but it is important to note that Suzaku is not the best instrument to study such a component, given its relatively-low energy resolution. In particular to better constrain the warm absorber parameter, we will make use of the results obtained with the more performant RGS instrument on-board XMM-Newton.