Development and Performance of a Miniature,
Low Cost Mass Spectrometer
MASSACHUSETTS INSTTURE
by
OF TECHNOLOGYBrian D. Hemond
JUL 2
9 2011
B.S. Massachusetts Institute of Technology (2004)
LIBRARIES
M.Eng. Massachusetts Institute of Technology (2006)
ARCHIVES
Submitted to the Department of Mechanical Engineering
in partial fulfillment of the requirements for the degree of
Doctor of Philosophy in Mechanical Engineering
at the
MASSACHUSETTS INSTITUTE OF TECHNOLOGY
June 2011
©
Massachusetts Institute of Technology 2011. All rights reserved.
Author ...
.'.
...
...
Department of Mechanical Engineering
Feb 14, 2011
C ertified by ...
...
...
Ian W. Hunter
Hatsopolous Professor of Mechanical Engineering
Thesis Supervisor
Accepted by ...
g...v
...
David Hardt
Chairman, Department Committee on Graduate Theses
Development and Performance of a Miniature, Low Cost
Mass Spectrometer
by
Brian D. Hemond
Submitted to the Department of Mechanical Engineering on Feb 14, 2011, in partial fulfillment of the
requirements for the degree of
Doctor of Philosophy in Mechanical Engineering
Abstract
A miniature, low cost mass spectrometer has been developed that is capable of unit resolution over a mass range of 10 to 50 AMU. The design of the mass spectrom-eter incorporates several new features that enhance the performance of the design over comparable instruments. An efficient ion source allows a relatively low power consumption without sacrificing resolution. Variable geometry mechanical filters al-low for variable resolution. An onboard ion pump removes the need for an external pumping source. An onboard digital controller allows a large degree of flexibility over the operation of the mass spectrometer while eliminating the need for high voltage electrical feedthroughs. The miniature mass spectrometer is sensitive to fractions of a percentage of inlet gas, and formatted mass spectra are returned digitally to a laptop. Thesis Supervisor: Ian W. Hunter
Acknowledgments
The author is deeply indebted to his thesis advisor, Professor Ian W. Hunter, for the opportunity and resources to perform innovative research in one of the best laborato-ries at MIT. The guidance of the author's thesis committee, also including Professors
Steven B. Leeb, and Derek Rowell, has been invaluable.
Many others have made important marks on the thesis, in the form of new di-rections and refinements on old ideas. Dr. Jim Bales at the Edgerton Center and Dr. Barbara Hughey of the 2.671 Undergraduate Teaching Lab are two of these such persons.
The author would like to thank his parents, Professor Harold Hemond, and Dr. Carol Thomson, for their unending support, ideas, and the occasional warm meal.
Contents
1 Introduction 15
1.1 Motivation.... . . . . . . . 15
1.2 Principles . . . . 17
1.3 Mass Spectrometer Types . . . . 18
1.3.1 Mass Analyzers . . . . 18
1.3.2 Ion Sources . . . . 19
1.3.3 Detectors . . . . 19
2 Design 21 2.1 Design Overview . . . . 21
2.2 Mass Spectrometer Design . . . . 24
2.2.1 Vacuum System Design. . . . . 24
2.2.2 Mass Analyzer Design . . . .. . . . 26
2.2.3 Ion Source Design. . . . . 30
2.2.4 Sample Jet . . . . 35
2.2.5 Detector Design. . . . . 36
2.2.6 High Vacuum Pump Design . . . . 37
2.2.7 Inlet . . . . 38
3 Simulation 41 3.0.8 Dimensioning . . . . 41
3.0.9 Ion Flight Simulations . . . . 44
4 Construction 51
4.1 Substrate . ... .... .. . . .. .. . . . .. .. . . 51
4.2 PCB Design and Construction.. . . . . . . . 53
4.3 Electrodes . . . . 55
4.3.1 Mass Analyzer . . . . 56
4.3.2 Electrostatic Lens Electrodes . . . . 57
4.3.3 Electron Beam Electrodes... . . . . . . . 59
4.3.4 Electrode Finishing . . . . 59 4.3.5 Magnet . . . . 60 4.3.6 Ion Pump... . . . . . . . . 61 4.4 Assembly . . . . 61 5 Electronics 69 5.1 Power supply . . . . 69
5.2 Ion optics drivers . . . . 70
5.3 Electrometer... . . . . . . . 71 5.4 Degas Heater . . . . 72 5.5 Digital controller . . . . 72 5.6 Control Software . . . .. . . . 73 5.6.1 Boot.. . . . . . . . 75 5.6.2 Standby . . . . 75 5.6.3 Idle. . . . . 75 5.6.4 Sweep . . . . 75 5.7 Known Issues . . . . 76 6 Testing 77 6.1 Power and Control Systems . . . . 77
6.2 Electron Beam . . . . 78
6.3 Degas Heater . . . . 79
6.4 Lens Linearization . . . . 81
6.6 Mass Spectra . . . . 6.7 Introduction of New Species 6.8 Ion Source Modulation . . . 6.9 Results . . . . 7 Conclusions 97 7.1 Further W ork . . . . 98 A Controller Schematic . . . . . . .... ... ... . . . . . . . . . . . .
List of Figures
2-1 A CAD model of the magnet yoke . .... ... 28
2-2 A plot of ion source potential verses ion mass. . . . . 30
2-3 A drawing of the optics used in the ion source. . . . . 36
2-4 A cutaway drawing of the direct-to-atmosphere membrane inlet. . . . 39
3-1 A simulation of the ion gun with indications of where the elements
referred to in the text are placed. . . . . 43
3-2 A SIMION simulation of a carbon dioxide molecules transiting the
miniature mass spectrometer. . . . . 45
3-3 Detailed view of the ion source and first lens . . . . 46
3-4 Isometric view of the potential energy distribution in the mass spec-trometer ion source and analyzer. The curvature of the green potential energy surface indicates the effect of the electrostatic lenses. The verti-cal dimension is potential energy, while the two horizontal dimensions
are the plan form of the mass spectrometer. . . . . 47
3-5 Side cutaway view of the cylindrical Pierce diode ion source. Electrons
are emitted from the surface of a filament in a line. A cathode po-tential electrode surrounds the filament to screen it from the vacuum chamber. The grid and anode electrodes are shown at the right edge
of the sim ulation. . . . . 49
3-6 Side cutaway view of the cylindrical Pierce diode ion source, with the
4-1 A CAD layout of the printed circuit board substrate that underlies the
whole mass spectrometer. . . . . 54
4-2 A CAD layout of the whole mass spectrometer. . . . . 55
4-3 A CAD model of the mass analyzer electrode, with the slits mounted
on flexures. ... .. .. .. .. .. .. . ... .. .. .. .. 58
4-4 (left) Electrodes are cut from stainless steel plate by wire EDM. (right)
Electrodes are etched in nitric acid to remove the oxide layer. .... 60
4-5 A CAD model of the anode for the miniature ion pump. . . . . 62
4-6 A photograph of the completed mass spectrometer, with top cover and
magnet yoke removed. . . . . 63
4-7 A photograph of the entrance slit to the mass analyzer, showing how
it m ay be adjusted. . . . . 64
4-8 A photograph of the completed mass spectrometer, attached to the
ConFlat flange used for testing. . . . . 66
4-9 A of the vacuum chamber used in the development of the mass spec-trometer. The ion gauge is on the left and the turbopump at the bottom. 67
5-1 A block diagram of the digital controller for the mass spectrometer. . 74
6-1 A graph of chamber pressure verses time, with the heater transitions
indicated. . . . . .. .. .... . . . .. 80
6-2 A series of thermal images taken at 0, 10, 20, 60, 300, and 600 s after the heater is activated. Thermal range is 30 C (black) to 60 C (white). 81 6-3 A graph of the microprocessor's command voltage verses the actual
output of each lens driver. . . . . 82
6-4 (top) A graph of the system pressure, ion pump voltage and ion pump
6-5 A graph of the system pressure, ion pump voltage and ion pump cur-rent, in the minutes following segmentation of the vacuum system. Note that the system pressure remained relatively constant at 8 x 10⁻⁴
Pa [6 x 10⁻⁶ torr], but the pump failed because the power supply
volt-age collapsed. The supply could provide only 3 W. . . . . 85
6-6 A photograph of the plates of the disassembled ion pump. Colored
deposits are likely chromium from the stainless steel anode. . . . . 86
6-7 A mass spectrograph captured by an early variant of the miniature
mass spectrometer prototype. . . . . 88
6-8 A mass spectrograph of air captured by the instrument described in
this thesis. . . . . 89
6-9 A mass spectrograph indicating the value of capturing and using a larger fraction of the ions generated by the electron beam. The signal displayed in the blue curve, in which the electrostatic lenses are active, is nearly an order of magnitude higher than the red curve, in which
the lenses were disabled. . . . . 91
6-10 A mass spectrograph indicating the effectiveness of narrowing the slits that filter the ion beam. Peaks such as m/z 27 and 26 are invisible with wider slits, as shown in the blue curve, but readily visible in the
red curve, with narrow slits. . . . . 92
6-11 A mass spectrograph showing the detection of a new species, nitrous
oxide or N20, and its fragmentary component NO. . . . . 93
6-12 A mass spectrum indicating the usefulness of a modulatable grid. In this spectrum, the mass spectrometer's ion source grid was used to generate a trace that could be subtracted from the signal to remove
List of Tables
6.1 A table of mass spectrometer supply current in different modes of
op-eration . . . . .
Chapter 1
Introduction
1.1
Motivation
Mass spectrometery is one of the leading chemical analysis tools. A mass spectrom-eter, often used as a detector in conjunction with another instrument (e.g., a gas chromotograph), is capable of determining the relative abundances of the chemical species present in a gaseous sample by separating the species by atomic mass.
Mass spectrometry is widely used across many disciplines. Mass spectrometers have been sent aboard unmanned spacecraft; both of the Viking landers carried gas
chromotograph/mass spectrometer (GCMS) packages [1], and the Cassini-Huygens
probe dropped into Titan's atmosphere carried a GCMS as well [2]. Mass spectrom-eters are heavily used in the biological sciences; they are one of the commonly used methods of determining protein structure and sequence.
In the medical field of pharmacokinetics, mass spectrometry has been used to track extremely small quantities of drugs through the human body [3].
Mass spectrometers have been designed for chemical and biological defense; the Block II CBMS (chemical biological mass spectrometer) was designed to be a portable, vehicle mounted instrument capable of detecting chemical and biological threats (e.g. nerve agents, bacteria) in the field [4]. More recently, mass spectrometers have been carried aboard unmanned submersibles to aid in the tracking of hydrocarbons released by the Macondo oil well failure in the Gulf of Mexico on April 20, 2010 [5].
Many other fields have employed mass spectrometry as well. As early as 1976 a mass spectrometer was used to continuously analyze the respired gases of patients on ventilators in intensive care for potentially dangerous complications [6]. For various reasons, probably including both the size and cost of the mass spectrometer, this technique has not been widely adopted despite its obvious benefits.
Truly, the mass spectrometer is an extremely versatile instrument, but it is not without some drawbacks. Mass spectrometers are generally large, complex, expensive instruments requring a substantial amount of electrical power for operation. Progress has been made on the size front, a pair of small instruments, the Mini 10 and Mini 11 [7] developed by Purdue University exist, and small analyzers such as the quadrupole by Microsaic Systems [8] have been built.
To date, none of these instruments incorporate small size, low power consumption, and minimal cost. The applications for such an instrument are wide and varied. Such instruments could be deployed in large quantity to blanket wide areas for air or water quality monitoring, installed in industrial exhaust stacks for combustion process feedback control, or attached to hospital ventilators or used as first response tools in emergency rooms.
However, simply addressing a subset of the issues involved in producing such an instrument, while potentially useful, fails to address the need. A miniature mass spectrometer design must address all of the issues, simultaneously, to be of any value beyond academic. These issues are, in approximate order of importance:
Size: The design must be small enough to be handheld.
Power: The design must be capable of running in remote usage on minimal power for a useful length of time.
Cost and Manufacturability: The design must be inexpensive enough to build and assemble such that it can be widely deployed.
Developing a mass spectrometer that addresses these three issues is the primary objective of this thesis.
1.2
Principles
Many different implementations of mass spectrometers exist, and the configuration often depends on the intended application. Generally, however, they consist of the same basic functional blocks: an inlet, an ion source, a mass analyzer, a detector, and a vacuum system. Samples entering the inlet are ionized, usually by bombardment with an electron beam, then separated by mass using one or more electric and/or magnetic fields, then analyzed for relative abundance.
Ultimately, all of the implementations of the mass spectrometer produce a graph relating the atomic mass-to-charge (m/z) ratios of the components of the ionized sam-ple to the relative abundance of each component. For examsam-ple, a mass spectrometer measuring a sample of atmosphere would find components at masses 28, 32, 40, and 44, and possibly others depending on the sensitivity of the instrument. These masses correspond to nitrogen, oxygen, argon, and carbon dioxide. The mass spectrometer output will show the highest signal strength for mass 28, nitrogen, which comprises 70% of atmospheric gas, followed by about 1/3 the signal strength of the nitrogen peak for oxygen, at 32 (22% of the atmosphere), and lower signal strengths still for argon and carbon dioxide.
Mass spectrometers are generally designed for specific mass ranges and resolutions, depending on the application. Mass ranges might be 10 to 50 AMU for an instrument designed for environmental gas monitoring, or many tens of thousands of AMU for in instrument used in protein analysis. The mass spectrometer often scans through this mass range by varying one of the electric or magnetic field parameters, producing a spectrum in both mass-to-charge (m/z) ratio and, undesirably, time. The scan will produce peaks in signal intensity where masses are present. The resolution of the mass spectrometer is determined by how narrow these peaks are; some mass spectrometers may only resolve unit masses while some may resolve extremely small fractions of mass (e.g. for distinguishing different species that appear at the same nominal unit mass, such as carbon monoxide at 28.010 and nitrogen at 28.0134). Peaks are often characterized by full-width half-maximum (FWHM) measurements; the width of the
peak at half of its amplitude can help in determining which masses will be visible. In general, mass spectrometers that produce narrower peaks have better resolving power than those with wide peaks.
1.3
Mass Spectrometer Types
Many different types of mass spectrometer exist, generally classified by the method used to separate the different masses. This section briefly covers some of the simpler types of mass spectrometer, and although nowhere near comprehensive, describes those that have potential to be manufactured inexpensively.
1.3.1
Mass Analyzers
The simplest and earliest type of mass spectrometer is the magnetic-sector device that produces a spatial separation in mass. In this design, ionized samples are accelerated in an electric field and injected into a region with a perpendicular magnetic field. The radius of curvature of the ion's trajectory in the magnetic field is proportional to its mass and inversely proportional to its charge state. By scanning either the electric field, and therefore varying the ion's kinetic energy, or scanning the magnetic field and varying the ions trajectory, the various masses can be separated and detected independently. Many variants of this design exist, including some with separate or combined electric and magnetic sectors, producing improved resolution.
A time-of-flight mass spectrometer is another simple design that produces a tem-poral separation in mass. Ions are injected into a drift region by a fixed electric field; the separation in ultimate ion velocity and therefore arrival time at the far end of the drift region is proportional to ion mass.
A quadrupole mass spectrometer uses two pairs of electrodes parallel to an ion flight path; by applying a variable-frequency RF field using one electrode pair and a DC bias on another, and tuning the RF field for a specific mass, only one mass at any given time has a stable trajectory through the fields.
A similar type of mass spectrometer, the ion trap mass spectrometer, uses princi-ples similar to the quadrupole mass spectrometer to trap clouds of ions in a volume and selectively make the orbits of specific masses unstable. The unstable masses are then ejected from the ion volume and measured.
1.3.2
Ion Sources
In order for any of these mass analyzers to function, samples injected into the mass spectrometer must first be ionized. Only after ionization can the sample molecules be manipulated and separated by magnetic and/or electric fields.
The most common form of ion source uses electron ionization. In this type of source, an electron beam, usually generated thermionically, is aimed into a gaseous sample. Electrons interacting with sample molecules remove electrons from the sam-ple, producing positively charged sample ions, although negative ion mass spectorme-tery is practical for some electronegative chemical species.
1.3.3
Detectors
Once a sample has been ionized and the resulting ions separated by mass, they must then be detected. The simplest detector is a Faraday cup followed by a high gain transconductance amplifier. Ions striking the Faraday cup produce a tiny but mea-surable current that is then amplified and recorded. However, since these detectors provide no intrinsic gain, the noise floor is that of the amplifier.
Other types of detectors employ discrete or continuous dynodes, similar to that of a photomultiplier tube without the photocathode. Ions striking the first dynode dislodge electrons, which fall down a series of increasingly higher voltage dynodes, each iteration producing twice or more the number of electrons. This electron cloud is then captured and measured by a transconductance amplifier, but the signal can be many orders of magnitude larger than a simple Faraday cup detector, without a significantly higher noise floor, thus allowing for much more sensitive detection.
Chapter 2
Design
Many factors were considered in choosing the initial design of the miniature mass spectrometer. Ultimately a simple, robust design, capable of being fabricated without complicated or labor-intensive manufacturing techniques, is preferable to any design that can never be built in quantity.
Ideally, the design should be manufacturable using automated machine tools. Manufacturing can be simplified further by creating a planar design that relies solely on two dimensional machining; any features in the third dimension can be built or approximated by stacking multiple layers of 2D-machined components. Eliminating secondary machining operations is also important. Secondary machine operations invariably involve extra fixturing, time, and waste. Thus, the design incorporates as many cofabricated features as possible.
2.1
Design Overview
Unlike many mass spectrometers, which consist of a number of custom components (e.g. filaments, electrodes, etc.) integrated with standard off-the-shelf components (e.g. vacuum gauges, flanges, fittings), the mass spectrometer presented in this thesis was designed using a system level approach. Every major system of the design was examined and, where possible, designed to be integral to the overall design.
op-erated in a simple, cylindrical vacuum chamber with a port for gas inlet, several low-voltage cables, and a port for a roughing vacuum pump. All of these ports have been successfully implemented with thin tubing or cabling fed through the vacuum chamber wall and embedded in epoxy.
Nearly every choice is a tradeoff among multiple factors, among them performance, size, weight, power consumption, complexity, ease of manufacture, and cost.
This mass spectrometer is designed with a number of potential applications in mind, but for the most part, with common performance requirements. The mass spectrometer is designed for unit resolution (i.e. it can can discriminate between ions one or more integer mass units distant) with enough sensitivity to detect species comprising of 0.5% or more of the analyte gas at an operating pressure of 1 x 10-Pa [1 x 10⁻⁶ torr]. The mass spectrometer must also carry its own high vacuum pump onboard; while slightly less versatile than a design incorporating both the high vacuum and roughing pumps, the substantial savings in cost, weight, and complexity are invaluable so long as the mass spectrometer can run on its own for long periods of time. This in turn places emphasis on low power consumption as well as low maintenance.
Secondly, the production cost of the mass spectrometer is important. An instru-ment providing this level of performance is of limited utility if the production cost is comparable to that of an existing commercial instrument (e.g. tens of thousands of dollars). The mass spectrometer needs to be quite inexpensive, on the order of $1000, as it is intended for large-scale deployment in novel applications. Figuring into the cost of the mass spectrometer is ease of manufacture and complexity; diffi-cult or skilled manufacturing techniques and/or large numbers of parts would make the design more expensive.
Thirdly, minimizing power consumption is important. A mass spectrometer meet-ing the above specifications would be ideally suited for a variety remote or portable applications, in which the mass spectrometer would need to be capable of running for long periods of time off of batteries or perhaps solar power.
requiring complicated 3D electrode geometries, high power RF electric fields, or pre-cise timing abilities were determined to be unsuitble for reasons of manufactuing complexity, power consumption, and scalability. Essentially this rules out designs based on quadrupole and ion trap analyzers (complicated geometries and high power consumption), time of flight designs (precise timing, loss of resolution at small scale), leaving only those designs using magnetic mass analyzers such as the magnetic sector analyzer and cycloid analyzer.
The miniature mass spectrometer detailed in this thesis is a single-focusing 180-degree magnetic sector mass spectrometer. The major reason for this choice is that it was hypothesized that a magnetic sector mass spectrometer could be designed to be constructed using layers of planar components, that could greatly reduce the ultimate cost of the instrument, as most simple manufacturing techinques are 2-dimensional. The geometries involved are simple and no high power RF oscillators or high speed timing abilities are needed, as is the case with a quadrupole or time-of-flight mass spectrometer, respectively. Most other mass spectrometer types such as ion trap or Fourier-transform types tend to be even more demanding in terms of geometry, power, or complexity.
A set of permanent magnets and yoke creates the magnetic field for the mass analyzer. With the ready availability of NdFeB magnets this is an obvious choice; an electromagnet requres too much power for a small instrument. Additionally, a second benefit is available with a permanent magnet. By carefully choosing the sizes of the pole pieces for the yoke, the design can incorporate an ion pump into the same magnetic circuit that encloses the analyzer, thus saving on complexity, size, and parts count. The length of the magnetic sector analyzer was chosen to be 180 degrees, simplifying the layout and minimizing the size of the design by placing the ion source and detector on the same side of the instrument.
The design of each subsystem of the mass spectrometer is detailed in the following sections.
2.2
Mass Spectrometer Design
2.2.1
Vacuum System Design
The entire length of the ion flight path must be kept at high vacuum, i.e. at pressures
below 1 x
10-
4 Pa [1 x 10⁻⁶ torr]. At higher pressures, the mean free path for anion becomes too short for enough of them to transit the entire length of the flight path. This criterion alone necessitates the use of a vacuum system with very tight tolerances to minimize the leak rate, as well as a vacuum pump capable of producing the high vacuum.
At the same time, the mass spectrometer's vacuum system must contend with a constant influx of gas; the gas entering the system from the inlet must be contin-uously pumped back out or captured lest the vacuum chamber pressure rise to an unacceptable level. Thus, the vacuum system must also incorporate a one or more vacuum pumps capable of pumping faster than the inlet leak rate.
In most mass spectrometers, the vacuum system is a very expensive part of the design. Compared to the cost of a typical instrument, the vacuum system may not be a large percentage of the overall cost, but for a miniature inexpensive design, the vacuum components alone may easily dominate the budget.
High vacuum components, even standard fittings, are extremely expensive. Nearly every component is constructed of machined or formed stainless steel, typically with welded junctions. Mass spectrometers often use custom vacuum components just due to the geometry of the instrument. For example, a magnetic sector mass spectrometer often has a formed, thin walled, welded section of stainless steel tubing welded to high vacuum flanges for the mass analyzer. This is typically required because the mass analyzers flight path must fit between the poles of the magnet, and the gap is rarely a standard size.
Moreover, electrical signals typically need to be fed into and out of the vacuum sys-tem; at a minimum, voltages for every electrode in the system are required. Typically this is anywhere from five to 10 or more separate potentials, and the feedthroughs may be needed at multiple different points in the vacuum system. High voltage
elec-trical feedthroughs are also expensive, due to the need to braze Kovar conductors with ceramic insulators and stainless steel flanges, and minimizing the number of signals penetrating the vacuum chamber is a priority.
The simplest method for minimizing vacuum system cost is to minimize the num-ber of components involved. The design of the vacuum system for the miniature mass spectrometer makes a radical departure from the design of all other existing instruments. The miniature mass spectrometer was designed to fit, in its entirety (in-cluding magnets, power and control electronics, high vacuum pump, and ion optics, etc.), within a 100 mm diameter by 150 mm length vacuum chamber. No similar instrument of this size exists.
The mass spectrometer can be mounted on a single vacuum flange through which all of the electrical signals and the inlet pass, and the vacuum chamber can therefore consist of a 100 mm diameter cylindrical pipe for simplicity. Indeed, a simple but smaller vacuum chamber could be constructed that follows the contours of the instru-ment to minimize size and weight. To minimize the number of electrical feedthroughs, all data will be handled digitally and all control signals will be generated inside the vacuum housing by an onboard control system. In this manner, only two or three low-voltage electrical signals need to be fed through the chamber walls; power and one or two data lines. These three electrical lines may be simple lengths of cable embedded in low-outgassing epoxy, since high isolation is not necessary. Ground reference can be the chamber itself.
A refinement of this design might be capable of transmitting data wirelessly via infrared or RF through the vacuum chamber walls of a glass chamber, making only a single electrical feedthrough for power necessary. Eliminating this might be possible through inductive coupling.
This leaves the issue of maintaining the high vacuum. The miniature mass spec-trometer incorporates a cofabricated ion pump, designed to use the same permanent magnet and yoke assembly that the mass analyzer uses. Of course, an ion pump by itself is not sufficient to pump down a mass spectrometer from atmospheric pressure, so a valved port needs to be provided for rough-pumping the chamber to a point at
which the ion pump can start. This port can be mounted on the same flange as the electrical feedthrough and inlet.
2.2.2
Mass Analyzer Design
The mass analyzer is a 1800 magnetic sector, with an ion flight centerline radius of 23 mm. This is in part a practical consideration; 50 mm x 25 mm NdFeB magnets are available without requiring custom fabrication, and some clearance is required between the ion flight radius and the edge of the magnet because the ion flight will never be perfectly circular due to the inevitable nonlinearities of the magnet's field.
The length of the sector, 1800, is a deliberate choice. Primarily, more spatial separation between ion beams of adacent mass is realizable, as more of each ion's flight is within the sector. Secondly, with a 180' sector, both the ion source and the detector are located on the same side of the mass analyzer, leading to a more compact design and no complications with locating the magnet yoke. This benefit is achievable only in this miniature design; larger instruments typically have separate vacuum compartments for the ion source and detector and the sector length in these instruments is typically limited by the size of the magnet.
The resolution of the mass spectrometer depends heavily on the design of the mass analyzer. Generally speaking, the stronger the magnetic field, the smaller the radius of curvature.
There is a tradeoff between field strength and weight and cost. The maximum magnetic field strength using permanent magnets is in the range of 0.5 to 1 T, using high grade (N52) neodymium-iron-boron magnets. Higher fields require more coercive force: more magnet thickness in the direction parallel to the gap, and more iron in the magnet's return path. This leads to a heavier and larger design.
Likewise there is a tradeoff between resolution and signal strength and cost; nar-rowing the filter slits leads to higher resolution, but fewer ions complete the flight, requiring a detector with a higher gain for a given noise floor. Furthermore, as the width of the slit is narrowed, alignment of the slit with the axis of the ion beam becomes more critical, leading to tighter tolerances and inevitably, larger cost.
The present design eliminates the need for filter fixturing and alignment by cofab-ricating the slits with the chassis of the analyzer. Furthermore, the slits are themselves mounted on flexures integral to the analyzer chassis such that the geometry may be varied at assembly; the slit width can be modified to change the operating point on the signal/resolution curve. A further refinement of this design would drive the slit width actively, either by leadscrew or, more likely, by piezo or potentially by shape memory alloy actuators.
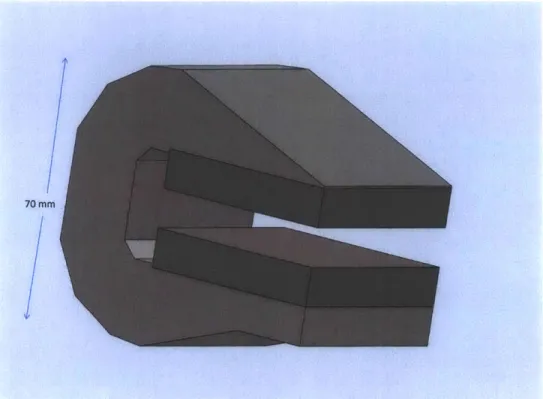
A pair of 50 x 50 x 10 mm N52 neodymium-iron-boron magnets in a yoke con-structed of 1008 mild steel is used in this design. The yoke increases in cross section from the leading edge of each magnet to 25 x 50 mm at the trailing edge of each mag-net. As shown in Figure 2-1, the cross section of the yoke is approximately constant beyond the magnet. A 10 mm gap is left between the trailing face of the magnet and the yoke to avoid shorting the magnet. The yoke mass, including the magnets, is approximately 1.4 kg.
The yoke also incorporates features for mounting; a pair of holes in the return path allows the magnet, itself the heaviest part of the mass spectrometer, to be bolted to the vacuum flange.
The gap between pole faces is 10 mm, approximately the same air gap as magnet thickness. This configuration produces a field ranging from approximately 0.6 T at the edges of the pole face to about 0.8 T in the center. A CAD model of the magnet yoke is shown in Figure 2-1. The non-uniformity of this field is not ideal; nonuniformity leads to trajectory errors in the ion beam and ultimately, lower resolution.
Given the field strength and ion flight radius, it is a simple matter to calculate the range of ion energies, and therefore the ion acceleration potentials, required to run the mass spectrum sweeps. First is a force balance: in the mass analyzer, the force required to keep an ion on a circular trajectory is equal to the ions mass multiplied by the centripetal acceleration, and is provided by the Lorentz force due to the ions charge and the applied magnetic field,
70 mm
Figure 2-1: A CAD model of the magnet yoke.
mv
2qvBsin9= r
r
where;
B magnetic field strength in T,
m v ion velocity in -,
s
0 angle between ion beam plane and magnetic field in radians,
m = ion mass in kg,
q = elementary charge in C,
r = ion curvature radius in m.
The velocities give the range of voltages required to accelerate the ions. Final ion velocity, that is, the velocity of the ion as it exits the ion source into the analyzer, is proportional to the voltage E across the electrodes in the ion source,
1
qE = -mv2
2
These equations can be combined to give the relationship between ion mass and the potential required to accelerate the ion in order for it to reach the detector,
qB
2 (sin0)
2r2E(m) = m
2m
So there is an inverse relationship between the required electric field and the mass of the ion, as expected. Heavier ions require more kinetic energy to traverse the analyzer with the proper radius, given constant charge. Assuming each molecule is singly ionized (q = 1.60 x 10⁻¹⁹ C) and within the intended mass range, 10 to 44 AMU (m = 1.66 x 10⁻²⁶ to 8.3 x 10⁻²⁶ kg), an analyzer radius r of 23 mm, and a
perpendicular B field (0 = 0), the equation can be simplified to,
B2
E(m) = 4.23 x 10⁻²³
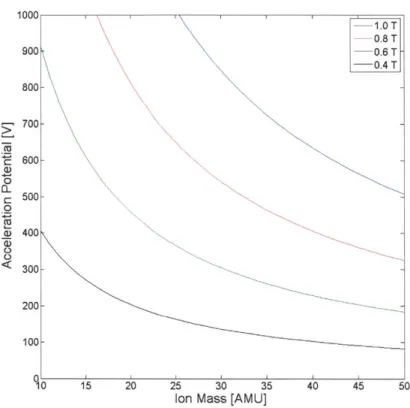
For an operating point of B = 0.6 T and mass range of 10 - 44 AMU, the voltage
E required to accelerate the ions must sweep from about 208 V to 915 V. These potentials are attainable, given the dielectric strength of high vacuum. Moreover, there are many methods capable of generating these voltages efficiently. Voltage generation will be discussed in a later section.
Figure 2-2 is a plot of ion source potential verses ion mass for different B field strengths. Note that since this is an inverse power function, resolution will decrease as ion source potential decreases because the same change in ion soure potential will span a much larger mass range. This is a feature intrinsic to magnetic sector mass spectrometers, and this design is no different. This issue will be discussed in more detail in Chapter 6.
1000 -00 -d~ 600- 500-00 C 500-0 __ 400 <300- 200- 100-90 15 20 25 30 35 40 45 50
Ion Mass [AMU]
Figure 2-2: A plot of ion source potential verses ion mass.
2.2.3
Ion Source Design
The ion source is of considerable importance to both the efficiency and the perfor-mance of the mass spectrometer as a whole. Ions are typically formed by electron ionization; an electron gun generates an electron beam that interacts with the sample gas to form positive ions. This type of ion source has historically been called "elec-tron impact ionization", however, due to the wavelike nature of elec"elec-trons, the exact
mechanism of ionization is not related to particle impact
[91.
The ion source must be located far enough from the magnet yoke structure such that the fringing fields from the magnet do not affect the trajectory of the electrons. The distance required, determined empirically, is approximately 30 mm.
Furthermore, the ion source is designed with an electron beam oriented vertically, essentially in parallel with the fringing fields of the magnet. This minimizes the chance that the electron beam will be sent off course by stray fields.
Electron Source Design
The electron beam is typically generated thermionically; a hot wire, usually tungsten or an alloy, is heated to incandescence, adding enough thermal energy to some of the electrons in the wire such that they can overcome the work function of the bulk metal and escape into the surrounding vacuum. The escaped electrons are removed from the area surrounding the wire using electrostatic fields.
This process of generating electrons is typically inefficient; furthermore, the prob-ability of an interaction between an electron in the beam and a molecule in the sample gas resulting in the formation of an ion is also low, on the order of 0.1% [9].
Ideally these ions would emerge from the ion source in a collimated beam of appropriate geometry for subsequent flight through the analyzer. In practice, ionized molecules have a random distribution within the ionization region, and only a small fraction of the ions produced emerge from the ionization region in the appropriate direction to be analyzed.
To improve this last issue, most mass spectrometers have employ a electrostatic field produced by an electrode, typically called the repeller, in the ionization region to sweep ions towards the analyzer; however, the field produced by this electrode is relatively low.
The result is that the ion yield of a mass spectrometer using a thermionic electron gun is extremely low. Thus, a high current electron beam is desirable to maximize the total production of ions, but this requires a large investment in electrical power. For a portable instrument, an improvement in the efficiency of the ion source is required. There are essentially three methods by which the efficiency of the ion source may be improved. The yield of electrons for a given filament power may be increased, through the use of improved emissive materials. The yield of ions may be improved by increasing the probability of interaction between the electron beam and the sample gas, by changing the trajectories of the electron beam (e.g. a helical instead of straight trajectory). Finally, it might be possible to capture more of the ions that would form but therwise not be swept into the analyzer. Both high efficiency emissive materials
and methods of increasing ion yield were examined.
The final ion source design focuses mostly on improvements to ion yield, as inves-tigations into high efficiency emission materials proved inconclusive. The ion source in this design operates by ionizing a large volume of ions using a large diameter elec-tron beam, producing an ion beam with a wide dispersion, and then using a series of electrostatic lenses to collect and collimate these ions into a uniform ion beam.
The large, cylindrical electron beam is produced by a simple, low power tungsten filament and a circular aperture in an anode. This structure is called a Pierce diode and well understood; it was studied extensively in the days of vacuum tubes and appears in reference literature [10]. The diameter of the electron beam is quite large, at 3 mm, and is used to ionize a large volume of sample gas. However, instead of directing these resultant ions through an adjacent, narrow mechanical filter, the entire volume is gathered and focused with electrostatic lenses.
In the Pierce diode, the current density of the current emitted from the anode hole is,
T 2
Jmax = 2.34 x 10 V",
where,
A
Jmax = is the current density in ,
V voltage between anode and cathode in volts,
r radius of anode hole in m,
d = distance between anode and cathode in m.
For a distance of d = 5 mm between the filament and the entrance of the ion
source and a potential of V = 70 V, the emission current is 120 pA.
The emission angle of the Pierce diode is,
r
3d'
O
= beam angle in degrees,r = radius of anode hole in m,
d = distance between anode and cathode in m.
For the Pierce diode used in this electron source, the beam angle is 0.10.
The emissive material generating the electrons must be capable of producing 120 pA of electron current within a 3 mm diameter circle, which is the diameter of the hole in the anode. The space-charge limited emission from an incandescent tungsten filament, as a function of temperature, adapted from [11],
- 52230
imax = 60.2 x 10⁴T2exp
T
where,
A
imax is emission current density in of emissive surface,
T = surface temperature in K.
A
At 2500 K, the current density from a tungsten emitter is 3170 . Producing a
120 pA electron current therefore requires 4 x 10⁻⁶ m2 of emissive surface. The area
of the anode hole is 7.1 x 10⁻⁶ m2
, so this is achievable.
Producing 4 x 10~6 m2 of emissive surface in a 7.1 x 10⁻⁶
n2 window is a difficult task. While a tungsten filament 3 mm in length and 0.4 mm in diameter would both fit within the anode aperture with enough surface area, such a filament would be inefficient and difficult to manufacture. The thickness of such a filament would conduct much of the heat out through the supply leads and supporting structure, and require on the order of 10 A according to filament design tables [12], leading to significant losses in connections to the filament and in the filament power supply itself.
Alternatively, the emissive surface area can be produced using a thinner, coiled tungsten wire. Coiled filaments are rarely, if ever, used in mass spectrometers.
The thinner wire of a coiled filament is less thermally conductive, leading to a more efficient system because less of the heat is carried out of the filament power
leads, and for the same power input can be run at a higher voltage and lower current. Fifteen turns of 12 pum diameter tungsten wire, with a turn diameter of 1 mm and
pitch of 0.2 mm has a surface area of 4 mm2 and a length of 3 mm.
These values are not unreasonable; similar filaments exist. A support structure consisting of glass or ceramic insulators and copper conductors could be designed to support such a filament, but alternatives exist. An additional electrical consideration is that of voltage; the voltage drop across the filament directly influences the shape of the electric field surrounding the filament; as such, the filament should operate on as low a voltage as possible. For a given brightness this means more current, and heavier, more thermally conductive supports.
A filament with essentially this ideal configuration is already mass produced as a flashlight bulb, typically designated PR-2. The PR-2 draws 2.4 V at 0.5 A, and has a coiled filament approximately 1 mm in diameter and a length of approximately 3 mm.
The mass spectrometer's ion source was designed to use a PR-2 flashlight bulb with the glass bulb carefully removed. Application of vise jaws allows the bulb to be shattered without damaging the delicate filament structure in the middle.
The electric field across the Pierce diode is set to 70 V. As a result, the electrons emitted from the Pierce diode anode hole are at approximately 70 eV. This value of kinetic energy is a commonly accepted value for maximizing the number of ions produced by electron ionization for a given electron current. This is due to the fact that the de Broglie wavelengh of an electron at 70 eV is 14 nm, which is approximately the length of the bonds between atoms in many molecules [9]. At 70 eV, the de Broglie wavelength of the electron is given by,
h
my
where,
A = de Broglie wavelength in m,
m = particle mass in kg, m
v = particle velocity in -. S
Ion Lenses
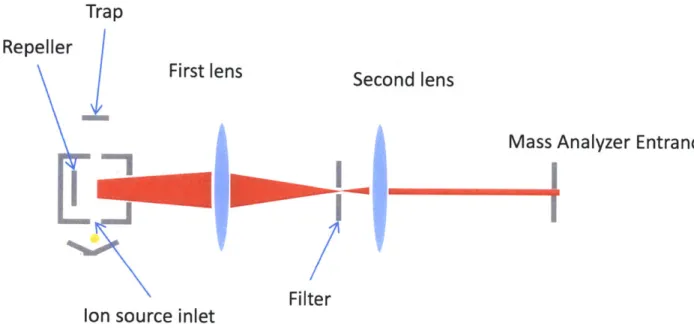
The other half of the ionization source involves capturing the ions generated by this relatively large electron beam. The volume of ions is swept from the ionization region with a weak electrostatic field, then focused on a large slit by a three element sym-metric electrostatic lens, also known as an Einzel lens. These ions would subsequently diverge again beyond the filter, but a second two element lens defocuses the beam slightly, changing the focal point to a point infinitely distant from the filter. This beam is then ideally suited for analysis. A diagram of this lens system is shown in Figure 2-3.
Grid
A novel feature not found on existing mass spectrometers is a grid. The grid is an electrode that screens the anode of the Pierce diode from the cathode; potentials on this grid electrode can enhance or prevent the emission of electrons from the cathode. The grid, as an electrostatic element, may be rapidly modulated, operating in much the same way as the control grids in a vacuum tube. The signal used to modulate the thermionic emitter can be used with advanced signal processing techniques such as synchronous detection or stochastic system identification to improve the signal to noise ratio of the mass spectrometer as a whole.
2.2.4
Sample Jet
One of the unknowns is how well the electron beam interacts with the incoming sample gas. To maximize the interaction between the sample gas and electron beam, a hole is provided in the center of the trap electrode. Sample is then directed downward through the trap, while electrons are beamed in the opposite direction.
Trap
Repeller
First lens
Second lens
Mass Analyzer Entrance
Filter
Ion source inlet
Figure 2-3: A drawing of the optics used in the ion source.
2.2.5
Detector Design
The ion beam that ultimately reaches the detector may be on the order of tens to 100s of fA. The detector at the outlet of the mass analyzer needs to be capable of detecting these minute currents and producing a signal above the noise floor intrinsic to the detector.
The detector of the miniature mass spectrometer is a Faraday cup followed by
a transconductance amplifier with a gain of 50 x 109. The Faraday cup is designed
to capture the incident ion beam as well as recapturing any electrons produced by secondary emission. Since the incident ion beam can have quite large energies, on the order of hundreds of eV, secondary emission is a concern. The Faraday cup electrode shape is designed to capture secondary emission by providing a deep cavity into which the incident ion beam travels that recaptures all electrons that are emitted in any direction but perpendicularly back out. However, since the Faraday cup is still within the fringing field produced by the permanent magnet, any secondary emission
electrons will not travel in straight trajectories and will therefore be captured by the cup.
The transconductance amplifier is built around a National Semiconductor LMP7721 (www.national.com) low input bias operational amplifier. Operating with supplies of
±2.5V,
the LMP7721's input bias currents are on the order of 3 fA. A 50 GQresis-tor in parallel with a 5 pF silver-mica capaciresis-tor for stability provide the amplifier's feedback path.
The output of this transconductance amplifier drives the front end of a Texas Instruments ADS1278 24-bit analog-to-digital converter. By placing these compo-nents in close proximity and under appropriate shielding, the intrinsic noise may be reduced.
2.2.6
High Vacuum Pump Design
The miniature mass spectrometer requires a pump to maintain the high vacuum of the vacuum envelope. While many portable mass spectrometers, such as the Mini 11 [7], use turbomolecular pumps for vacuum maintenance, such pumps represent a significant fraction of the power consumption of the instrument, and must be backed by mechanical pumps.
Another type of high vacuum pump often employed is an ion pump; these pumps are silent, clean, and employ no moving components. In an ion pump, two pumping mechanisms, both capture and sorption, are in in operation. While pumping, gases are ionized by high field ionization in cylindrical anodes and accelerated into titanium or sometimes tantalum cathodes. Upon impact, the ions are either buried or cause titanium to sputter back to the anode. This constantly renewed layer of titanium is chemically reactive and captures gases by sorption.
There is relatively little literature on the specific geometries involved in the design of ion pumps. However, several general references exist. Two good but unpublished references by engineers at Duniway Stockroom, Inc. are available online which give general guidelines for the design of ion pumps [13, 14]. Other references give infor-mation on the operation of the discharges in the pump [15, 16]. Another unpublished
article provides information on the correlations between ion pump geometries and pumping speed [17].
The electrodes for the ion pump need to be located within a magnetic field, which generally adds mass to the system and complexity to the vacuum chamber. How-ever, the miniature mass spectrometer is already designed with a magnetic circuit located within the vacuum chamber. The size of the pole faces of the magnet can be increased to encompass the footprint of a miniature ion pump as well, adding a pumping capability without a significant increase in complexity.
The ion pump designed is the simplest variety, a diode pump, which consists of a set of stainless steel hollow cylinders, open on each end, suspended between a pair of titanium plates. The pump is designed to produce the maximum pumping speed in the area available. Specific geometries and tradeoffs are discussed in a further section. The ion pump must keep the system pressure low enough such that the mean free path of the ions is greater than the entire flight length of the mass spectrometer. For this miniature mass spectrometer, the length of the flight path is approximately 200 mm. The mean free path of an ion, adapted from [9], is given by,
3.71 x 10⁻⁷ p where,
1
= mean free path length in m,p = pressure in Pa.
The intent is to keep the mean free path of an ion an order of magnitude larger than the flight length of the mass spectrometer. For a mean free path of 2 m, the minimum system pressure is 3.3 x 10⁻³ Pa [2.48 x 10- torr].
2.2.7
Inlet
Every mass spectrometer needs an inlet. While this thesis is not about the design of the inlet, as the mass spectrometer as a whole will work with many different types of inlet, this does require some consideration.
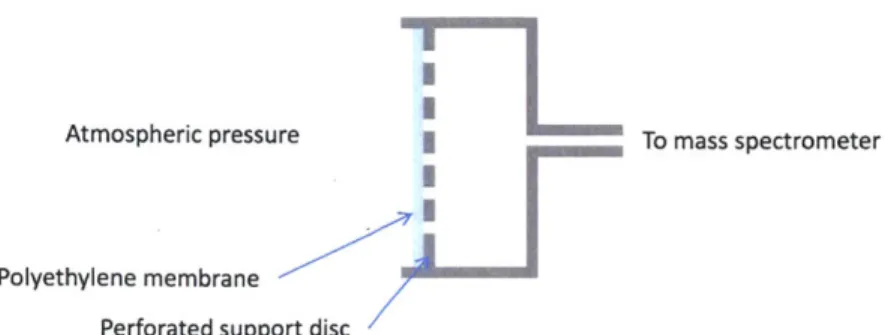
Atmospheric pressure
Perforated support disc
Figure 2-4: A cutaway drawing of the direct-to-atmosphere membrane inlet. A simple, existing type of inlet was chosen for testing. A semi-permeable hy-drophobic plastic membrane supported by a perforated stainless steel plate allows gases to diffuse into the vacuum chamber at a rate proportional to the exposed sur-face area of the membrane, while preventing the influx of water vapor and liquids. The inlet rate is chosen such that the mass spectrometer's pumping system can handle the inlet gas load at an appropriate vacuum chamber pressure.
A schematic of the inlet is shown in Figure 2-4.
Chapter 3
Simulation
The miniature mass spectrometer ion optics design was extensively simulated using SIMION 8.0, a commercial ion optics modeling software package [18]. Modeling the ion flight is a crucial verification of the design presented in the previous chapter.
Additionally, the design from Chapter 2 is incomplete insofar as the exact dimen-sions of the various components are not set. Given the parameters from Chapter 2, as well as some additional guidance, the geometries of the mass spectrometer can be determined. The solution space for a set of dimensions given a set of parameters (e.g. magnet strength, ion radius, etc) is quite large, and some additional information is required to complete the solution.
3.0.8
Dimensioning
The ultimate solution is the result of an interative process; a few initial choices were revisited due to undesireable simulation results (e.g. the voltages required on the electrodes to properly focus the ion beam were too large, generally those greater than 1 kV).
First, the overall height of the mass spectrometer's analyzer was set. The vertical dimension is somewhat arbitrary. The permanent magnets used are both 10 mm in height, and the gap was chosen to match this figure. Leaving some 1.5 mm for the thickness of each of the top and bottom covers of the mass analyzer, the vertical
dimension was then set to 7 mm.
The radius of the mass analyzer was set to 23 mm in the previous chapter. Using this as a controlling dimension, the remainder of the mass spectrometer ion optics and flight path was designed to be no more than 50 mm in length. The electron beam was placed as far from the magnetic sector as possible, to minimize the influence of the stray magnetic field on the operation of the electron beam.
The next decisions involved the size of the first lens. The first lens collimates the volume of ions created by the electron beam and focuses them on a mechanical filter. This lens is a three element symmetric lens, otherwise known as an Einzel lens, and described as symmetric because the first and third lens elements are at the same potential. This type of lens was chosen because it is a variable focus lens that does not change the energy of the ion that emerges from the other side.
As described in chapter five of Building Scientific Apparatus [10], electrostatic lenses should be built with approximately the same width as element length, with an element spacing equal to a tenth of the length. Such lenses typically have focal lengths that are of equal distances on both sides of the lens; hence, the filter following the first lens is the same distance from the lens as the ionization region.
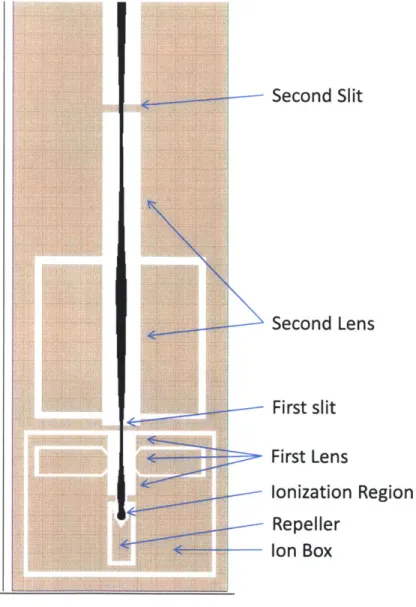
Figure 3-1 is a diagram of the ion source captured from the SIMION simulation of the mass spectrometer.
The second lens, used to defocus the beam sligthly (e.g. placing its focal point at infinity), is a two element lens that roughly equally subdivides the region between the first mechanical filter and the second mechanical filter. The longer electrode faces provide a slightly more uniform field; the exact placement of the electrodes is slightly less crucial.
A second mechanical filter after the second lens further limits the beam dispersion to minimize stray ions reaching the detector. This filter was deliberately placed 10 mm from the nominal entrance to the magnetic sector, since the fringing fields from the magnet are quite strong, and may nudge the ion beam off course before it reaches the filter.
-
Second Slit
Second Lens
First slit
First Lens
Ionization Region
Repeller
Ion Box
Figure 3-1: A simulation of the ion gun with indications of where the elements referred to in the text are placed.
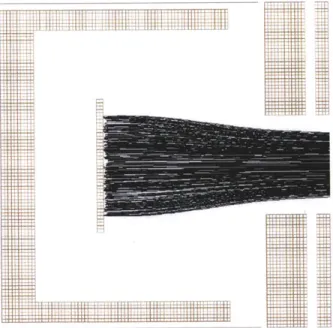
flight path, extend perpendicularly well away from the flight path. This is also delib-erate; although a flat plate would behave identically in this simulation, in practice it would be nearly impossible to fabricate. The depth of the electrodes allows them to be mounted to a common plane; the simulation is done this way as a reminder that the electrodes need to be mounted somehow. The shapes of the back sides of the electrodes are not critical.
3.0.9
Ion Flight Simulations
The entire mass spectrometer design was simulated and found to conform to the initial design work. Simulations were done for ions of mass 10 AMU to 44 AMU. The voltages required on the various electrodes roughly conform to the predictions.
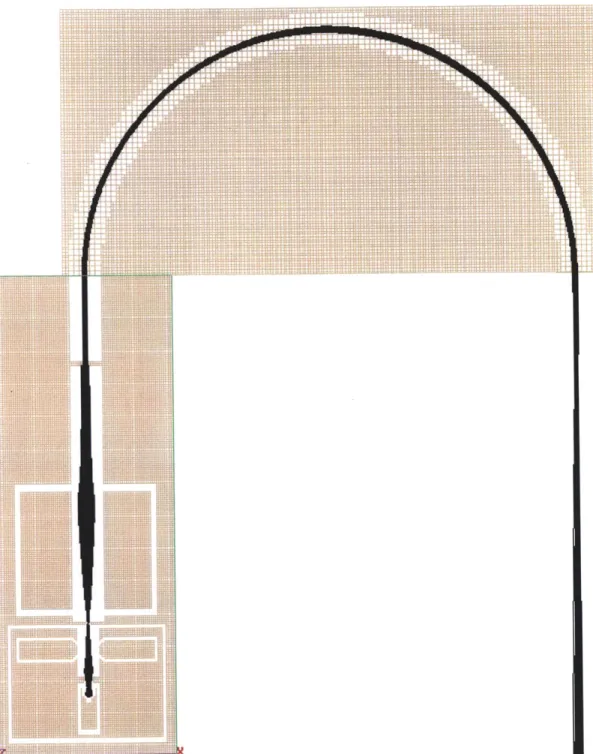
Figure 3-2 is a typical simulation showing the flight of carbon dioxide molecules through the mass analyzer. It is worth remembering that SIMION does not simulate either space charge, ion collisions, or secondary electron emission; the simulations are done on single, isolated ions in the geometry provided. The effects of fringing electric
fields are simulated.
It is important to note that the simulation is done under ideal conditions, and one can easily be led off track by improper choice of initial conditions. For example, a simulation done on a stationary ion beginning dead center in the ion beam is likely to behave much more favorably than an ion near the edge of the ionization region with an initial velocity perpendicular to the intended path. An improper choice of initial conditions will lead to a belief that a design will work with much higher ion efficiency and resolution than the design can realistically produce. Thus, the initial conditions for ions in the flight path must be carefully chosen.
Ion initial energies were chosen to have a gaussian spread centered around the thermal energy of a gas molecule at room temperature.
The average translational energy of a gas molecule of an ideal gas is, 3
E = -kT
I ~f rip
Figure 3-2: A SIMION simulation of a carbon dioxide molecules transiting the minia-ture mass spectrometer.
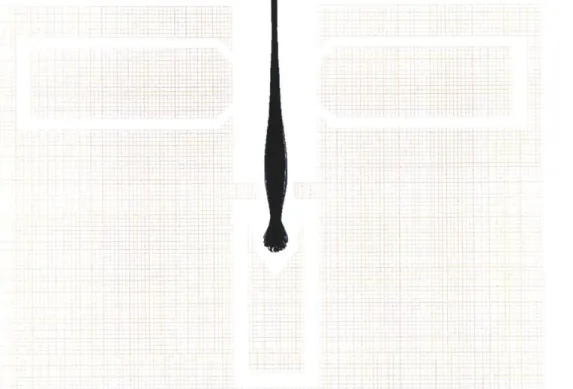
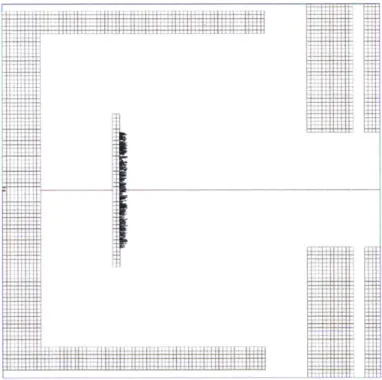
Figure 3-3: Detailed view of the ion source and first lens.
where,
E kinetic energy in J,
k = Boltzmann constant (8.617 x 10⁻⁵eVK- 1),
T = temperature in K.
At room temperature, E is approximately equal to 0.015 eV. Therefore all of the later trajectory simulations were done using a gaussian distribution of initial kinetic energy with a mean of 0.015 eV and a standard deviation of 0.005 eV.
Ion initial direction was set using a uniform distribution across 360 degrees radially. Ion initial position was set using a uniform distribution across a cylinder above the projection of the hole through which the electron beam enters the ionization region.
Figure 3-3 is a detailed view of the ion source and first lens of the mass spectrom-eter. Ions originate in the center, generated by a vertical, cylindrical electron beam, directed vertically out of the page. The initial trajectories of the ions are generated with random direction and random kinetic energy.
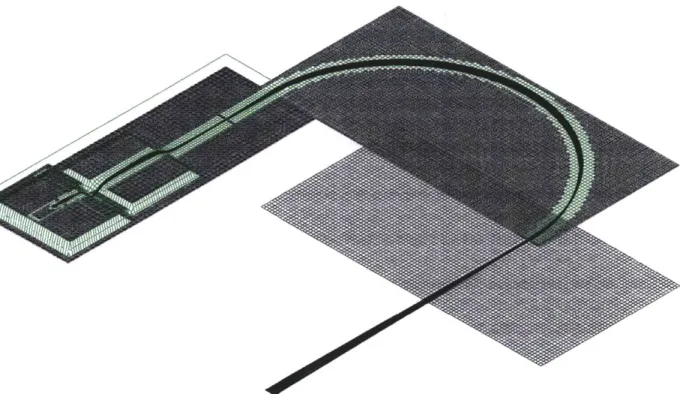
Figure 3-4: Isometric view of the potential energy distribution in the mass spectrom-eter ion source and analyzer. The curvature of the green potential energy surface indicates the effect of the electrostatic lenses. The vertical dimension is potential en-ergy, while the two horizontal dimensions are the plan form of the mass spectrometer.
The black traces in the simulation diagrams are computed trajectories of ions given a hopefully realistic set of initial conditions. It is reasonable to neglect space charge, due to the low magnitude of the ion current.
Figure 3-4 is an isometric view of the mass spectrometer, with the physical layout represented in two dimensions and potential energy represented in the third, vertical dimension. Here, the wisdom of a longer, lower voltage second lens becomes more apparent; any slight misalignment in a higher voltage lens would cause a much larger trajectory error in the ion beam, as the potential energy 'obstacle' the beam must climb over would be much steeper.