HAL Id: insu-02778058
https://hal-insu.archives-ouvertes.fr/insu-02778058
Submitted on 31 Aug 2020HAL is a multi-disciplinary open access
archive for the deposit and dissemination of sci-entific research documents, whether they are pub-lished or not. The documents may come from teaching and research institutions in France or abroad, or from public or private research centers.
L’archive ouverte pluridisciplinaire HAL, est destinée au dépôt et à la diffusion de documents scientifiques de niveau recherche, publiés ou non, émanant des établissements d’enseignement et de recherche français ou étrangers, des laboratoires publics ou privés.
Change in the pulse component separation for PSR
J1906+0746
G. Desvignes, Ismaël Cognard, M. Kramer, A. Lyne, B. Stappers, Gilles
Theureau
To cite this version:
G. Desvignes, Ismaël Cognard, M. Kramer, A. Lyne, B. Stappers, et al.. Change in the pulse com-ponent separation for PSR J1906+0746. 40 YEARS OF PULSARS: Millisecond Pulsars, Magnetars and More, Aug 2007, Montréal, Canada. pp.482, �10.1063/1.2900280�. �insu-02778058�
Change in the pulse component separation for PSR
J1906+0746
G. Desvignes*, I. Cognard*, M. Kramer^, A. Lyne^ B. Stappers** and
G. Theureau*'^
*Laboratoire cle Physique et Chimie cle I 'Environnement (LPCE), CNRS-Orleans, France "^ University of Manchester, Jodrell Bank Observatory, Cheshire, SKI 1 9DL, UK
**Astronomical Institute 'Anton Pannekoek', University of Amsterdam, Kruislaan 403, 1098 SJ Amsterdam,The Netherlands; Stichting ASTRON, Postbus 2, 7990 AA, Dwingeloo, The Netherlands
^GEPI, Paris Observatory, France
Abstract. PSR J1906+0746 is a highly relativistic binary pulsar, discovered with the P-ALFA survey in June 2005 [4]. Within a such system, it is expected to observe geodetic precession with a high precession rate. Possible first signs of pulse profile evolution were observed using archival data of the Parkes MultiBeam Survey and by Kasian et al. [3]. By combining the data from the Nanfay and Jodrell Bank Radiotelescopes, we report on the clear detection of pulse profiles changes, a shift between both components of the pulse at a rate of 2.1° ±0.1° per year However, only a marginal variation in the relative amplitude was found. We also noticed variations in the slope of the Polarisation Position Angle and in the circular polarisation in the main pulse area, using Nanfay polarimetric data.
Keywords: pulsars; binary; geodetic precession; polarisation PACS: 97.60.Gb
INTRODUCTION
OBSERVATIONS
The recent discovery of the binary pulsar PSR J1906+0746 (P=144 ms) in 3.98-hr orbit immedi-ately suggested that the geodetic precession could be observable in short timescale. This effect would cause a change in the longitude separation of the two main components, if we assume them to be the opposite side of a hollow cone, as the hue of sight crosses a different part of the beam. Up to now, only 4 pulsars in binary systems exhibit changes in the mean pulse profile. A precession period of about 200 years following the standard geodetic precession formula is expected, de-pending on the nature of its companion. Furthermore, the no-detection of the secondary pulse in archival data from 1998 and an increase of the SNR for the main pulse between 1998 and 2005, suggested the first sign of change of beam orientation with respect to our fine of sight [4]. A possible change in the profile was also noticed by Kasian et al. [3].
In the framework of the EPTA collaboration, we present the observations made with Nangay Radio Tele-scope (hereafter NRT) and the Lovell radioteleTele-scope at the Jodrell Bank Observatory and quantify the profile changes.
The NRT is a meridian-type telescope, equivalent to a 94 m single dish, where maximum integration time is 1 hour per day. The observations were carried out from June 2005, shortly after the discovery, to June 2007, at a centre frequency of 1.4 Ghz. A bandwidth of 64 MHz was coherently dedispersed by the Berkeley-Orleans-Nangay (BON) backend [1]. TEMPO was used to build a rotational model of the pulsar from the individuals 2 minutes TOAs. Higher SNR profiles can then be obtained for different integration times from minutes to weeks. A detained timing analysis of the rotational behaviour of this pulsar will be presented in a forthcoming paper by Kasian et al.
Observations from the 76m Lovell telescope were ob-tained at 1.4 Ghz with a 64 x 1 MHz filterbank in-strumentation. Lovell data are well complementary to Nangay ones, providing much longer integration times, from 30 minutes up to several hours, though with a sparser samphng.
PULSE PROFILE CHANGES
In a binary pulsar system, the angle between the spin axis and our fine of sight will change if the pulsar spin axis is misaligned with respect to the orbital angular momentum [2]. Assuming a circular hollow-cone beam shape forCP983, 40 Years of Pulsars-Millisecond Pulsars, Magnetars, andMore, edited by C. G. Bassa, Z. Wang, A. Gumming, and V. M. Kaspi, O 2008 American Institute of Pliysics 978-0-7354-0502-8/08/$23.00
FIGURE 1. The top two profiles represent respectively the first and second year of the NRT observations where all subin-tegrations are realigned and folded using the rotational model. Substracting the second to the first, we build a difference profile shown at the bottom.
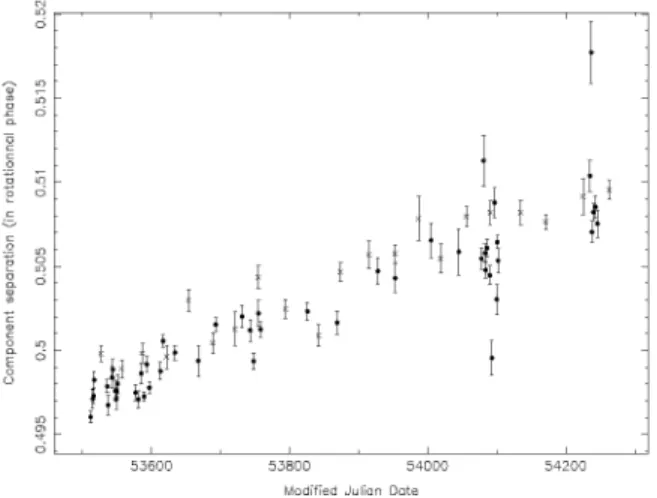
53800 54000 Modified Julian Date
FIGURE 2. Component separation in terms of rotationnal phase agains MJD. The points indicate the NRT data, the crosses the IBO data. A drift of 2.1° ±0.1° per year was fitted to the data.
1906+0746, we expect to see a change in the components separation with time.
From 'equivalent SNR' profiles obtained on the first and the second year of observation, a 'difference' profile was built (see figure 1). A clear signature of a stretching, corresponding to a change of the component separation is seen.
We integrated observations from the NRT over one month, letting us with 21 monthly profiles. Including the Jodrell data, we measured the separation between the two components in terms of rotational phase. The result is shown in figure 2. We fitted the points by a straight line and found a drift of2.1°±0.1° per year.
We also studied the amplitude ratio of the two compo-nents versus time (Figure 3). Because the Jodrell data are not dedispersed over 1 MHz, the narrow main pulse un-dergo a more important spreading than the broader sec-ond pulse, leading to a different amplitude ratio when
53800 54000 Modified Juiion Dote
FIGURE 3. Amplitude ratio of the two components against MJD. The points indicate the NRT data, the cross the IBO data.
compared to coherent observations from the NRT. A marginal variation of the ratio can be seen in both datasets.
POLARISATION CHANGES
The classical model for pulsar polarimetry is the rotating vector model (RVM) by Radhakrishnan & Cooke [5]. It predicts a characteristic S-shaped curve in the measured Position Angle (PA), when the emission beam sweeps past our line of sight. NRT data were integrated over 2 months to provide 11 high quality profiles. As seen in figure 4, small strucuture changes are observed in the upper part of the main component, as if a substructure was wandering around with a caroussel like behaviourIn the bottom panels of figure 4 and figure 5, the slope of the PA is observed to slowly change. A tilt is even seen at the same time the profile seems to be depolarized. The circular polarisation, the dot-dash-dot fine in figure 4 is also vanishing along the two years of observation.
CONCLUSION
A separation of the two components was observed at a rate of about 2.1° per year using NRT and Jodrell data, as well as small structure changes for the main pulse. Nangay polarimetric data also indicate major polarisa-tion changes. These changes detected in only two years of observation are probably due to geodetic precession, which manifest itself at short timescales as expected. A such system will hopefully permit to do a quick mapping of the radio beam in the near future.
Jun 06, 2005 Aug 05, 2005 Oct 04, 2005 Dec 17, 2005 Feb 28, 2006 May 19, 2006 Jul 25, 2006 Oct 11, 2006 Dec 22, 2006 Feb 25, 2007 May 05, 2007
28 29 30 31 32 Pulsar phase ( m s )
FIGURE 4. Nanfay polarimetric data. Each inset represents a zoom (over 4ms) in the main pulse area. The full line represents
the Total Intensity, the dotted line the linear polarisation and the dot-dash-dot line the circular polarisation. The polarisation position angle is shown in the lower panel.
Modified Juiidn Ddte
FIGURE 5. Slope of the position angle under the main pulse
against MJD.
REFERENCES
I. Cognard and G. Theureau, On the Present and Future of Pulsar Astronomy, 26th meeting of the lAU, Joint
Discussion 2, 16-17 August, 2006, Prague, Czech Republic, JD02, #36, 2
T. Damour and R. RuflRni, 1974, C. R. Acad. Sc. Paris, SerieA,279, 971
Kasian, L. E. & Consortium, P. 2006, in American Astronomical Society Meeting Abstracts, 04.02 Lorimer et al. 2006, ApJ, 640, 428
Radhakrishnan, V. & Cooke, D. J. 1969, Astrophys. Lett., 3,225