HAL Id: hal-00296449
https://hal.archives-ouvertes.fr/hal-00296449
Submitted on 19 Feb 2008
HAL is a multi-disciplinary open access
archive for the deposit and dissemination of
sci-entific research documents, whether they are
pub-lished or not. The documents may come from
teaching and research institutions in France or
abroad, or from public or private research centers.
L’archive ouverte pluridisciplinaire HAL, est
destinée au dépôt et à la diffusion de documents
scientifiques de niveau recherche, publiés ou non,
émanant des établissements d’enseignement et de
recherche français ou étrangers, des laboratoires
publics ou privés.
Tropical Tropopause Layer (TTL) during NH winter
K. Krüger, S. Tegtmeier, M. Rex
To cite this version:
K. Krüger, S. Tegtmeier, M. Rex. Long-term climatology of air mass transport through the
Trop-ical Tropopause Layer (TTL) during NH winter. Atmospheric Chemistry and Physics, European
Geosciences Union, 2008, 8 (4), pp.813-823. �hal-00296449�
© Author(s) 2008. This work is distributed under the Creative Commons Attribution 3.0 License.
Chemistry
and Physics
Long-term climatology of air mass transport through the Tropical
Tropopause Layer (TTL) during NH winter
K. Kr ¨uger1,*, S. Tegtmeier1,**, and M. Rex1
1Alfred Wegener Institute for Polar and Marine Research, Potsdam, Germany *now at: IFM-GEOMAR, Kiel, Germany
**now at: University of Toronto, Toronto, Canada
Received: 11 September 2007 – Published in Atmos. Chem. Phys. Discuss.: 28 September 2007 Revised: 3 January 2008 – Accepted: 18 January 2008 – Published: 19 February 2008
Abstract. A long-term climatology of air mass transport
through the tropical tropopause layer (TTL) is presented, covering the period from 1962–2005. The transport through the TTL is calculated with a Lagrangian approach using ra-diative heating rates as vertical velocities in an isentropic tra-jectory model. We demonstrate the improved performance of such an approach compared to previous studies using vertical winds from meteorological analyses. Within the upper part of the TTL, the averaged diabatic ascent is 0.5 K/day during Northern Hemisphere (NH) winters 1992–2001. Climatolog-ical maps show a cooling and strengthening of this part of the residual circulation during the 1990s and early 2000s com-pared to the long-term mean. Lagrangian cold point (LCP) fields show systematic differences for varying time periods and natural forcing components. The interannual variability of LCP temperature and density fields is found to be influ-enced by volcanic eruptions, El Ni˜no Southern Oscillation (ENSO), Quasi-Biennial Oscillation (QBO) and the solar cy-cle. The coldest and driest TTL is reached during QBO east-erly phase and La Ni˜na over the western Pacific, whereas during volcanic eruptions, El Ni˜no and QBO westerly phase it is warmer and less dry.
1 Introduction
The tropical tropopause layer (TTL) is the main entrance re-gion for trace gases traveling from the troposphere into the stratosphere. For this reason it is important to understand the underlying dynamical and microphysical processes. Some important factors affecting the trace gas content and variabil-ity in the stratosphere are the temperature history and the amount of water vapour of the air parcels, their residence
Correspondence to: K. Kr¨uger
(kkrueger@ifm-geomar.de)
time in the TTL and the geographical distribution of their individual transition into the stratosphere. A better represen-tation of these factors in transport models will also help to clarify which role very short lived substances (VSLS) like bromocarbons could play in depleting stratospheric ozone (WMO, 2007).
Recent investigations show that both horizontal and verti-cal transport processes in the TTL play a role in dehydrat-ing air parcels that eventually enter the stratosphere. For this kind of studies trajectory calculations are used (La-grangian approach), driven by all three wind-components from meteorological assimilations (Bonazzola and Haynes, 2004; Fueglistaler et al., 2004). Fueglistaler and Haynes (2005) were able to show that the observed variability of stratospheric water vapor in the TTL is consistent with the temperature history of air parcels. However, using vertical winds to drive trajectory calculations in the TTL has been shown to result in unrealistic vertical transport while other aspects of transport are well represented (Wohltmann and Rex, 2007). But in general, the formulation of vertical trans-port typically limits our understanding of the dynamical pro-cesses in the TTL.
In this study we present a long-term climatology of trans-port processes in the upper part of the TTL during the cold season (NH winter), covering the operational analyses of the European Centre for Medium Range Weather Fore-cast (opECMWF) (Simmons et al., 2005) and 40-years of ECMWF reanalysis (ERA40) (Uppala et al., 2005) period. In contrast to previous TTL studies an alternative approach is explored to better constrain the vertical velocities in isen-tropic trajectory models of this region of the atmosphere: we apply a reverse domain filling trajectory model coupled with a radiative transfer model to calculate diabatic heating rates, that are used as vertical velocities. Such an approach was applied by e.g. Schoeberl et al. (2003).
The following questions will be newly addressed in this study: Does the Lagrangian cold point (LCP) distribution in the TTL derived by this approach differ from previously pub-lished results? How fast is the large-scale diabatic ascent in the TTL? How do natural forcing components impact the in-terannual variability of LCP? The answers will be presented as follows: First the model and method employed are de-scribed in Sect. 2. Section 3 highlights the main results for a case study, a climatology and processes influencing the in-terannual variability. Results are discussed and summarized in Sects. 4 and 5.
2 Model and method
For this transport study we are using a trajectory model with a different approach for the TTL. Radiative heating rates (Q) are applied as vertical velocity in a quasi-isentropic trajec-tory model in the stratosphere to avoid the noisy (Manney et al., 2005b) and too high vertical velocities of meteorolog-ical assimilations (Meijer et al., 2004; Scheele et al., 2005; Monge-Sanz et al., 2007). Such an approach can be em-ployed in the stratosphere, where radiative processes are de-termining the slow mean meridional circulation (Andrews et al., 1987). Calculated diabatic (Q6=0) heating rates are directly used as vertical velocities in a quasi-isentropic tra-jectory model (D2/Dt=Q, with the potential temperature
2). For the polar lower and mid-stratosphere (McKenna et al., 2002; Chipperfield, 2006; Konopka et al., 2007; Tegt-meier et al., 20071) and for the tropical lower stratosphere (Schoeberl et al., 2003), the usefulness and superiority of this approach was demonstrated. In principle the approach is valid for all levels above the region, where latent heat re-lease (e.g. in convection) contributes significantly to vertical transport. Indeed, for the upper part of the TTL, the level between the cold point tropopause and the level of net zero heating (WMO, 2007), convincing results were obtained by comparing in-situ observations with our approach (Immler et al., 2007a).
The new trajectory model was developed, carefully tested and validated by Tegtmeier et al. (2007)1. The trajectories are calculated on isentropic coordinates, using horizontal wind and temperature fields from the ECMWF analyses. The tra-jectory model is a modular tool and can use heating rates (described above) or vertical winds for the vertical transport. In contrast to other trajectory models the input data are not transformed on explicit theta-coordinates. An interpolation on theta-coordinates is just carried out for a given trajectory position. Thus vertical wind fields are not directly trans-ferred into a heating rate but indirectly; details are given in Tegtmeier (2007). As we are interested in the troposphere to
1Tegtmeier, S. Kr¨uger, K. Wohltmann, I. Schoellhammer, K., and Rex, M.: Variations of the residual circulation in the northern hemispheric winter, J. Geophys. Res., revised, 2008.
stratosphere (TS) transport in the tropics, we perform back-ward trajectories starting on a stratospheric level to ensure a large set of tropospheric air masses reaching the stratosphere. Similar as in the study of Bonazzola and Haynes (2004), the backward trajectories are started on a 2◦×2◦ grid from
30◦S to 30◦N on the 400 K isentropic level for the period from December to February (DJF). This leads to a total num-ber of N =5580 trajectories per winter. The trajectory model is run with a time integration step of 20 min, while the out-put is stored every 6 h. The heating rates are derived from a stand-alone version of the ECMWF radiative transfer model (Morcrette et al., 1998), using ERA40 and opECMWF tem-perature, ozone, water vapor, cloud cover and cloud con-tent fields every 6 h. An intercomparison study between the ECMWF and the Fu-Liou radiation scheme (Fu and Liou, 1992) was carried out by Tegtmeier et al. (2007)1for a case study over Galapagos. They demonstrated a very good agree-ment of radiative heating rates within the TTL with differ-ences less than 0.1 K/day, which lies within the range of other radiative transfer models (Gettelmann et al., 2004).
For the trajectory and the radiation calculations, the me-teorological input is interpolated on T106 resolution with a regular 2◦×2◦grid. The 60 vertical hybrid coordinate model levels of ERA40 and opECMWF data are used (L60), which results in a vertical resolution of ∼1 km within the tropi-cal tropopause region. Due to limited data availability this study concentrates on the period 1962/1963 to 2001/2002 for ERA40 and 2000/2001 to 2004/2005 for opECMWF data.
As we are only interested in the TS transport of air masses, the backward trajectories had to pass the isentropic level of 360 K (∼14 km altitude). For each TS trajectory, the lowest temperature along its path is stored, which corresponds to the location of the LCP. The cold point varies with altitude and geographical location, minimizing over the maritime conti-nent at ∼17 km altitude or between 90 and 96 hPa during NH winter (Hashiguchi et al., 2006). The cold point tropopause is almost equal to the tropopause defined by the minimum saturation mixing ratio (Zhou et al., 2001). The water va-por saturation mixing ratio over ice eice at the cold point is
calculated after Sonntags formula (Sonntag, 1994) as it was carried out in the companion study by Immler et al. (2007a). The Lagrangian diabatic heating (QL) is analysed along the
trajectory as the average between 400 K and the LCP ( ˆQLCP).
The duration time and the amount of water vapour of air parcels within the TTL before and after that cold point deter-mine the chemical life times and processes of VSLS reaching the stratosphere. The climatology and composite maps show averages of the trajectories that experienced their cold point inside a 5◦×5◦box. Only grid boxes sampled by
trajecto-ries are shown. The density (ν) of the trajectotrajecto-ries is given by
ν=n/(N ·ny), where N is the total number of all trajectories
per winter, n is the number of TS trajectories per winter and
(a) opECMWF
(c) ERA40
(e) opECMWF 3dwind
(d) ERA40 O3clim
[K]
(f) Occurrence
Fig. 1
(b) op ECMWF O3clim
Fig. 1. Maps of LCP temperature [K] during DJF 2001/2002 for (a) opECMWF heating rates (black line in f), (b) opECMWF heating
rates derived from climatological ozone (green line in f), (c) ERA40 heating rates (red line in f), (d) ERA40 heating rates derived from climatological ozone (orange line in f), (e) opECMWF vertical wind (blue line in f). Each square marks one trajectory. (f) Occurrence of LCP trajectories averaged over 40◦S–40◦N, inside 5◦longitude bins. The numbers in % indicate the percent of trajectories traveling through the 120◦E–180◦E region.
3 Results
Before the TTL climatology and the interannual variability is presented a case study for the NH winter 2001/2002 is given. 3.1 Case study
Figure 1a–e illustrates the location of the LCPs tempera-ture and the distribution of the LCP which are reached dur-ing the three month journey of the trajectories through the TTL. Five different vertical velocity fields were used as in-put for the trajectory calculations. Four of them are based on heating rates as vertical velocities, calculated with four dif-ferent input fields, and one is based on vertical wind fields to drive vertical transport. Clearly, the opECMWF trajec-tories (Fig. 1a and b) are among the coldest with LCPs lo-calized over the maritime continent and temperatures well below 180 K, whereas the LCPs in ERA40 have tempera-tures around 184 K (Fig. 1c and d). These LCP minima occur
in the altitude range between 360 and 380 K isentropic level (not shown here). A larger geographical spread of the trajec-tories is found for the cases using climatological ozone fields (Fig. 1b and d), taking the ECMWF standard ozone clima-tology (Fortuin and Langematz, 1995) as input instead of the assimilated ozone fields (Fig. 1a and c). These two cases indicate the sensitivity of Q due to different ozone fields in the radiative transfer calculations. Figure 1e using vertical winds of opECMWF is outstanding and leads to the largest geographical dispersion of the trajectories and highest LCP temperatures compared to the other two opECMWF cases. However, the general distribution of the LCPs does not seem to change much between the five cases, which is also the case when taking clear sky heating into account (not shown here). For analysing the differences more quantitatively, Fig. 1f dis-plays the density of LCPs over 40◦S–40◦N for 5◦longitude bins for each of the five input data. The occurrence gives the number of all trajectory points from Fig. 1a–e, which are hard to distinguish from each other. The cases using
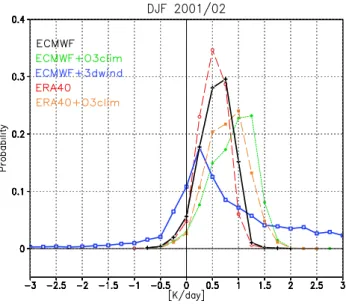
Fig. 2. Probability of ˆQLCP(K/day) for DJF trajectories 2001/02, taking 0.25 K/day bins into account. The color code is as in Fig. 1f.
heating rates (black, red, green and orange lines) show the maximum occurrence of LCP trajectories over 165◦E. For opECMWF with vertical winds (blue line), the maximum oc-currence shifts towards 185◦E. The highest number of LCP trajectories in the western Pacific region is reached for calcu-lations based on opECMWF and ERA40 data using assim-ilated ECMWF ozone fields (over 500), whereas the LCPs in calculations based on opECMWF+3D wind show a more zonal distribution and the maximum number over the cen-tral Pacific is only 200. This larger geographical dispersion of the trajectories using vertical wind fields is also visible in the smaller total amount of zonal LCP trajectories within 40◦S–40◦N. For the calculations based on opECMWF heat-ing rates, 59% of all LCPs lie in the West Pacific region (as defined by 120◦E to 180◦E), while for the calculations based on opECMWF vertical winds only 34% of the LCPs lie in this region. To better understand the reason for these discrep-ancies, Fig. 2 presents the probability density function (PDF) of the Lagrangian diabatic velocity for the upper part of the TTL ( ˆQLCP). All five lines show their maximum at a positive
ˆ
QLCPas would be expected from the mean upwelling
(posi-tive diabatic heating) in the tropical tropopause. ERA40 and opECMWF data (red and black lines) peak at 0.5 K/day and 0.75 K/day heating in contrast to the calculation using the vertical wind from opECMWF (blue line). This PDF shows a broader distribution maximizing at 0.25 K/day with a prob-ability of only 0.18. There is a long tail on both sides of the PDF skewed towards positive heating rates, reaching un-realistically high diabatic velocities of more than 3 K/day, as was also noted by Bonazzola and Haynes (2004). The effect of using the ECMWF standard ozone climatology is illustrated by the green and orange lines, which maximize at 1 and 1.25 K/day with lower frequencies. In the tropical
tropopause region there is slightly more ozone in the standard climatology compared to the assimilated fields (Fortuin and Langematz, 1995; Oikonomou and O’Neill, 2006), which leads to a stronger heating, hence upwelling in the TTL. For the rest of this study we are using the prognostic ECMWF ozone fields as input data. The mean diabatic velocity for ERA40 (red line) is 0.51 K/day and for opECMWF (black line) 0.56 K/day. This value is only 70% of the mean value derived with vertical wind fields of opECMWF (blue line, 0.81 K/day). McFarlane et al. (2007) derived radiative heat-ing rates from Atmospheric Radiation Measurement (ARM) observations with the Fu-Liou radiation code for two tropi-cal stations over the western Pacific during the period March to December 1999 and February to July 2000. They cculate average heating rates of 0.5 K/day around 17 km al-titude, which is in good agreement with our derived heat-ing rates usheat-ing assimilated ECMWF ozone fields. The pres-ence of clouds or the correct simulation of clouds in mod-els impact the vertical distribution of radiative heating rates (e.g. McFarlane et al., 2007). In two companion studies we showed for a tropical (Immler et al., 2007a) and also for a mid-latitudinal station (Immler et al., 2007b), that the sim-ulation of cirrus clouds in opECMWF shows a surprisingly good agreement compared to lidar observations. From an av-erage Q ( ˆQ) one can directly derive the residence time for a certain altitude range in the TTL in units of days per poten-tial temperature layer (altitude difference); a larger ˆQleads to a shorter residence time. From Fig. 2 we derive an av-eraged residence time in the 360–380 K layer of 36 and 40 days using opECMWF and ERA40 data with heating rates, respectively, and only 20 days using opECMWF with verti-cal winds. We can directly compare these numbers with the range of published results, which lie in between the large un-certainty range of 20 and 80 days for the 360–380 K layer (WMO, 2007).
Comparisons with vertical velocities and vertical diffusion rates derived from trace gas transport (Wohltmann and Rex, 2007) also show that the mean and the width of the distri-bution of heating rate calculations are both consistent with observations and much more realistic than the calculations using vertical winds.
Taking the advantage of this improved performance, we are using off-line calculated heating rates as vertical velocity derived from the ECMWF assimilated fields, to analyse the climatology and interannual variability during NH winter. 3.2 Climatology
Figure 3 shows the climatology of LCP temperature, the den-sity of LCPs and the zonal mean ˆQLCPfor different time
pe-riods. The long-term mean from 1962–2001 displays a large region of LCP temperatures below 188 K over the equator. They are coolest and driest in terms of eice from the
mar-itime continent towards the central Pacific (below 186 K and 2 ppmv eice). The highest density of LCP reaches 0.01 just
Fig. 3. DJF long-term climatology; Left: LCP temperature [K] (color) and the density of LCPs (white contours); Right: Zonal mean ˆQLCP [K/day]. Top panel: 1962/1963–2001/2002 ERA40 data; middle panel: 1992/1993–2001/2002 ERA40 data; lower panel: opECMWF data from 2000/2001–2004/2005. Contour intervals for the density are 0.001, 0.005 and 0.01 per 5◦×5◦grid.
south of this cold point, which leads to the interpretation that less air masses are sampled directly through the coldest re-gion. Comparing with Fueglistaler et al. (2005), who show a climatology map for the period 1979–2001, the location of the highest density of air masses crossing the LCP is very similar to our calculations (not shown here). But as noted above, the LCPs in our calculations are even more concen-trated in this region and overall the distribution is less zonal. Two secondary maxima are located over central America and over the African equator. Only few trajectories are sam-pled in the sub-tropics, where LCP temperatures might be less reliable. The middle panel presents the shorter period 1992–2001, where satellite measurements for stratospheric water vapor are available. This period displays the coldest LCP within the ERA40 time period. During this period the LCPs are colder and drier over the Indian, western Pacific and eastern Pacific ocean compared to the long-term mean. The minimum in LCP temperature is located over Microne-sia, whereas the region with the highest density of LCPs lies just southeast of it. In the lower panel, the opECMWF pe-riod shows the extremely cold and dry TTL winters from 2000–2004. The LCP temperatures indicate values below
184 K (∼1.25 ppmv eice) over the maritime continent and
western Pacific accompanied with a westward shift of the LCP density compared to the period 1992–2001. Bearing in mind that opECMWF zonal mean temperatures are system-atically colder compared to ERA40 data by −1 K in average at 100 hPa (Dhomse et al., 2006; Brunn, 2007), this analysed change of −2 K to −4 K in LCP has to be interpreted accord-ingly. This will be discussed in more detail in Sect. 4.
Corresponding with the enhanced wave driving in the NH, observed since the early 2000s (Randel et al., 2006), an in-crease of zonally averaged diabatic ascent is analysed for the 2000–2004 period compared to the long-term climatol-ogy. The weaker zonally averaged diabatic ascent during 1992–2001 in ERA40 data agrees with the weaker wave driv-ing durdriv-ing the cold polar NH winters in the early to mid 1990s (Pawson and Naujokat, 1999), but disagrees with the lower LCP temperatures found over the western Pacific dur-ing 1992–2001 compared to 1962–2001. Inspectdur-ing maps of
ˆ
QLCP(not shown here) reveal local maxima over the
west-ern Pacific of 0.6 K/day during 1962–2001, 0.7 K/day dur-ing 1992–2001 and up to 0.8 K/day durdur-ing 2000–2004. Thus the locally enhanced diabatic ascent during the 1992–2001
period could indicate the influence of enhanced extratropical wave driving observed during the late 1990s and early 2000s compared to the early to mid 1990s (Manney et al., 2005a). For all three periods maximum zonal mean ˆQLCPis reached
north of the equator, indicating the influence of enhanced planetary wave activity of the winter hemisphere. According to the model study by Haynes et al. (1991) an influence of ex-tratropical wave driving is found only on the winterward side of the tropics during periods of transient fluctuations (e.g. the occurrence of major midwinter warmings (MW)). Dur-ing the period 1998/1999 and 2003/2004 seven MW were observed during these six winters in the NH, which is un-precedented in the record (Manney et al., 2005a). In the Southern Hemisphere the first recorded MW took place in September 2002 (e.g. Kr¨uger et al., 2005) accompanied by a general increase of wave driving since 2000 (Dhomse et al., 2006). Corresponding to this, we find an enhanced diabatic ascend of 0.6 K/day in the Southern Hemisphere tropics dur-ing 2000–2004 in contrast to only 0.5 K/day in earlier time periods.
3.3 Interannual variability
In this section natural forcing components are investigated in more detail, which are known to have an influence on the tropical tropopause region. The time series is sorted into cat-egories according to volcanic eruptions, ENSO, QBO and the solar cycle (e.g. Labitzke et al., 2006, and related work), using the ERA40 data. For the QBO influence on the TTL we are taking the phase of the QBO between 40 and 50 hPa into account to address direct (by thermal wind balance) and indirect effects (different planetary wave propagation). Fur-thermore the QBO is not clearly defined anymore between 70 and 100 hPa and a shear zone is hard to distinguish. Tak-ing the 70 hPa pressure level as QBO index hardly changes our results. Baldwin et al. (2001) give a recent overview of the QBO effects and its secondary circulation in the trop-ics. The influence of volcanoes, ENSO and QBO on the TTL was already investigated by several authors (e.g. Ran-del et al., 2000; Zhou et al., 2001; Gettelmann et al., 2001; Bonazzola and Haynes, 2004; Zhou et al., 2004; Fueglistaler and Haynes, 2005) taking an Eulerian framework or concen-trating on shorter time periods using vertical wind fields. Fig-ure 4 illustrates composite maps (left side) and anomalies of LCP temperatures and density (right side) for different pro-cesses. The coldest and driest TTL in average is reached during the QBO easterly phase (QBOE) and La Ni˜na years north of the maritime continent with LCP temperatures be-low 184 K (∼2 ppmv). The QBOE composites display a zon-ally uniform cold anomaly along the tropical belt from 20◦S to 20◦N of −1 to −2 K (−0.5 ppmv, ∼ 25% drier) compared to the long-term mean. This is in contrast to La Ni˜na com-posites, which display a longitudinal shift of colder air over the Indian Ocean and western Pacific region and warmer air over the central/eastern Pacific. The maximum density of
LCPs lies over the central Pacific for QBOE and is shifted westward towards the maritime continent for La Ni˜na years, as would be expected from the location of the main convec-tion zones observed during La Ni˜na. The highest LCP tem-peratures (186 K) are reached during volcanic eruptions and El Ni˜nos having an opposite pattern compared to La Ni˜na composites. A positive warm pool (exceeding 4 K) is found over the eastern Pacific for La Ni˜na, which is not visible in such a strength in Eulerian based studies (Gettelmann et al., 2001; Zhou et al., 2001) and might be due to the small sam-ple of trajectories in this region (15 to 60 trajectories per grid box). In contrast to La Ni˜na, the LCP density for El Ni˜no is maximizing over the central/eastern Pacific in good corre-spondence with the shift of the convection center during El Ni˜no. The QBO westerly (QBOW) phase displays a zonally symmetric warmer LCP up to 1 K.
The physical mechanisms of the solar cycle influence on the atmosphere are discussed in the study by Kodera and Kuroda (2002) and related work. Direct effects include a dif-ferent solar insolation (in the UV) and ozone production in the tropical stratosphere between the two solar cycles, which impacts the temperature structure in the tropical stratosphere and hence the TTL. Indirect effects include a different plan-etary wave propagation and hence strength of the Brewer Dobson Circulation (BDC) which is thought to impact also the tropical tropospheric circulation (e.g. the Hadley cell and the Walker circulation). Indeed, taking solar maximum and minimum (SMAX and SMIN) into account, a zonally asym-metric structure appears with colder LCP over the Indian Ocean and western Pacific (−1 K) and a warmer LCP over the central/eastern Pacific (2 to 3 K) for SMAX. The oppo-site signal exists for SMIN with smaller temperature differ-ence asymmetries than for SMAX. Areas of lower LCP tem-peratures correspond to an increased number of trajectory crossing the cold point, shifted towards the western/eastern Pacific for SMAX/SMIN years. The reason for this asym-metric response of the solar cycle on the TTL seems to be related with a westward shift of the Walker circulation dur-ing SMAX (van Loon et al., 2007). Zonally averagdur-ing the composites leads to a systematically higher LCP temperature of 0.2 K during SMAX compared to SMIN (not shown here), which is in good agreement with the study by Labitzke et al. (2006).
4 Discussion
The results might be affected by the data inhomogeneities of the ERA40 time series (e.g. Uppala et al., 2005) and be-tween ERA40 and opECMWF analyses. Comparing maps of the pre and after satellite era with each other reveal a system-atically warmer/colder TTL for the 1962–1978/1979–2001 time period (not shown), which might be affected by the assimilation of satellite measurements since 1979. The ob-served cooling and changes of water vapour in the tropical
Fig. 4. Left side: DJF composite maps of LCP temperature [K] and density, using the ERA40 time series. Included are: volcanic eruptions,
La Ni˜na, El Ni˜no, QBOE, QBOW, SMAX and SMIN; number of years are indicated in the title. Right side: DJF anomalies of composite maps from the 1962–2001 period (Fig. 3) of LCP temperature [K] and density. Intervals for the density differences are 0.5, 2.5 and 5×1000−1 per 5◦×5◦grid.
tropopause region has been investigated and discussed by many authors (e.g. Fueglistaler and Haynes, 2005; Randel et al., 2006). A corresponding drop of water vapor is not re-ported before 2000/2001, which Randel et al. (2006) links to an increase of the BDC. One difficulty to detect reliable changes or trends in the TTL lies in the measurement uncer-tainties. We would like to discuss three issues here:
1. The cooling of the tropical tropopause exists in dif-ferent available meteorological data sets since the mid 1990s as was investigated by Dhomse et al. (2006), who also found a cold bias in opECMWF compared to ERA40 data of −1 K at the 100 hPa level during 2001/2002. Comparing cold point temperatures be-tween radiosonde measurements, opECMWF (L60) and ERA40 (L60) analyses for five tropical stations revealed a good agreement between opECMWF and radioson-des, whereas ERA40 analysis has a warm bias around 2 K (Brunn, 2007). These results are in contrast to pre-vious studies (e.g. Gobiet et al., 2005; Dhomse et al., 2006), which concentrated on temperature differences at standard pressure levels. Assuming that opECMWF data do not have or at most a slight cold bias of −1 K in LCP, a cooling (we analyse a peak of −4 K, Fig. 3) would still exist.
2. The vertical structure of the offline calculated radiative heating rates, used as vertical velocity, are mainly in-fluenced by the 4D-input data, where temperature be-sides ozone, water vapour and cloud fields are hav-ing an impact. For instance, the case study for NH winter 2001/2002 displays a shift towards higher ˆQLCP
for opECMWF data compared to ERA40, which is in agreement with the cold bias between them. Taking the above described temperature discrepancies of ECMWF into account the enhanced locally upwelling during the 1990s (ERA40) and early 2000s (opECMWF) would still exist. However, an enhanced upwelling during the 1990s is not visible in our zonally averaged ˆQLCPnor in
observed zonally averaged water vapour fields, which might indicate the role played the spatial structure in the TTL. ˆQcalculated from an independent study using measurements from two tropical ARM stations in the western Pacific shows a radiative heating of 0.5 K/day at 17 km altitude (McFarlane et al., 2007), which cor-responds with our tropical average ˆQLCP of 0.5 K/day
for the period 1992–2001.
3. The predicted LCP difference should arise from the temperature and diabatic ascend differences itself, as the air mass sampling between opECMWF and ERA40 data is very similar over the western Pacific (Sect. 3).
Comparing our Lagrangian diabatic ascend rates with studies using the conventional method we find large differ-ences. Using vertical winds of ERA40 (Fueglistaler et al.,
2004) and opECMWF analyses (Levine et al., 2007, and this study) for the NH winter 2000/2001, a residence time of 20 days for the 360–380 K layer is derived. Whereas us-ing our new approach with diabatic heatus-ing rates we find an average of 38 days (ERA40) and 48 days (opECMWF) for the 360–380 K layer during 2000/2001 (not shown), respec-tively, and of 40 and 36 days for ERA40 and opECMWF dur-ing 2001/2002. The differences between the two ECMWF analyses indicate the above mentioned data inhomogeneities. Our results lie in the middle of the uncertainty range of 20 and 80 days for the 360–380 K layer published by WMO (2007), which are only given for single years. To study the interannual variability of the residence time is important for long-term transport studies of VSLS and to limit the range of uncertainty within the TTL, which will be investigated in more detail in a future study.
5 Conclusions
Multi-year calculations of radiative heating rates and isen-tropic trajectories have been carried out to investigate air mass transport through the upper part of the TTL with an alternative approach. Investigating the influence of differ-ent vertical velocities for one NH winter 2001/2002 demon-strates the great advantage of using diabatic heating rates to overcome known problems with vertical winds of meteoro-logical assimilation systems. In correspondence to the NH winter 2001/2002, a mean residence time of ∼40 days for the 360–380 K layer is also found for the NH winter 2000/2001. This time is twice as long as derived from trajectory cal-culations using vertical winds from ECMWF assimilations (Fueglistaler et al., 2004; Levine et al., 2007, and this study). A companion study by Immler et al. (2007a) demonstrated that cirrus occurrence, which is simulated using our trajec-tories with diabatic heating rates, are well correlated with lidar observations of tropical cirrus. In contrast, these au-thors found no such correlation when using trajectories based on vertical winds. Applying more realistic vertical velocities does have a large impact on transport studies in the TTL, in particular on transport of VSLS released from the surface.
Long-term calculations of transport processes in the TTL during NH winter reveal that the QBO and ENSO events have an impact on the pattern and magnitude of Lagrangian cold point temperatures and density of trajectories. The coldest and driest TTL is reached during QBOE and La Ni˜na north of the maritime continent, whereas during El Ni˜no and QBOW a warmer and less dry TTL is detected. This in accordance with Fueglistaler and Haynes (2005), who used a shorter time period for their investigation. The following new results are obtained by our study:
1. The coldest and driest LCP is predicted north of the maritime continent during the 1990s and early 2000s together with an increase of zonally averaged diabatic ascent during the 2000s. This increase of upwelling
is consistent with an enhanced stratospheric wave driv-ing observed since the early 2000s (Randel et al., 2006; Dhomse et al., 2006).
2. We examine the influence of several natural processes affecting the interannual variability in the TTL for a long-term period of 40 years including the effect of three major volcanic eruptions, which all three hap-pened during El Ni˜no events. Therefore the volcanic anomalies reveal an El Ni˜no like signal with a surround-ing warmer TTL due to the volcanic released aerosols in the tropical stratosphere. This combined signal leads to the warmest LCP anomaly of all natural forcing compo-nents taking into account.
3. Unique for TTL transport studies, the solar cycle ef-fect is analysed with an Lagrangian approach. During SMAX years we found a colder TTL (up to −1 K; and a higher density of trajectories) over the Indian Ocean/western Pacific and during SMIN years a colder TTL (−1 K) over the eastern Pacific/Atlantic.
ENSO, volcano+El Ni˜no and solar cycle composites exhibit a longitudinal asymmetry, whereas the QBO presents a zon-ally symmetric structure in the TTL. In contrast to Zhou et al. (2001) larger differences in LCP fields are found for ENSO and QBO phases, taking a longer time period with a Lagrangian approach into account. The overlapping influ-ence of volcanoes, ENSO, QBO and solar cycle phases on transport processes in the TTL should be considered as well, which is beyond the scope of this paper and will be investi-gated in a future study.
Finally, the geographical distribution of the LCP is very robust and does not seem to be much affected by using our method compared to the vertical wind method (this study, Bonazzola and Haynes, 2004; Fueglistaler et al., 2005). However, differences in the density of trajectories, distribu-tion of ˆQLCPand in residence time are large. These are
im-portant for troposphere-stratosphere transport processes and particularly for the chemistry of VSLS in the TTL, which need to be further investigated.
Acknowledgements. We would like to thank J.-J. Morcrette
for providing the ECMWF radiation code. The meteorological analyses and very helpful data support were supplied by ECMWF. The authors thank I. Wohltmann, five anonymous reviewers and the editor for their useful comments, which helped to improve this manuscript. This study was supported by the European Union’s 6th framework program within the SCOUT-O3 (GOCE-CT-2004-505390) project.
Edited by: H. Wernli
References
Andrews, D. G., Holton, J. R., and Leovy, C. B.: Middle atmo-sphere dynamics, Academic Press, 1987.
Baldwin, M., Gray, L., Dunkerton, T., Hamilton, K., Haynes, P., Randel, W., Holton, J., Alexander, M., Hirota, Horinouchi, T., Jones, D., Kinnersley, Marquardt, C., Sato, K., and Takahashi, M.: The Quasi-Biennial Oscilltion, Rev. Geophysics, 39(2), 179-229, doi:8755-1209/01/1999RG000073, 2001.
Bonazzola, M. and Haynes, P.: A trajectory-based study of the tropical tropopause region, J. Geophys. Res., 109, D20112, doi: 10.1029/2003JD004356, 2004.
Brunn, W.: Die Minimumtemperatur in der tropischen Tropopausenschicht in Nordhemisph¨arischen Wintern von 1957 bis 2006, Diplom thesis at the University of Kiel, 123 pp., http://www.ifm-geomar.de/index.php?id=3836, 2007.
Chipperfield, M.: New version of the TOMCAT/SLIMCAT off-line chemical transport model: Intercomparison of stratospheric tracer experiments, Q. J. Roy. Meteorol. Soc., 132, 2006, doi: 10.1256/qj.05.51, 2006.
Dhomse, S., Weber, M., and Burrows, J.: The relationship between tropospheric wave forcing and tropical lower stratospheric water vapor, Atmos. Chem. Phys., 8, 471–480, 2008,
http://www.atmos-chem-phys.net/8/471/2008/.
Fortuin, J. P. F. and Langematz, U.: An update on the global ozone climatology and on concurrent ozone and temperature trends, Proc. SPIE, Atmos. Sensing and Modeling, 2311, 207– 216, 1995.
Fu, Q. and Liou, K.: On the correlated k distribution method for ra-diative transfer in nonhomogeneous atmospheres, J. Atmos. Sci., 49, 2139–2156, 1992.
Fueglistaler, S., Wernli, H., and Peter, T.: Stratospheric water vapor predicted from the Lagrangian temperature history of air entering the stratosphere in the tropics, J. Geophys. Res., 110, D03108, doi:10.1029/2003JD004069, 2004.
Fueglistaler, S. and Haynes, P.: Control of interannual and longer-term variability of stratospheric water vapor, J. Geophys. Res., 110, D24108, doi:10.1029/2005JD006019, 2005.
Fueglistaler, S., Bonazzola, M., Haynes, P. H., and Peter, T.: Strato-spheric water vapor predicted from the Lagrangian temperature history of air entering the stratosphere in the tropics, J. Geophys. Res., 110, D08107, doi:10.1029/2004JD005516, 2005.
Gettelman, A., Randel, W., Massie, S., Wu, F., Read, W., and Rus-sell III, J.: El Ni˜no as a natural experiment for studying the trop-ical tropopause region, J. Climate, 14, 3375–3391, 2001. Gettelman, A., de Forster, P., Fujiwara, M., Fu, Q., V¨omel, H.,
Go-har, L., Johanson, C., and Ammerman, M.: Radiation balance of the tropical tropopause layer, J. Geophys. Res., 109, D07103, doi:10.1029/2003JD004190, 2004.
Gobiet, A., Foelsche, U., Steiner, A., Borsche, M., Kirchengast, G., and Wickert, J.: Climatological validation of stratospheric temperatures in ECMWF operational analyses with CHAMP radio occultation data, Geophys. Res. Lett., 32, L12806. doi: 10.1029/2005GL022617, 2005.
Hashiguchi, N., Yamanaka, M., Ogino, S., Shiotani, M., and Sribi-mawati, T.: Seasonal and interannual variations of temperature in the tropical tropopause layer (TTL) over Indonesia based on op-erational rawinsonde data during 1992-1999, J. Geophys. Res., 111, D15110, doi:10.1029/2005JD006501, 2006.
Haynes, P., Marks, C., McIntyre, M., Shepherd, T., and Shine, K.: On the “Downward Control” of extratropical diabatic circula-tions by eddy-induced zonal mean forces, J. Atmos. Sci., 49, 651–679, 1991.
Immler, F., Kr¨uger, K., Tegtmeier, S., Fujiwara, M., Fortuin, P., Verver, G., and Schrems, O.: Cirrus clouds, humidity, and dehy-dration in the tropical tropopause layer observed at Paramaribo, Suriname (5.8◦N, 55.2◦W), J. Geophys. Res., 112, D03209, doi: 10.1029/2006JD007440, 2007a.
Immler, F., Treffeisen, R., Engelbart, D., Kr¨uger, K., and Schrems, O.: Cirrus, contrails, and ice supersaturated regions in high pres-sure systems at northern mid latitudes, Atmos. Chem. Phys. Dis-cuss., 7, 13 175–13 201, 2007b.
Kodera, K. and Kuroda, Y.: Dynamical response to the solar cycle, J. Geophys. Res., 107, 4749, doi:10.1029/2002JD002224, 2002. Konopka, P., G¨unther, G., M¨uller, R., dos Santos, F. H. S., Schiller, C., Ravegnani, F., Ulanovsky, A., Schlager, H., Volk, C. M., Vi-ciani, S., Pan, L. L., McKenna, D.-S., and Riese, M.: Contribu-tion of mixing to upward transport across the tropical tropopause layer (TTL), Atmos. Chem. Phys., 7, 3285–3308, 2007, http://www.atmos-chem-phys.net/7/3285/2007/.
Kr¨uger, K., Naujokat, B., and Labitzke, K.: The unusual midwinter warming in the southern hemisphere stratosphere 2002: a com-parison to northern hemisphere phenomena, J. Atmos. Soc., 62, 603–613, 2005.
Labitzke, K., Kunze, M., and Br¨onnimann, S.: Sunspots, the QBO, and the Stratosphere in the North Polar Region – 20 Years later, Met. Zeit., 15(3), 355–363, 2006.
Levine, J., Braesicke, P., Harris, N., Savage, N., and Pyle, J.: Pathways and timescales for troposphere-to-stratosphere trans-port via the tropical tropopause layer and their relevance for very short lived substances, J. Geophys. Res., 112, D04308, doi: 10.1029/2005JD006940, 2007.
Manney, G., Kr¨uger, K., Sabutis, J., Sena, S., and Pawson, S.: The remarkable 2003-2004 winter and other recent warm winters in the Arctic stratosphere since the late 1990s, J. Geophys. Res., 110, D04107, doi:10.1029/2004JD005367, 2005a.
Manney, G., Allen, D., Kr¨uger, K., Sabutis, J., Pawson, S., Swin-bank, R., Randall, C., Simmons, A., and Long, C.: Diagnostic comparison of meteorological analyses during the 2002 Antarc-tic winter, Mon. Weather Rev., 133, 1261–1278, 2005b. McFarlane, S., Mather, J., and Ackerman, T.: Analysis of
trop-ical radiative heating profiles: A comparison of models and observations, J. Geophys. Res., 112, D14218, doi:10.1029/ 2006JD008290, 2007.
McKenna D. S., Konopka, P., Grooß, J.-U., G¨unther, G., M¨uller, R., Spang, R., Offerman, D., and Orsolini, Y.: A new Chemi-cal Lagrangian Model of the Stratosphere (ClaMS), 1, Formula-tion of advecFormula-tion and mixing, J. Geophys. Res., 107(D16), 4332, doi:10.1029/2000JD000114, 2002.
Meijer, E. W., Bregman, B., Segers, A., and van Velthoven, P. F. J.: The influence of data assimilation on the age of air calcu-lated with a global chemistry-transport model using ECMWF wind fields, Geophys. Res. Lett., 31(23), L23114, doi:10.1029/ 2004GL021158, 2004.
Monge-Sanz, B., Chipperfield, M., Simmons, A., and Uppala, S.: Mean age of air and transport in a CTM: comparison of dif-ferent ECMWF analyses, Geophys. Res. Lett., 34, L04801, doi: 10.1029/2006GL028515, 2007.
Morcrette, J.-J., Clough, S., Mlawer, E., and Iacono, M.: Impact of a validated radiative transfer scheme, RRTM, on the ECMWF model climate and 10-day forecasts, ECMWF Technical Memo No. 252, 47 pp., 1998.
Oikonomou, E. and O’Neill, A.: Evaluation of ozone and wa-ter vapor fields from the ECMWF reanalysis ERA40 during 1991–1999 in comparison with UARS satellite and MOZAIC air-craft observations, J. Geophys. Res., 111, D14109, doi:10.1029/ 2004JD005341, 2006.
Pawson, S. and Naujokat, B.: The cold winters of the middle 1990s in the northern lower stratosphere, J. Geophys. Res., 104, 14 209-14 222, 1999.
Randel, W., Wu, F., and Gaffen, D.: Interannual variability of the tropical tropopause derived from radiosonde data and NCEP re-analysis, J. Geophys. Res., 105, 15 509–15 524, 2000.
Randel, W., Wu, F., Nedoluha, G., V¨omel, H., and Forster, P.: De-creases in stratospheric water vapor since 2001: Links to changes in the tropical tropopause and the Brewer-Dobson circulation, J. Geophys. Res., 111, D12312, doi:10.1029/2005JD006744, 2006. Scheele, M., Siegmund, P., and van Velthoven, P.: Stratospheric age of air computed with trajectories based on various 3D-Var and 4D-Var data sets, Atmos. Chem. Phys., 5, 1–7, 2005,
http://www.atmos-chem-phys.net/5/1/2005/.
Schoeberl, M., Douglass, A., Zhu, Z., and Pawson, S.: A compari-son of the lower stratospheric age spectra derived from a general circulation model and two data assimilation systems, J. Geophys. Res., 108, 4113, doi:10.1029/2002JD002652, 2003.
Simmons, A., Hortal, M., Kelly, G., McNally, A., Untch, A., and Uppala, S.: ECMWF Analyses and Forecasts of Strato-spheric Winter Polar Vortex Breakup: September 2002 in the Southern Hemisphere and Related Events, J. Atmos. Sci., 62(3), 668–689, 2005.
Sonntag, D.: Advances in the field of hygrometry, Meteorol. Z., 3, 51–66, 1994.
Tegtmeier, S.: Variationen der stratosph¨arischen Residualzirkula-tion und ihr Einfluss auf die Ozonverteilung, 179 pp., Ph.D. the-sis, Math.-Naturwiss. Fak., Univ. Potsdam, Potsdam, Germany, http://opus.kobv.de/ubp/volltexte/2007/1211/, 2007.
Uppala, S. M., K˚allberg, P. W., Simmons, A. J., Andrae, U., Da Costa, V., Bechtold, Fiorino, M., Gibson, J. K., Haseler, J., Her-nandez, A., Kelly, G. A., Li, X., Onogi, K., Saarinen, S., Sokka, N., Allan, R. P., Andersson, E., Arpe, K., Balmaseda, M. A., Beljaars, A. C. M., Van De Berg, L., Bidlot, J., Bormann, N., Caires, S., Chevallier, F., Dethof, A., Dragosavac, M., Fisher, M., Fuentes, M., Hagemann, S., H´olm, E., Hoskins, B. J., Isak-sen, L., JansIsak-sen, P. A. E. M., Jenne, R., Mcnally, A. P., Mahfouf, J.-F., Morcrette, J.-J., Rayner, N. A., Saunders, R. W., Simon, P., Sterl, A., Trenberth, K. E., Untch, A., Vasiljevic, D., Viterbo, P., and Woollen, J.: The ERA-40 re-analysis, Q. J. Roy. Meteor. Soc., 131, 2961-3012, doi:10.1256/qj.04.176 2005.
van Loon, H., Meehl, G., and Shea, D.: Coupled air-sea response to solar forcing in the Pacific region during northern winter, J. Geophys. Res., 112, D02108, doi:10.1029/2006JD007378, 2007. Wohltmann, I. and Rex, M.: Improvement of vertical and resid-ual velocities in pressure or hybrid sigma-pressure coordinates in analysis data in the stratosphere, Atmos. Chem. Phys., 8, 265– 272, 2008,
http://www.atmos-chem-phys.net/8/265/2008/.
Ozone Depletion: 2006, WMO Global Ozone Research and Monitoring Project, Report No. 50, 2007.
Zhou, X., Geller, M., and Zhang, M.: Tropical cold point tropopause characteristics from ECMWF reanalyses and sound-ings, J. Climate, 14, 1823–1838, 2001.
Zhou, X., Geller, M., and Zhang, M.: Temperature fields in the tropical tropopause transition layer, J. Climate, 17, 2901–2908, 2004.
![Fig. 3. DJF long-term climatology; Left: LCP temperature [K] (color) and the density of LCPs (white contours); Right: Zonal mean Q ˆ LCP [K/day]](https://thumb-eu.123doks.com/thumbv2/123doknet/14708405.566892/6.892.153.739.92.573/climatology-left-temperature-color-density-contours-right-zonal.webp)
![Fig. 4. Left side: DJF composite maps of LCP temperature [K] and density, using the ERA40 time series](https://thumb-eu.123doks.com/thumbv2/123doknet/14708405.566892/8.892.92.798.96.994/fig-left-djf-composite-temperature-density-using-series.webp)
