HAL Id: hal-01182223
https://hal-brgm.archives-ouvertes.fr/hal-01182223
Submitted on 30 Jul 2015HAL is a multi-disciplinary open access archive for the deposit and dissemination of sci-entific research documents, whether they are pub-lished or not. The documents may come from teaching and research institutions in France or abroad, or from public or private research centers.
L’archive ouverte pluridisciplinaire HAL, est destinée au dépôt et à la diffusion de documents scientifiques de niveau recherche, publiés ou non, émanant des établissements d’enseignement et de recherche français ou étrangers, des laboratoires publics ou privés.
Regolith lithology mapping in sedimentary environment
using airborne gamma-ray, morphology and borehole
data
Frederic Lacquement, Bruno Tourliere, Guillaume Martelet, François
Prognon, Pierre-Alexandre Reninger
To cite this version:
Frederic Lacquement, Bruno Tourliere, Guillaume Martelet, François Prognon, Pierre-Alexandre Reninger. Regolith lithology mapping in sedimentary environment using airborne gamma-ray, mor-phology and borehole data. First Conference on Proximal Sensing Supporting Precision Agriculture, EAGE, Sep 2015, Milan, France. �hal-01182223�
Regolith lithology mapping in sedimentary environment
using airborne gamma-ray, morphology and borehole
data
Frederic Lacquement, Bruno Tourliere, Guillaume Martelet, Fran¸cois
Prognon, Pierre-Alexandre Reninger
To cite this version:
Frederic Lacquement, Bruno Tourliere, Guillaume Martelet, Fran¸cois Prognon, Pierre-Alexandre Reninger. Regolith lithology mapping in sedimentary environment using airborne gamma-ray, morphology and borehole data. First Conference on Proximal Sensing Supporting Precision Agriculture, Sep 2015, Milan, France. <hal-01182223>
HAL Id: hal-01182223
https://hal-brgm.archives-ouvertes.fr/hal-01182223
Submitted on 30 Jul 2015
HAL is a multi-disciplinary open access archive for the deposit and dissemination of sci-entific research documents, whether they are pub-lished or not. The documents may come from teaching and research institutions in France or abroad, or from public or private research centers.
L’archive ouverte pluridisciplinaire HAL, est destin´ee au d´epˆot et `a la diffusion de documents scientifiques de niveau recherche, publi´es ou non, ´emanant des ´etablissements d’enseignement et de recherche fran¸cais ou ´etrangers, des laboratoires publics ou priv´es.
Near Surface Geoscience Turin, Italy, 6-10 September 2015
Regolith lithology mapping in sedimentary environment using airborne gamma-ray, morphology and borehole data
Lacquement F., Tourlière B., Martelet G., Prognon F., Reninger P.A.
Abstract
Knowledge of the regolith, i.e. surface geology, is increasingly demanded to serve societal needs. As a response to this demand, the reference information published worldwide in soil and regolith maps is the lithology. However, acquisition of this information in the field (and at the laboratory) is expensive and time consuming. Natural gamma-ray signals are influenced by lithological as well as physico-chemical properties of the first meter of the ground. In order to accelerate the mapping process, we investigate a predictive lithology mapping method at a regional to semi-local scale. In a siliciclastic-carbonated sedimentary environment, we combine airborne gamma-ray data with morphological information, as well as shallow lithology in boreholes. The proposed method allows 1/ “calibrating” airborne gamma-ray data in terms of dominant lithology, 2/ deriving geologically realistic cartographic polygons based on morphology and gamma-ray maps. The dominant lithology is attributed to each cartographic polygon resulting in a realistic predictive lithological map. A quick validation of this map is presented in comparison with an independent soil map and several other tests of the method in other parts of the Paris Basin, tend to accredit the robustness of the method.
Near Surface Geoscience Turin, Italy, 6-10 September 2015
Introduction
Natural gamma-ray signals are influenced by lithological as well as physico-chemical properties of the first meter of the ground. Increasingly this information is processed to derive topsoil parameter cartography (of “simple” parameters such as texture, moisture, clay content, etc. – e.g. Dierke and Werban, 2012).
In the meantime, lithological information remains the reference information published worldwide in soil and regolith maps. Lithology is a complex concept, based on mineral/chemical assemblages with microscopic crystallographic as well as macroscopic petrological properties. These assemblages are usually described in the field based on mineralogical and textural macroscopic criteria and need expensive and time-consuming laboratory analyses for detailed characterisation.
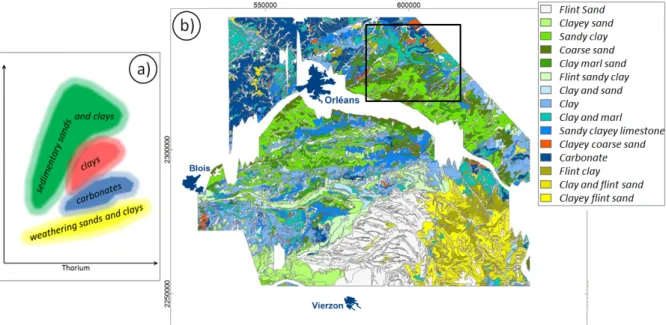
Using gamma-ray spectrometry, several authors attempted to relate uranium (U), potassium (K), thorium (Th) and total gamma-ray count (Tc) to rock geochemistry (Dickson and Scott, 1997) and/or lithology (Galbraith and Saunders, 1983). In the sedimentary environment of Paris Basin, Martelet et al., (2013) showed that most radiometric signal derives from clays; to a certain extent, this meets the mineralogical subdivision in the K-Th space (Figure 1a) derived empirically by Schlumberger, (1985)
using gamma-ray logging in sedimentary environments.
Present work aims at calibrating this diagram in terms of lithologies, in Paris Basin siliciclastic-carbonated environment. This was achieved combining regional airborne gamma-ray data with morphological information, as well as shallow lithology in boreholes.
Data
Along with the gamma-ray data, we used morphological indicators and lithological information. We used a 50-m digital terrain map supplied by IGN (Institut Géographique National) to derive morphological indicators such as the slope, plateau and valley areas, HNR (Height to the Nearest River). In order to “calibrate” the gamma-ray data with lithology, we extracted the information available in about 3000 boreholes from the BSS (French national borehole database): we used the shallowest lithological description available below the topsoil layer.
The gamma-ray data used in this study derive from an airborne high-resolution magnetic and radiometric survey conducted over Région Centre (Figure 1b) by Terraquest Ltd. under the supervision of the French geological survey (BRGM). Because weak gamma-ray emissions were expected in the context of the sedimentary basin, low ground clearance (80 m) and a large crystal volume (58.8 l, composed of 12 downward-looking crystals of 4.2 l each and two upward-looking crystals for Rn background removal), were used to achieve an optimal gamma-ray signal/noise ratio. Also, special attention was paid to reducing statistical noise using the Noise-Adjusted Singular Value Decomposition (Hovgaard and Grasty, 1997). The gamma-spectrometric data were calibrated and processed following recommendations of the International Atomic Energy Agency, (1991). The dataset is composed of U, K, Th and Tc concentrations positioned every 70 m along N-S flight lines spaced 1 km apart. The footprint of each measurement at ground level is an ellipse of approximately 100 by 200 m.
Method
Gamma-ray data pre-processing
Tests showed that working on the punctual measured data could avoid spurious effects due to interpolation between flight lines. And in order to limit as much as possible non-geologic effects: 1/ gamma-ray data measured over anthropized areas (roads, villages, etc.) were removed from the dataset, 2/ the impact on K, U, Th of forested / cropped areas was evaluated (Wetterlind et al., 2012). After this pre-processing, in order to synthetize the multivariate U, K, Th, Tc information into a single segmented map with contrasted gamma-ray signatures, we used Agglomerative Hierarchical Clustering (AHC). Figure 1c displays the segmentation of the airborne gamma-ray data into 18
Near Surface Geoscience Turin, Italy, 6-10 September 2015
classes. The choice of 18 classes is a trade-off between a large number of classes (to represent the regolith variability) and a limited number of interpretable classes. It is not the purpose of this study to explore this map in detail, but it can be noted however that the map has a cartographic consistency and we made sure that it was geologically sound.
Figure 1 Airborne gamma-ray information: a) K vs. Th plot (after Schlumberger, 1985) displaying the radiometric concentrations recorded in the study area, (with same 18 color-codes as map): most gamma-ray data fall into the Kaolinite/Mixed Clay/Montmorillonite/Illite/Mica compartments. b) Location of Région Centre airborne survey extent and c) zoom on the Sologne study area: gamma-ray data are color-coded according to the AHC 18 class clustering. The flight path is superimposed as grey lines and the available boreholes are plotted as black dots; areas in white where not flown.
Morpho-gammametric contouring of regolith units
The contouring of zones where the geologist expects homogeneous lithology remains one of the most challenging steps in computer-assisted cartography. In this work, empirical evaluation showed that a combination of gamma-ray and morphology could be an efficient support for such contouring. However, at that stage we were not able to automate this process satisfactorily. Contouring of regolith units into a layer of polygons was therefore done manually in a GIS, with the help of a combination of gamma-ray maps and the morphological indicators previously mentioned (Figure 2b).
Relating gamma-ray to lithology
In the study area, based on the shallow lithological information extracted from about 3000 boreholes, 30 lithology types were listed. Both majoritarian lithology (in boreholes) and majoritarian AHC class (at gamma-ray measurements) were attributed to each regolith cartographic polygon. Cross-statistics between lithology and gamma-ray signatures (through the AHC class) were then derived. Generally, AHC classes corresponded to 2 or 3 dominant lithologies or reversely lithologies corresponded to 2 or 3 AHC classes. Also, certain AHC classes could be heterogeneous in lithology or certain lithologies could correspond to several AHC classes. Combining both entries of this matrix, it could be evidenced that every AHC class (characterized by its U, K, Th, Tc ranges) could be related to one dominant lithology and secondary components. Therefore, the U, K, Th, Tc space could be divided in a series of radiogenic domains, each one being dominated by one lithology. Since regolith facies are a continuum of mineralogical assemblages, it was evidenced in the U, K, Th, Tc space, that 1/ lithological domains had fuzzy overlapping limits and 2/ meaningful petrological trends could be evidenced in the U, K, Th, Tc space (Figure 2a). Following this analysis, dominant lithologies were attributed to the regolith cartographic polygons according to their radiogenic content (Figure 2b).
Near Surface Geoscience Turin, Italy, 6-10 September 2015
Figure 2 a) In the K-Th space, lithological trends inferred from the cross analysis of gamma-ray and
borehole data; b) Predictive lithological map derived on the study area. The black rectangle locates map in Figure 3.
Discussion - Conclusions
In Figure 2b, the lithological map displays consistent trends of hues in yellow/light grey corresponding to clay with flint and their detrital depleted sands, alternation of light blues and greens corresponding to the “Sologne sands and clays”, and, to the north, blue to dark blue carbonates topped with variable amount of loess. These observations and more local ones, as well as field controls show that this map 1/ is consistent with the 1/50.000 geological map of the substratum, 2/ provides a great amount of information on regolith units which are not considered in the substratum maps, 3/ displays geologically realistic patterns since the polygons of the map where drawn by an experienced cartographer.
In order to truth the method, we tested it on other parts of Région Centre; we obtained promising results in comparison with existing geological maps, but truthing statistically this kind of lithological information is complex primarily because the description of lithologies in boreholes/maps is far from systematic and therefore it is difficult to properly compare the predicted information to existing maps. Here we rather chose a visual comparison between our “gamma-ray derived lithologies” (plotted along the flight lines), and a soil map obtained independently by the French soil institute (INRA). Both information are superimposed in Figure 3: the soil map is modified after Richer de Forges
(2008), its colour codes were chosen in accordance with the lithological colour-scale used in Figure 2.
The overall match of the two layers is correct, but this representation enhances the variability of gamma-ray signatures along the flight lines: rapid changes of lithological colour-codes emphasize the very subtle radiometric contrasts between regolith lithologies and their fuzzy limits. We could check in the field however that these short distance variations are generally realistic. Their effect is reduced when a dominant lithology is attributed to each polygon (see Figure 2b).
In conclusion, in a siliciclastic-carbonated sedimentary environment, the proposed method allows “calibrating” airborne gamma-ray data in terms of dominant lithology (derived from boreholes). That stage is a critical step forward towards fast and reliable predictive regolith mapping in these environments. Several tests of that “calibration” in other parts of the Paris Basin, in comparison with existing geological or soil maps have proven the robustness of the method. In addition, when such “gamma-ray lithologies” (derived along the flight lines) are dominantly attributed to morphologically realistic map polygons, meaningful predictive regolith lithology maps can be achieved.
Near Surface Geoscience Turin, Italy, 6-10 September 2015
Figure 3 Superimposition of the predicted lithologies (along the gamma-ray flight lines) on mapped
soils (modified after Richer de Forges, 2008). Colour codes of the soil map were chosen in accordance with the lithological colour-scale used in Figure 2. Matching of hues between the two layers indicates good agreement between both information sources.
Acknowledgements (Optional)
We thank INRA for providing us with the “Base de données géographique des sols du Loiret au 1/250.000 » – License d’utilisation n°2010-250-BRGM.
References
Dickson, B.L., and K.M. Scott. 1997. Interpretation of aerial gamma ray surveys: Adding the geochemical factors. AGSO J. Aust. Geol. Geophys. 17:187–200.
Dierke, C., and U. Werban. 2012. Relationships between gamma ray data and soil properties at an agricultural test site. Geoderma 199:90–98. doi:10.1016/j.geoderma.2012.10.017.
Hovgaard, J., and R.L. Grasty. 1997. Reducing statistical noise in airborne gamma ray data through spectral component analysis. In: A.G. Gubins, editor, Proceedings of Exploration 97: 4th Decennial International Conference on Mineral Exploration, Toronto, Canada. 14–18 Sept. 1997. Prosp. Dev. Assoc., Toronto. p. 753–764.
International Atomic Energy Agency. 1991. Airborne gamma ray spectrometer surveying. Tech. Rep. Ser.. 323. IAEA, Vienna.
Martelet G., Drufin S., Tourliere B., Saby N.P.A., Perrin J., Deparis J., Prognon F., Jolivet C., Ratié C., Arrouays D., 2013. Regional regolith parameters prediction using the proxy of airborne gamma ray spectrometry, Vadoze Zone Journal, vol. 12 (4) - doi:10.2136/vzj2013.01.0003.
Richer de Forges, A. 2008. Référentiel régional pédologique de la région Centre, Notice explicative de la carte des pédopaysages du Loiret à 1/250 000. Inst.Natl. de la Recherche Agron., Paris.
Schlumberger, 1985. Log interpretation charts. Schlumberger well services, New York, USA, 207 pp. Wetterlind J., Tourlière B., Martelet G., Deparis J., Saby N.P.A., Richer de Forges A.C., Arrouays D., 2012. Are there any effects of the agricultural use of chemical fertiliser on elements detected by airborne gamma-spectrometric surveys? Geoderma, vol. 173-174, p. 34-41.