HAL Id: hal-02955479
https://hal.archives-ouvertes.fr/hal-02955479
Submitted on 22 Oct 2020HAL is a multi-disciplinary open access
archive for the deposit and dissemination of sci-entific research documents, whether they are pub-lished or not. The documents may come from teaching and research institutions in France or abroad, or from public or private research centers.
L’archive ouverte pluridisciplinaire HAL, est destinée au dépôt et à la diffusion de documents scientifiques de niveau recherche, publiés ou non, émanant des établissements d’enseignement et de recherche français ou étrangers, des laboratoires publics ou privés.
Ana Carballido Lopez, Olivier Cunrath, Anne Forster, Julien Pérard,
Gwenaëlle Graulier, Rachel Legendre, Hugo Varet, Odile Sismeiro, Quentin
Perraud, Bénédicte Pesset, et al.
To cite this version:
Ana Carballido Lopez, Olivier Cunrath, Anne Forster, Julien Pérard, Gwenaëlle Graulier, et al.. Non-specific interference of cobalt with siderophore-dependent iron uptake pathways. Metallomics, Royal Society of Chemistry, 2019, 11 (11), pp.1937-1951. �10.1039/C9MT00195F�. �hal-02955479�
aUniversité de Strasbourg, UMR7242, ESBS, Bld Sébastien Brant, F-67413 Illkirch, Strasbourg, France. bCNRS, UMR7242, ESBS, Bld Sébastien Brant, F-67413 Illkirch, Strasbourg, France.
cUniv-Grenoble alpes, CNRS, CEA, BIG, CBM, CEA-Grenoble, 38000 Grenoble, France.
dTranscriptome and EpiGenome, Biomics, Institut Pasteur, 28 rue du Docteur Roux, 75015 Paris, France.
eInstitut Pasteur – Bioinformatics and Biostatistics Hub – C3BI, USR 3756 IP CNRS – Paris, France. fFocal Area Infection Biology, Biozentrum, University of Basel, Basel, Switzerland
To whom correspondence should be addressed: Isabelle J. Schalk, UMR 7242, IREBS, ESBS, Blvd Sébastien Brant, CS 10413, F-67412 Illkirch, Strasbourg, France. Tel: 33 3 68 85 47 19; Fax: 33 3 68 85 48 29; E-mail: [email protected] or [email protected]
3 4 5 6 7 8 9 10 11 12 13 14 15 16 17 18 19 20 21 22 23 24 25 26 27 28 29 30 31 32 33 34 35 36 37 38 39 40 41 42 43 44 45 46 47 48 49 50 51 52 53 54 55 56 57 58 59 60
VARET, Hugo, SISMEIRO, Odile, PERRAUD, Quentin, PESSET, Bénédicte, SAINT AUGUSTE, Pamela, BUMANN, Dirk, MISLIN, Gaetan, COPPEE, Jean Yves, MICHAUD-SORET, Isabelle, FECHTER, Pierre et SCHALK, Isabelle
Abstract
Much data shows that biological metals other than Fe3+ can interfere with Fe3+ acquisition by
siderophores in bacteria. Siderophores are small Fe3+ chelators produced by the microorganism to
obtain access to Fe3+. Here, we show that Co2+ is imported into Pseudomonas aeruginosa cells in a complex with the siderophore pyochelin (PCH) by the ferri-PCH outer membrane transporter FptA. Moreover, the presence of Co2+ in the bacterial environment strongly affects the production of PCH. Proteomic and transcriptomic approaches showed that a decrease of PCH production is associated with repression of the expression of the genes involved in PCH biosynthesis. We used various molecular biology approaches to show that this repression is not Fur- (Ferric uptake transcriptional regulator) dependent but due to competition of PCH-Co with PCH-Fe for PchR (transcriptional activator), thus inhibiting the formation of PchR-PCH-Fe and consequently the expression of the PCH genes. We observed a similar mechanism of repression of PCH production, but to a lesser extent, by Ni2+, but not for Zn2+, Cu2+, or Mn2+. Here, we show, for the first time at a molecular level, how the presence of a contaminant metal can interfere with Fe3+ acquisition by the siderophores PCH and PVD.
3 4 5 6 7 8 9 10 11 12 13 14 15 16 17 18 19 20 21 22 23 24 25 26 27 28 29 30 31 32 33 34 35 36 37 38 39 40 41 42 43 44 45 46 47 48 49 50 51 52 53 54 55 56 57 58 59 60
Introduction
In living organisms, interactions between biomolecules and biological metals (Na, Mg, K, Ca, Mn, Fe, Zn, Ni, Cu, Co, and Mo) are vital and play a role in macromolecule structure and cell metabolism. For example, one third of proteins require metals for their effective functioning. The interactions between macromolecules and metals are highly specific. Waldron and Robinson proposed that to ensure that each metalloprotein or metalloenzyme in bacteria binds the correct metal and functions properly, ‘metals are not in competition for a limited pool of proteins, but rather the proteins compete for a limited pool of metals in the cells’.2,3 Therefore, any disequilibrium of this limited intracellular pool of metals (the bacterial metallome) affects bacterial cell viability. However, bacteria are often subject to variations in metal concentrations in their environment, including during infections, in which they may be confronted with “nutriment immunity”, whereby the host uses deprivation of, or poisoning with, metals as defense strategies against microbial invaders.4,5 For example phagocytes use Cu and/or Zn intoxication to reduce the intracellular survival of pathogens.6 How bacteria cope with such metal concentration disequilibria at the molecular level and the cross-talk to maintain homeostasis of different biological metals in bacterial cells are still poorly understood.
Bacterial iron homeostasis has attracted the most attention over the last decades. Iron is a key nutriment for bacterial growth, which is paradoxically poorly bioavailable because of its very low solubility under aerobic conditions and physiological pH. Thus, to gain access to Fe3+, most bacteria
produce siderophores.7 These compounds have various chemical structures, a molecular weight usually between 200 and 2 000 Da, and are characterized by an extremely high affinity for Fe3+, with,
for example, Ka values of 1043 for the siderophores enterobactin.8 Siderophores provide bacteria with
Fe3+ by scavenging this metal from the bacterial environment and transporting it into either the
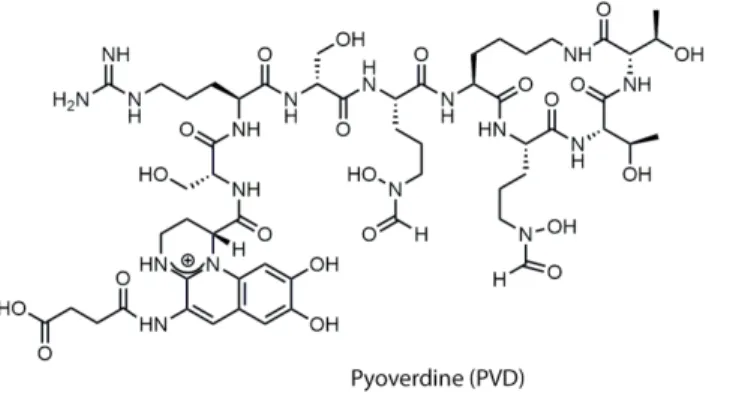
bacterial periplasm or cytoplasm.9,10 This strategy works in any bacterial environment, such as in the rhyzosphere11, but also plays a key role in the host during infections.12 P. aeruginosa, an opportunistic pathogen and used as a model in the present study, produces two major siderophores, pyoverdine 3 4 5 6 7 8 9 10 11 12 13 14 15 16 17 18 19 20 21 22 23 24 25 26 27 28 29 30 31 32 33 34 35 36 37 38 39 40 41 42 43 44 45 46 47 48 49 50 51 52 53 54 55 56 57 58 59 60
(PVD) and pyochelin (PCH) (Figure 1).9 The synthesis of these chelators is correlated with the concentration of iron, both in bacterial cells and the environment.13 In media with moderately low concentrations of iron (approximately 300 nM), P. aeruginosa cells produce more PCH than PVD, whereas in more severely iron-restricted media (approximately 20 nM), PCH production remains highly active and, in addition, PVD production is strongly stimulated.13,14
Fe3+ uptake into bacteria via siderophores always involves a siderophore-specific TonB-dependent
transporter for its uptake across the outer membrane in Gram-negative bacteria.15 Depending on the siderophore, Fe3+ is then either delivered into the bacterial periplasm or cytoplasm. Transport into the
cytoplasm involves further transport of the ferri-siderophore complex across the inner membrane via proton motive force-dependent permeases or ABC transporters.16 Iron release from siderophores in the bacterial periplasm or cytoplasm requires Fe3+ reduction (siderophores having a lower affinity for
Fe3+ compared toFe2+), often associated with chemical modification or hydrolysis of the siderophores.16 Siderophore production is generally negatively regulated by the presence of Fe2+ via the Fur
transcriptional regulator19 and positively by iron restriction and the response of various regulatory systems, such as sigma and anti-sigma factors20, the AraC regulators, or two component systems.21 Under iron starvation, PCH production is activated via the action of the AraC regulator PchR and PVD by anti-sigma (FpvR) and sigma factors (PvdS and FpvI).21–23
An increasing number of studies have also reported that siderophores are able to chelate efficiency metals other than Fe3+.18 Previously, using the spectral properties of PVD and PCH, we have shown that both PVD and PCH are able to chelate the biological metals Co2+, Cu2+, Ni2+ and Zn2+ as well as metals like Ag+, Pb2+, Al3+.24,25 PVD chelates metals with a 1 : 1 stoechiometry and stability constants have been determined for some PVD-metal complexes: PVD-Fe (Ka = 1030.8 M-1), PVD–Ni2+ (Ka = 1010.9 M-1), PVD– Cd2+ (Ka = 108.2 M-1), PVD-Cu2+ (Ka = 1020.1 M-1).26,27 PCH forms predominantly 1 : 2 (M2+ /PCH) complexes and the stability constant determined are: for Fe3+ (Ka = 1028.8 M-2), for Zn2+ (Ka = 1026.0 M -2) and for Cu2+ (Ka = 1025.0 M-2).28 Baysse et al. have shown that PCH can also bind the transition metal 3 4 5 6 7 8 9 10 11 12 13 14 15 16 17 18 19 20 21 22 23 24 25 26 27 28 29 30 31 32 33 34 35 36 37 38 39 40 41 42 43 44 45 46 47 48 49 50 51 52 53 54 55 56 57 58 59 60
vanadium generating a Fenton reaction in the cells.29 Moreover several studies have shown that the presence of metals other than Fe3+ in the bacterial environment can modulate the bacterial production
of siderophores, but nothing is known concerning the molecular mechanisms involved.30–32 For example, PCH synthesis in P. aeruginosa, is repressed by 10 µM Fe2+, Co2+, Mo+6, Ni2+, and Cu2+.33,34 At last, an increasing number of studies have reported that siderophores, in addition to their important role in Fe3+ acquisition, also protect bacterial cells against excess toxic metals present in their
environment and can consequently play a role in bacterial metal resistance.13,17,18 Previous studies by our group have shown that both PVD and PCH protect P. aeruginosa from toxic metals or an excess of essential metals, to a similar extent, by preventing their intracellular accumulation, thus maintaining the homeostasis of the various biological metals present in bacterial cells.13,17
To better understand the possible role of PVD and PCH in the homeostasis of biological metals other than iron, we explored the effect of the presence of various biological metals (Co2+, Cu2+, Ni2+, Mn2+ and Zn2+) in bacterial growth media on PVD and PCH production and investigated the possible molecular mechanisms involved in the phenotype(s) observed. Heavy metals were not included in our study, the possible role of the two siderophores in heavy metal resistance being not the focus of this work. We observed that Co2+ repressed PCH synthesis with the same efficiency as Fe3+, and repression was also observed with Ni2+, but with lower efficiency. There was no repression by Zn2+, Mn2+, or Cu2+. The repression observed is Fur-independent and due to the ability of Co2+ and Ni2+ to interfere with the transcriptional regulator PchR (activator of PCH production, Scheme 1). Co2+ and Ni2+ inhibit PchR-PCH-Fe formation and consequently the concentration of this complex in bacterial cells decreases, resulting in a decrease of the transcription of the genes encoding the enzymes involved in PCH synthesis. 3 4 5 6 7 8 9 10 11 12 13 14 15 16 17 18 19 20 21 22 23 24 25 26 27 28 29 30 31 32 33 34 35 36 37 38 39 40 41 42 43 44 45 46 47 48 49 50 51 52 53 54 55 56 57 58 59 60
Materials and methods
Chemicals. The metals used were in the following forms: CoCl2,6H2O (Strem Chemicals), CuCl2,2H2O (Strem Chemicals), NiCl2,6H2O (Strem Chemicals), FeCl3 (Alfa Aesar), Mn(OAc)2,4H2O (Strem Chemicals) and ZnCl2 (Strem Chemicals). All solutions were prepared at concentrations between 1 nM and 100 µM in 0.5 N HCl or 0.5 N HNO3. These stock solutions were then diluted with 50 mM Tris-HCl pH 8.0. The PCH used in these experiments was synthesized according to a previously published protocol.35
Bacterial strains and growth media. P. aeruginosa strains used throughout this study are shown in Table 1. For cultures of P. aeruginosa strains in iron-limited media, bacteria were first grown in LB broth overnight at 30°C. The bacteria were then washed in CAA medium (casamino acid medium, composition: 5 g.L-1 low-iron CAA (Difco), 1.46 g.L-1 K
2HPO4 3H2O, 0.25 g.L-1 MgSO4 7H2O), diluted two-fold and incubated for 24 h at 30°C.
Siderophore quantification. The production of PCH and PVD were evaluated as described previously.25 -36 PVD production was monitored by its characteristic absorbance of 400 nm at neutral pH.36 PCH has a characteristic absorbance of 320 nm, but unlike PVD, this siderophore cannot be detected directly in the bacterial growth medium and needs first to be extracted from the cultures and concentrated before absorbance monitoring.13,36
UV and fluorescence spectra of metal complexes. PCH was solubilized in methanol and
PCH-metal complexes were prepared in methanol by mixing 1 eq. of PCH-metal with 2 eq. of PCH. 50 mM TrisHCl pH 8.0 buffer was added to reach a concentration of PCH-metal complexes of 50 µM. UV spectra were measured on a Nanodrop 2000 spectrophotometer and fluorescence spectra were measured on a TECAN M200 multiplate reader. All measures were carried out in 50 mM TrisHCl buffer. For emission spectra : λexc = 350 nm; for excitation spectra : λem = 422 nm.
3 4 5 6 7 8 9 10 11 12 13 14 15 16 17 18 19 20 21 22 23 24 25 26 27 28 29 30 31 32 33 34 35 36 37 38 39 40 41 42 43 44 45 46 47 48 49 50 51 52 53 54 55 56 57 58 59 60
Bacterial growth and quantification of fluorescence intensity. Cells were cultured overnight in CAA medium, pelleted by centrifugation, resuspended in fresh CAA medium, and the resulting suspension diluted so as to obtain an optical density at 600 nm of 0.01 units. We dispensed 200 µL of the suspension per well into a 96-well plate (Greiner, U-bottomed microplate) with or without the different metals tested. The plates were incubated at 30°C, with shaking, in a Tecan microplate reader (Infinite M200, Tecan) for measurements of OD600nm and mCherry (excitation/emission wavelengths: 570 nm/610 nm) fluorescence at 30-min intervals, for 40 h. We calculated the mean of three replicates for each measurement.
Proteomics analysis. Bacteria were grown in CAA medium as described above (for growth curve see Figure 1SM in Supplementary Materials). After the first overnight culture in CAA medium, the bacteria were diluted in 10 mL CAA to an OD600 nm of 0.1 and incubated with or without 10 µM Fe3+ or Co2+ for 8 h at 30°C. For the digestion and cleanup steps, the same strategy was used as previously described.37 For the shotgun proteomics assays, 1 µg of peptides of each sample were subjected to LC–MS (liquid chromatography-mass spectrometry) analysis using the same approach as previously described.37
Transcriptomic analysis. Bacteria were grown in CAA medium exactly as described above for the proteomic analyses and harvested after 8 h of cultures at 30°C. The total RNA were extracted by hot phenol treatment. Briefly, an aliquot of 8 x 10⁸ cells from the cultures were added to two volumes of RNAprotect Bacteria Reagent (Qiagen). After centrifugation, the cell pellets were dissolved in 1 ml of lysis buffer (300 mM NaCl ; 1% SDS ; 8 mM EDTA), incubated at 90°C for 1 min before the addition of 1 mL of phenol and a further incubation at 65°C for 10 min. The extracted RNAs (aqueous phase) were purified again with 1 volume of Phenol/Chloroform. To eliminate any DNA traces, the RNAs were submitted twice to DNaseI treatment. The RNAs were then submitted to ribosomal depletion using the RiboZero Bacteria kit (Illumina). The efficiency of depletion was validated on a Bioanalyzer nanochip (Agilent). Directional cDNA libraries for sequencing were constructed using the TruSeq 3 4 5 6 7 8 9 10 11 12 13 14 15 16 17 18 19 20 21 22 23 24 25 26 27 28 29 30 31 32 33 34 35 36 37 38 39 40 41 42 43 44 45 46 47 48 49 50 51 52 53 54 55 56 57 58 59 60
Stranded RNA LT Sample Prep kit (Illumina) from enriched non-rRNA samples, following the manufacturer’s instructions. After validation of the libraries on a Bioanalyzer DNA1000 chip (Agilent) and QuBit (Invitrogen) quantification, sequencing was performed on a HiSeq 2500 (Illumina). Reads were 65 bp-long in single mode.
Count data were analyzed using R version 3.3.138 and the Bioconductor package DESeq2 version 1.12.4.39 Normalization and the estimation of dispersion were performed with DESeq2, using the default parameters, and statistical tests for differential expression were performed, applying the independent filtering algorithm. A generalized linear model was used to test for the differential expression between the three biological conditions: PAO1 without metals, PAO1 in the presence of Co2+ or Fe3+. For each pairwise comparison, raw p-values were adjusted for multiple testing according to the Benjamini and Hochberg (BH) procedure40 and genes with an adjusted p-value lower than 0.05 were considered to be differentially expressed.
Reads were cleaned of adapter sequences and low-quality sequences using an in-house program (https://github.com/baj12/clean_ngs). Only sequences at least 25 nt in length were considered for further analysis. Bowtie version 0.12.741, with default parameters, was used for alignment on the reference genome (Pseudomonas aeruginosa PAO1 from NCBI). Genes were counted using featureCounts version 1.4.6-p342 from Subreads package (parameters: -t gene -s 1).
Metal quantification by ICP-AES. PCH-metal complexes were prepared by incubating PCH solubilized in methanol with FeCl3, CoCl2, NiCl2 or ZnCl2 at a molar ratio of 2:1 for 15 min. Tris-HCl (50 mM) pH 8.0 buffer was added to bring the siderophore-metal complexes to a final concentration of 4 mM. ∆pvdF∆pchA and ∆pvdF∆pchA∆fptX cells were grown overnight in CAA media as described above. Cells were then washed and resuspended in CAA medium at an OD600 nm of 1.5. PCH-Fe or PCH-Co were added to a final concentration of 4 µM and the solutions incubated for 30 min at 30°C with shaking. The samples were then centrifuged and the bacterial pellets washed once with ultrapure water and dried at 50°C for 48 h. Cells were mineralized by incubation in 70% (v/v) HNO3 for 48 h at room 3 4 5 6 7 8 9 10 11 12 13 14 15 16 17 18 19 20 21 22 23 24 25 26 27 28 29 30 31 32 33 34 35 36 37 38 39 40 41 42 43 44 45 46 47 48 49 50 51 52 53 54 55 56 57 58 59 60
temperature. The volume was brought up to 10 mL with ultrapure water and the samples filtered through a membrane with a 0.22 µm syringe filter unit. The samples were then analyzed with an ICP-AES apparatus (Varian 720 ES) at the following wavelengths (nm): Co (228.62), Fe (238.20), Ca (393.37), Cd (214.44), Co (228.62), Cr (267.72), Cu (327.40), Fe 238.20), K 766.49), Mg (279.55), Mn (257,61), Mo (202.03), Na (589.59), Ni (231.60), Pb 220.35), V (292.40), and Zn (213.86).
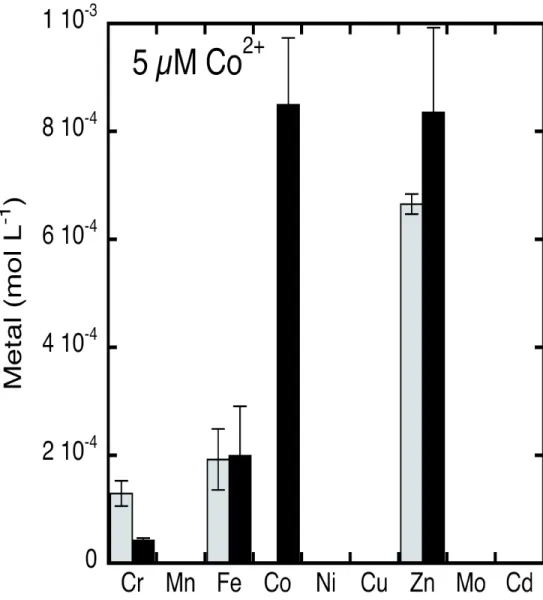
For the data in Figure 4, bacteria were grown in CAA medium in the presence of 5 µM CoCl2. At the end of the exponential phase, samples were centrifuged, and the bacterial pellets treated as described above for the experiment with PCH-Co or PCH-Ni complexes.
55Fe3+ uptake. 55FeCl3 was obtained from Perkin Elmer Life and Analytical Sciences (Billerica, MA, USA), in solution, at a concentration of 71.1 mM, with a specific activity of 10.18 Ci/g. Siderophore-55Fe complexes were prepared at 55Fe concentrations of 20 µM, with a siderophore:55Fe3+ (mol:mol) ratio
of 20:1. 55Fe3+ uptake assays were carried out as previously described,43 except that, after growth, bacteria were incubated with 0.2 µM PCH-55Fe and with or without 0.2 and 2 µM PCH-Co or PCH-Zn complexes.
Electrophoresis mobility shift assays (EMSA). EMSA experiments were performed as previously described44 using a DNA fragment gcgCGCCCGCCAATGATAATAAATCTCATTTCCCAACAgcg containing the -65 to -31 pchD promoter region containing a Fur box (underlined) with gcg on both side added for stabilization. DNA radiolabelling was performed by incubating 20-30 nM DNA for 30 min at 37°C in the presence of 1 unit T4 polynucleotide kinase (NEB) and 0.5 µL gamma ATP at 1 mCi /mmol. Labelled DNA was diluted 10 times in binding buffer (20 mM BisTrisPropane pH 8.5, 100 mM KCl, 3 mM MgCl2, 10 µM CoCl2, 5% v/v glycerol, and 0.01% Triton X-100), desalted on G25 mini-spin columns and stored at -20°C. EMSA were performed with 200-250 pM of freshly prepared radiolabelled DNA incubated 30 min at 25°C with various concentrations of Fur protein in binding buffer in the presence of 10 µM Co2+ or Mn2+. Fur protein was purified as previously described.44 After a 30-min incubation at room 3 4 5 6 7 8 9 10 11 12 13 14 15 16 17 18 19 20 21 22 23 24 25 26 27 28 29 30 31 32 33 34 35 36 37 38 39 40 41 42 43 44 45 46 47 48 49 50 51 52 53 54 55 56 57 58 59 60
temperature, 10 µL of each sample were loaded on an 8 % polyacrylamide (29/1) gel in TA buffer (40 mM Tris acetate pH 8.2) with 10 % glycerol, supplemented with 100 µM of CoCl2. The gel was pre-run 30 min at 100 V in TA buffer supplemented with 100 µM of CoCl2. Mobility shifts were revealed by exposing the gels (2 to 12 h at room remperature) on a storage phosphor screen (GE healthcare) and quantified with a cyclone phosphoimager (Perkin Elmer).
Transcriptional reporters. For the construction of transcriptional reporter plasmid pAYC5 (carrying both PchR and Fur boxes of pchD promoter), the promoters of the gene of interest were amplified from the chromosomal DNA of P. aeruginosa PAO1 by PCR with specific primers (Table SM2 in Supplemental Materials), allowing overlapping with a second PCR fragment encompassing the open reading frame of mCherry. A second PCR was performed using the two first PCR fragment as template to obtain the transcriptional reporter fragment. This fragment was trimmed by digestion with EcoRI and HindIII or BamHI and inserted between the sites for these enzymes in pSEVA631 vector to generate pAYC5 and bacteria were transformed with this vector. The mutation of the Fur box of the pchD promoters to generate pAYC5-FURmut vector has been obtained with the Q5-site directed mutagenesis kit from New England Biolabs, using specific primers (Table 2SM).
Binding assays with MBP-PchR. The E. coli DH5α-pME7180 strain (Table 1), expressing the recombinant protein PchR tagged with MBP at the N-terminal domain,45 was used to express MBP-PchR protein for the binding assays. The protein was purified (Figure SM3) as described previously45 and the protocol from Lin et al.46 was used to investigate the binding between MBP-PchR and the different PCH-metal complexes, metals, and apo-PCH. The PCH-metal complexes were generated by mixing 20 mM PCH with FeCl3, CoCl2, NiCl2, or ZnCl2 in methanol at a molar ratio of 2:1 (PCH:metal) to obtain a final metal concentration of 500 μM. The complexes were incubated for 15 min at RT and finally 50 mM Tris-HCl pH 8 was added to adjust the volume to the desired concentration. The complexes were prepared just before use for the binding experiments.
3 4 5 6 7 8 9 10 11 12 13 14 15 16 17 18 19 20 21 22 23 24 25 26 27 28 29 30 31 32 33 34 35 36 37 38 39 40 41 42 43 44 45 46 47 48 49 50 51 52 53 54 55 56 57 58 59 60
Quantitative real-time PCR. Specific gene expression was measured by RT-qPCR, as previously
described.47 Briefly, overnight cultures of strains grown in CAA medium were pelleted, re-suspended and diluted in fresh medium to obtain an OD600nm of 0.1 units. The cells were then incubated in the presence or absence of 5 µM Fe3+ or Co2+, with vigorous shaking, at 30°C for 8 h. RNAs were purified as described previously.37 We then reverse transcribed 1 μg of total RNA with a High-Capacity RNAto-cDNA Kit, in accordance with the manufacturer’s instructions (Applied Biosystems). The amounts of specific complementary DNAs were assessed in a StepOne Plus instrument (Applied Biosystems) with Power Sybr Green PCR Master Mix (Applied Biosystems) and the appropriate primers (Table SM2). The transcript levels for a given gene in a given strain were normalized with respect to those for uvrD and are expressed as a ratio (fold change) relative to the reference conditions.
3 4 5 6 7 8 9 10 11 12 13 14 15 16 17 18 19 20 21 22 23 24 25 26 27 28 29 30 31 32 33 34 35 36 37 38 39 40 41 42 43 44 45 46 47 48 49 50 51 52 53 54 55 56 57 58 59 60
Results
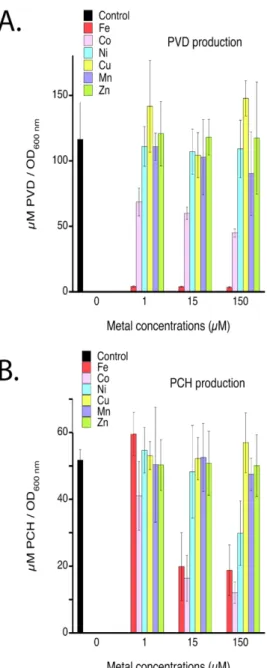
Co2+ can repress PCH and PVD production. We first investigated the impact of the biological metals
(Co2+, Cu2+, Ni2+, Mn2+ and Zn2+) on the production of both siderophores PVD and PCH in iron restricted growth conditions. Bacteria were grown in casamino acids (CAA) medium in the presence of three metal concentrations (Figure 2). CAA contains approximately 20 nM Fe (LB Broth medium contains 4.3 µM)13 and is considered to be highly iron-restricted. As previously described by Cunrath et al.,13 PAO1 cells produced twice as much PVD as PCH under such growth conditions and in the absence of any biological metal: 116.5 ± 30.7 µM/OD600 nm and 51.7 ± 3.1 µM/OD600 nm for PVD and PCH, respectively.
The presence of Fe3+ completely repressed PVD production at 1 µM and PCH production only at 15 µM (Figure 2). Co2+ was the only other metal able to repress the production of both siderophores, with 41.1%, 48.5%, and 61.4% repression of PVD production in the presence of 1.5, 15, and 150 µM Co2+, respectively. Surprisingly, we observed similar dose-dependent repression for both Fe3+ and Co2+ for PCH production. Ni2+ had no effect on PVD production and only affected PCH biosynthesis at 150 µM, repressing production by 42 %. Mn2+ and Zn2+ had no significant effect on either PVD or PCH production at the concentrations tested.
Overall, PVD production was repressed, as expected, by the presence of Fe3+, but also to a lesser extent by Co2+, whereas surprisingly PCH production was repressed with equivalent efficiency by Fe3+ and Co2+ and, to a lesser extent, by the presence of Ni2+.
Genes up- and downregulated in P. aeruginosa cells in the presence of Co2+. We further investigated
the impact of the presence of Co2+ on P. aeruginosa by carrying out proteomic and transcriptomic analyses of bacteria grown in CAA medium with or without 10 µM Fe3+ or Co2+. Changes in gene transcription and expression are given as the log2 ratio between P. aeruginosa grown with or without Co2+ (Table 2). The transcription and expression of several proteins of the PCH pathway was repressed in the presence of Fe3+ and Co2+, showing a similar repressive effect of both metals, consistent with 3 4 5 6 7 8 9 10 11 12 13 14 15 16 17 18 19 20 21 22 23 24 25 26 27 28 29 30 31 32 33 34 35 36 37 38 39 40 41 42 43 44 45 46 47 48 49 50 51 52 53 54 55 56 57 58 59 60
the observed decrease of PCH production (Figure 2). In contrast, the transcription and expression of all genes detected belonging to the PVD pathway were repressed in the presence of Fe3+, as expected, but at a clearly lower level in the presence of Co2+. These data were confirmed by RT-qPCR experiments using several genes: two genes of the PVD pathway (an enzyme involved in PVD biosynthesis pvdJ and the transcriptional regulator pvdS) and five genes of the PCH pathway (the transcriptional regulator pchR, the inner membrane permease fptX, the outer membrane transporter
fptA and two enzymes involved in PCH biosynthesis pchA and pchE) and the housekeeping gene uvrD,
which was used for normalization (Figure 3A). RT-qPCR demonstrated a large decrease in transcript levels for all genes of the PCH pathway in the presence of both Fe3+ and Co2+, except for the gene encoding the transcriptional regulator pchR. Concerning the genes of the PVD pathway, a strong repression is observed for the two genes tested with Fe3+ and at a lower extend with Co2+. For Ni2+ and Zn2+ no significant transcriptional repression of the seven genes tested was observed (Figure 3A), but in some case a very small increase of transcription.
In conclusion, the transcription and expression of the proteins of the PCH pathway (exception for PchR) are more strongly repressed in the presence of Co2+, than the genes of the PVD pathway.
Co2+ differently affects the expression of the genes the PCH operons. The RT-qPCR experiment
(Figure 3A) highlighted for all genes of the PCH pathway, except for the one corresponding to the transcriptional regulator pchR, a large decrease in transcript levels in the presence of Co2+ compared to growth conditions in the absence of metals, while the presence of Fe3+ repressed the transcription of all genes including pchR. This observation indicates that Co2+, and not Fe3+, affects differently the transcription of the genes of PCH operons. The genes of these four PCH genes belong to three different operons: pchA and pchE belong to the two operons coding for the enzymes involved in PCH biosynthesis pchDCBA and pchEFGHI, fptX to the PCH-Fe fptABCX operon, and pchR which is not in an operon with other genes (Scheme 1). Co2+ is apparently able to repress fptABCX, pchDCBA and
pchEFGHI operons and not pchR.
3 4 5 6 7 8 9 10 11 12 13 14 15 16 17 18 19 20 21 22 23 24 25 26 27 28 29 30 31 32 33 34 35 36 37 38 39 40 41 42 43 44 45 46 47 48 49 50 51 52 53 54 55 56 57 58 59 60
To investigate further this observation, we followed the expression of the four proteins PchA, PchE, FptX and PchR of the PCH pathway during bacterial growth, in the presence of the biological metals, using four strains that express fluorescent fusion proteins between mCherry and PchA (pchA-mCherry strain, Table 1), PchE (pchE-mcherry), FptX (fptX-mCherry), and the transcriptional regulator PchR (mCherry-pchR).48 These proteins were tagged with mCherry at the N- or C-terminal end, and the tagged proteins chromosomally integrated. The presence of the tag has been shown to affect neither the transcription of the proteins (by RT-qPCR) nor their biological activities (siderophore production or ferri-siderophore uptake).48 During bacterial growth, in the absence of any metals, two different variation of mCHERRY fluorescence were observed depending on the strains. For pchA-mCherry,
pchE-mcherry and fptX-mCherry strains a strong increase of fluorescence is observed corresponding
to an increase of PchA-mCHERRY, PchE-mCHERRY and FptX-mCHERRY fusion protein expression (Figure 3B). On the opposite, for mcherry-pchR in the same growth conditions, mCHERRY fluorescence decreased slightly after 6 hours culture (Figure 3C). As expected, the presence of 5 µM Fe3+ repressed strongly PchA-mCHERRY, PchE-mCHERRY, mCHERRY-FptX and mCHERRY-PchR fusion protein expression during bacterial growth. Consistent with the RT-qPCR data (Figure 3A), Co2+ repressed the expression of PchA-mCHERRY, PchE-mCHERRY and mCHERRY-FptX but not of mCHERRY-PchR. Ni2+ and Zn2+ at the concentrations tested had no effect on the expression of the four fusion proteins. Actually their presence slightly induced the expression of PchA-mCHERRY, PchE-mCHERRY and PchE-mCHERRY-FptX, probably because of the metal-restriction growth conditions.
Based on the P. aeruginosa genome, pchR expression is regulated solely by Fur (presence only of a Fur-Box) and pchDCBA, pchEFGHI, and fptABCX operons by both Fur and PchR regulators (the presence of both Fur- and PchR-boxes upstream of these genes) (Scheme 1). Our data show that the presence of Co2+ inhibits only the transcription of genes that depend on a PchR box for their expression. 3 4 5 6 7 8 9 10 11 12 13 14 15 16 17 18 19 20 21 22 23 24 25 26 27 28 29 30 31 32 33 34 35 36 37 38 39 40 41 42 43 44 45 46 47 48 49 50 51 52 53 54 55 56 57 58 59 60
Co2+ can enter P. aeruginosa cells by the TonB-dependent transporter FptA. According to current
knowledge concerning the interaction of the transcriptional regulators Fur and PchR with Fe (formation of Fur-Fe and PchR-PCH-Fe complexes), the interaction of Co2+ with one of these regulators includes the importation of Co2+ into the bacteria and, in the case of PchR, the presence of PCH-Co to form a PchR-PCH-Co complex.46 When Co2+, Ni2+ and Zn2+ are incubated with PCH in solution, the UV spectral modifications observed compared to the UV spectrum of apo PCH, indicates that PCH is able to chelate these three metals (Figure 2SM). Moreover, previously we have determined a Ka of PCH for Zn2+ of Ka = 1026.0 M-2 (Ka = 1028.8 M-2 for Fe3+).28 Previous studies of our group, in which we used ICP-AES (Inductively Coupled Plasma Atomic Emission Spectroscopy, which allows the detection of metals traces), showed that Co2+ and Ni2+ can both enter P. aeruginosa cells
via the FptA/PCH pathway when bacteria were grown in succinate-containing medium.24 Here, we used the same approach to verify that bacteria grown in CAA medium are also able to efficiently import Co2+ and Ni2+. CAA is 10 fold more iron-restricted than succinate medium: iron concentration of 300 nM for succinate medium and 20 nM for CAA.13 We used a PVD and PCH-deficient strain (∆pvdF∆pchA, Table 1) to control the presence of siderophores and their concentrations in the assay. The importance of the PCH pathway in metal uptake was evaluated by using the fptA (PCH-Fe outer membrane transporter) mutant strain ΔpvdFΔpchAΔfptA (Table 1).
As expected, fptA deletion markedly affected Fe accumulation in P. aeruginosa cells in the presence of PCH (Figure 4A), as well as that of Co2+, showing that Co2+ is imported into P. aeruginosa cells by the FptA transporter (Figure 4A). Co2+ uptake certainly occurs in a complex with PCH, since this transporter recognizes only PCH-metal complexes and not siderophore-free metals.49,50 However, the amount of Co2+ imported by the FptA/Pch system is lower than the amount of Fe3+ acquired. We observed no significant FptA-dependent uptake for Ni2+ and Zn2+ at the metal concentrations tested here, as previously reported.24
We also investigated the ability of PCH-Co complexes to compete with and inhibit PCH-55Fe import in
P. aeruginosa cells. The PVD and deficient strain (∆pvdF∆pchA) was incubated with 0.2 µM
PCH-3 4 5 6 7 8 9 10 11 12 13 14 15 16 17 18 19 20 21 22 23 24 25 26 27 28 29 30 31 32 33 34 35 36 37 38 39 40 41 42 43 44 45 46 47 48 49 50 51 52 53 54 55 56 57 58 59 60
55Fe with or without 0.2 µM and 2 µM (1 and 10-fold excess) PCH-metal complexes and the radioactivity incorporated into the bacteria (during a 30-min incubation) counted. Incubation of the bacteria in the presence of PCH-55Fe alone resulted in the uptake of approximately 90 pmol of 55Fe per cell per 30 min (Figure 4B). We observed 60 % inhibition of this uptake in the presence of 2 µM PCH-Co. We also carried out a competition assay with PCH-Ni and PCH-Zn complexes, but observed no significant inhibition of 55Fe uptake via PCH.
These data all suggest that, in the range of metal concentrations tested, Co2+ and Ni2+ can enter bacteria both by diffusion (Co2+ and Ni2+ accumulation in the fptA mutant, Figure 3A) and also via the PCH/FptA uptake system for Co2+. Consequently, PCH-Co complexes, as well as siderophore-free Co2+ and Ni2+, are present in P. aeruginosa cells.
The presence of Co2+ in the bacterial environment does not affect the intracellular iron
concentration in P. aeruginosa cells. P. aeruginosa PAO1 cells were also grown in the presence of 5 µM Co2+ or Ni2+ to assess how the intracellular concentrations of all biological metals were affected by the presence of an excess of these two metals (Figure 5). Surprisingly, although Co2+ can enter bacteria by diffusion or in competition with Fe3+ by the FptA/PCH pathway, the intracellular iron
concentration was not affected. This suggests that bacteria can adapt to potential competition between Fe3+ and Co2+ for the FptA/PCH system during growth and that the intracellular iron content is maintained, even in the presence of 5 µM Co2+ contamination.
Excess Co2+ in the bacterial environment does not affect Fur regulation. We next elucidated the
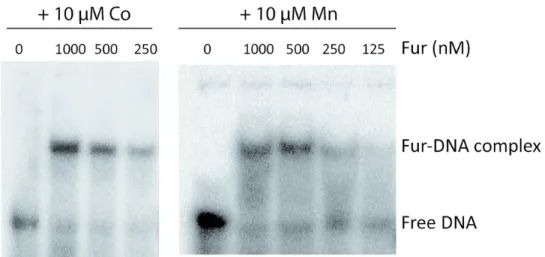
molecular mechanism involved in the Co-dependent repression of PCH pathway expression by investigating the ability of Fur-Co complexes to interact with the Fur boxes in vitro. E. coli Fur has been shown to bind DNA sequences containing Fur boxes by interacting with metals other than Fe2+51 and Fur of P. aeruginosa has been shown to be capable of binding to the Fur box in the presence of Co2+ in a nuclease protection assay44 and in the presence of Mn2+ in an EMSA (electrophoretic mobility shift 3 4 5 6 7 8 9 10 11 12 13 14 15 16 17 18 19 20 21 22 23 24 25 26 27 28 29 30 31 32 33 34 35 36 37 38 39 40 41 42 43 44 45 46 47 48 49 50 51 52 53 54 55 56 57 58 59 60
assay) assay.52 It is not possible to run EMSA in the presence of Fe2+ because of its oxidation.
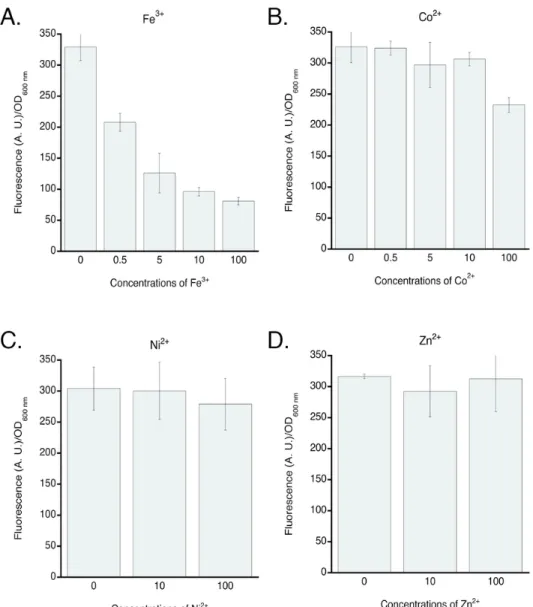
Consequently, it is well accepted in the literature to use Mn2+ ions to mimic Fe2+ for the DNA binding assay.52 Here EMSA experiments were carried out in the presence of Co2+ and Mn2+, with purified Fur protein and the promoter region of pchD, containing the Fur-box present upstream of the pchDCBE operon. An interaction between Fur-Co and the pchD promoter sequence was observed (Figure 6), proving that Fur-Co is able to bind to this sequence. However, our proteomic, transcriptomic and RT-qPCR data (Table 2 and Figure 3A), as well as the expression data using mCherry fusion proteins (Figure 3B-3C), clearly show that the presence of Co2+ in the bacterial environment does not repress all Fur-dependent genes, as does the presence of Fe3+. Therefore, we also used a plasmid (pAYC5) carrying
the mCherry sequence and the PCH promoter of pchDCBA operon (Table 1SM) to investigate the behavior of Fur in the presence of Co2+ in P. aeruginosa cells. Since this promoter region also contains a PchR box, we carried out this experiments in strain unable to express PchR (∆pchR strain). Bacteria carrying this construct were grown in CAA medium with increasing concentration (0-100 µM) of Co2+ or Fe3+ and the mCherry fluorescent signal monitored at 610 nm (excitation at 570 nm). As expected, the addition of Fe3+ to the bacterial growth medium caused the repression of mCherry expression (Figure 7A): the Fur-Fe complex interacts with the bacterial Fur boxes, which represses the transcription and expression of mCherry and any Fur-dependent genes. The addition of Co2+ to the bacterial medium had no significant effect on mCherry expression (Figure 7B) for concentrations of Co2+ equivalent or lower than 10 µM and a weak effect was observed at 100 µM. We carried out the same experiment with 10 and 100 µM Ni2+ or Zn2+ (Figure 7C and 7D) and no repression of mCherry expression was observed.
Overall, our data show that, Fur-Co can bind to the PCH Fur-box but does not repress Fur-dependent gene expression in vivo like Fe2+ whereas equivalent effects are observed for both metals for PCH production (Figure 2).
The purified cytoplasmic regulator PchR can bind to PCH-Co and PCH-Ni in addition to PCH-Fe. PchR, 3 4 5 6 7 8 9 10 11 12 13 14 15 16 17 18 19 20 21 22 23 24 25 26 27 28 29 30 31 32 33 34 35 36 37 38 39 40 41 42 43 44 45 46 47 48 49 50 51 52 53 54 55 56 57 58 59 60
the transcriptional activator of the genes of the PCH pathway, activates the transcription of all PCH genes, except pchR, by interacting with the PchR box (no PchR box upstream of pchR gene).21–23 We carried out binding assays between purified PchR (MBP fused PchR46 and purified protein shown in Figure SM3) and PCH-Co and PCH-Ni, based on a spectroscopy approach previously described, using the fluorescent properties of the tryptophans (Trp) of PchR published previously.46 When MBP-PchR is excited at 280 nm, tryptophan present in the protein emits intrinsic fluorescence with maximal intensity at 330 nm (Figure 4SM). Upon the addition of ligands, such as PCH-Fe, the fluorescence is quenched. Thus, the protein’s affinity for its ligand can be determined by plotting the relative fluorescence intensity, F0/F, with F0 being the fluorescence emitted by MBP-PchR without ligand and F the fluorescence emitted by MBP-PchR once a specific concentration of ligand has been added. Afterwards, Kd values are determined using the Stern-Volmer representation and linear regression. PCH-metal complexes were prepared by incubating 2 equivalent of PCH with one of metal (Figure 2SM).
We determined an affinity of PCH-Fe (Kd = 5.82 ± 2.84 µM) for MBP-PchR that was slightly better as that described previously (Kd = 41 ± 5 µM)46. PCH-Co was also able to bind to PchR with a Kd of 13.9 ± 3.4 µM, as well as PCH-Ni and PCH-Zn (Kd values of 42 ± 4.3 µM and 47.4 ± 2.2 µM, respectively -for details see Figure 4SM). We were unable to investigate the ability of PchR-PCH-Co to bind the PchR box (EMSA assays with the purified MBP fused PchR protein), probably because of the presence of the tag, as well as problems with protein aggregation.
Role of PchR in the repression of the PCH pathway in the presence of Co2+ and Ni2+. We further
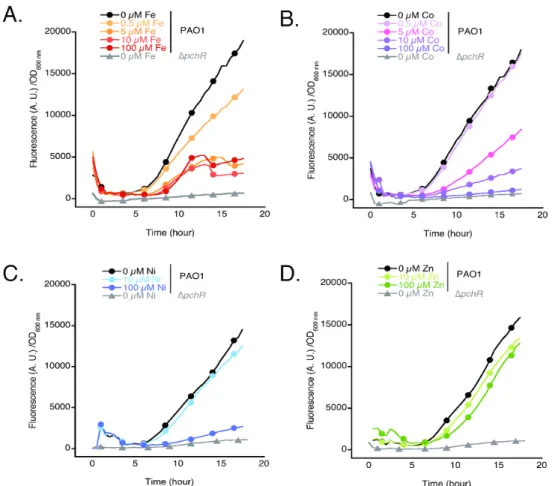
explored the mechanism involved in the repression of PCH production observed in the presence of Co2+ and Ni2+ by constructing a plasmid (pAYC5-FURmut) carrying the mCherry sequence and the promoter of the pchDCBA operon containing only the PchR box and the Fur box having being mutated (Table 1SM and 2SM). The strains PAO1 and ∆pchR (unable to express PchR) carrying this plasmid were grown in CAA medium supplemented with increasing concentrations of metals (Fe2+, Co2+, Ni2+ 3 4 5 6 7 8 9 10 11 12 13 14 15 16 17 18 19 20 21 22 23 24 25 26 27 28 29 30 31 32 33 34 35 36 37 38 39 40 41 42 43 44 45 46 47 48 49 50 51 52 53 54 55 56 57 58 59 60
or Zn2+). In the absence of metals, in the WT (PAO1) background (kinetics with black dots in Figure 8A-8D), the fluorescence corresponding to mCherry expression highly increased in function of time, but not in the ∆pchR strain unable to express the transcriptional activator PchR (kinetics with grey triangles in Figure 8A-8D), indicating that PchR is necessary to observe mCherry expression. For PAO1, in the presence of increasing concentrations of Fe3+, this fluorescence corresponding to mCherry expression decreased during bacterial growth (Figure 8A). This observation is due to Fur which gets loaded with Fe2+, interacts with its promoter regions and consequently the expression of PchR and
the other proteins of the PCH pathway is repressed (Figure 3A and Table 2). Since less PchR is expressed, mcherry transcription is no more activated and lower level of fluorescence are observed compared to the condition in the absence of metal.
In the presence of increasing concentrations of Co2+ or Ni2+ (but not Zn2+; Figure 8B-8D), the fluorescence corresponding to mCherry expression also decreased in PAO1 cultures, but less than in the presence of Fe3+. Higher concentrations of Co2+ (10 µM) and Ni2+ (100 µM) are necessary to elicit an effect equivalent to that observed with Fe3+ (5 µM). In that case, the decrease of fluorescence is not due to an absence of PchR expression, since Co2+ or Ni2+ present in the P. aeruginosa environment were both unable to repress the expression of Fur-regulated genes (Figure 7). Co2+ (and probably also Ni2+) are likely present in the bacterial cytoplasm, mostly in their PCH-complexed forms (50 µM is the concentration of PCH in the bacterial culture and 5 µM metals are added to the growth media). Increasing concentrations of PCH-Co or PCH-Ni complexes in the bacterial cytoplasm certainly leads to an increase in the concentrations of PchR-PCH-Co or PchR-PCH-Ni complexes, at the expense of PchR-PCH-Fe complexes, but only PchR-PCH-Fe complexes are probably able to activate transcription of the genes for the proteins of the PCH pathway and mcherry from pAYC5-FURmut plasmid. In such a scenario, the expression of PchR-regulated genes, as the genes of the PCH pathway, is less highly activated and less PCH is produced (Figure 2). This also explains why the presence of Co2+ or Ni2+ does not repress pchR expression, as the transcription of this gene is not regulated by the PchR promoter, but only the Fur box (Scheme 1).45
3 4 5 6 7 8 9 10 11 12 13 14 15 16 17 18 19 20 21 22 23 24 25 26 27 28 29 30 31 32 33 34 35 36 37 38 39 40 41 42 43 44 45 46 47 48 49 50 51 52 53 54 55 56 57 58 59 60
In conclusion, the presence of high levels of Fe3+, Co2+, or Ni2+ (to a lesser extent) in the bacterial environment induces repression of the transcription of PCH genes (except pchR) by two different molecular mechanisms. In the presence of Fe3+ in the bacterial environment, the transcriptional
repressor Fur, in a complex with Fe2+, represses the expression of these genes. In the presence of Co2+ or Ni2+, Fur is not involved, but rather the transcriptional activator PchR, which is no more able to activate the production of PCH, probably due to a decrease in the intracellular concentration of PchR-PCH-Fe complexes. 3 4 5 6 7 8 9 10 11 12 13 14 15 16 17 18 19 20 21 22 23 24 25 26 27 28 29 30 31 32 33 34 35 36 37 38 39 40 41 42 43 44 45 46 47 48 49 50 51 52 53 54 55 56 57 58 59 60
Discussion
The requirement for different biological metals in bacteria are very different and depend on their biological function. The relative intracellular concentrations of these metals in P. aeruginosa PAO1 cells are Na-K > Mg >> Ca >> Fe-Zn >> Mn-Mo-Cu-V-Cr-Ni >> Co13, with Fe and Zn being the two most
abundant transition metals (concentrations between 10-3 and 10-4 M, depending on the growth medium). The intracellular concentrations of Cu, Mn, Mo, and Ni are generally between 10-5 and 10 -4 M13 and Co is used only in very small amounts by P. aeruginosa (a concentration too low to be
detected by ICP-AES13). Very similar values have been described for wild type E. coli53 and can
probably be found in many Gram-negative bacteria in planktonic growth conditions.
Since, all biological metals become toxic at high concentrations and are highly deleterious to living organisms, the intracellular concentrations of these biological metals have to be finely regulated to stay constant. Siderophores play a key role in iron homeostasis.21 Increasing number of publications
also suggest that siderophores may play a role in the homeostasis of other biological metals.18
Indeed, these compounds are able to chelate many metals other than Fe3+,18 their production can be
modulated by different metals30–34 and they often play a role in bacterial metal resistance.17,18 These
observations lead to the question whether bacteria are able to activate their siderophore production in response to the presence of metals other than Fe3+. As in previous studies,24 we showed that none
of the metals tested was able to significantly activate PVD or PCH production above that induced by iron restriction (Figure 2). Moreover, there is currently no data available to support the existence of bacterial sensors that detect toxic metals in the bacterial environment and consequently activate siderophore production. All current data suggest that for example the protective role of siderophores against toxic metals is probably only a consequence of the presence of large amounts of siderophores produced in response to iron starvation. However, the formation of siderophore-metal complexes with metals other than Fe3+ may increase the sense of iron starvation by bacteria, because
siderophores are in complex with metals other than Fe3+ and consequently less siderophore-Fe is
imported into the bacteria. 3 4 5 6 7 8 9 10 11 12 13 14 15 16 17 18 19 20 21 22 23 24 25 26 27 28 29 30 31 32 33 34 35 36 37 38 39 40 41 42 43 44 45 46 47 48 49 50 51 52 53 54 55 56 57 58 59 60
In the present work, Co2+ and Ni2+ were able to repress the production of PCH and for Co2+, with the same efficiency as Fe3+. PCH production is positively regulated by the transcriptional activator PchR and negatively by the transcriptional repressor Fur (Scheme 1). PchR activates the transcription of all PCH genes, except pchR, by interacting with the PchR box (no PchR box upstream of pchR, Scheme 1). Consequently, a decrease of PCH production must be due to either Fur-dependent repression or the inability of PchR to still activate PCH production. Our data show that Fur regulation is insensitive to the presence of excess Co2+ (or Ni2+), even if Co2+ bound to Fur proteins in vitro and formed complexes with Fur boxes. Our experimental data show that the repression of PCH production by Co2+ and Ni2+ involves PchR. They also show that PCH-Co enters bacteria via the TonB-dependent outer membrane transporter FptA and can bind to PchR in vitro. Since a repression of PCH production is as well observed in the presence of Ni2+, we cannot exclude that PCH-Ni is also able to enter P. aeruginosa cells but with uptake rates too low to be detected by our approach. Altogether, these data describe a mechanism in which PCH-Co, after entering P. aeruginosa cells by FptA, interacts with PchR to form PchR-PCH-Co complexes unable to activate the transcription of PchR-regulated genes. The formation of PchR-PCH-Co or PchR-PCH-Ni complexes in the bacterial cytoplasm certainly leads to a decrease in the intracellular concentration of PchR-PCH-Fe, leading to a decrease in the transcription of PCH pathway genes and, thus, the production of PCH.
The repression of PCH production was more pronounced with Co2+ than Ni2+ and cannot be explained simply by the difference in affinities of PchR for the PCH-Co and PCH-Ni complexes. Previous studies, based on titration experiments, have shown that the binding affinity of PCH is higher for Ni2+ than Co2+ (relative affinity of PCH for biological metals having been proposed Fe(III) > Mo(VI) = Cu(II) > Ni(II) > Co(II) > Zn(II) > Mn(II).33 On the contrary, the PCH-Co complex more efficiently competes with PCH-Fe for the TonB-dependent transporter FptA (affinities of PCH-Co and PCH-Ni for FptA in the range of 15 nM and 50 nM, respectively24) and is more efficiently transported into P. aeruginosa cells. The higher efficiency of Co2+ to repress PCH production is probably linked to its higher ability to enter P.
aeruginosa cells as a PCH-Co complex relative to PCH-Ni.
3 4 5 6 7 8 9 10 11 12 13 14 15 16 17 18 19 20 21 22 23 24 25 26 27 28 29 30 31 32 33 34 35 36 37 38 39 40 41 42 43 44 45 46 47 48 49 50 51 52 53 54 55 56 57 58 59 60
ICP-AES measurements of intracellular metal concentrations of P. aeruginosa cells grown with or without Co2+ showed no effect of this metal on the intracellular iron concentration. This indicates that the inhibition of PCH production in the presence of Co2+ has little effect on bacterial iron homeostasis under our growth conditions. The ability of Co2+ to interfere with Fe3+ acquisition via the PCH/FptA
pathway (55 % inhibition of PCH-55Fe uptake in P. aeruginosa PAO1 cells when incubated for 30 min in the presence of PCH-Co complexes) does not affect the access to iron of the pathogen. This organism uses several strategies to obtain access to iron; if one iron acquisition pathway is compromised, the bacteria simply uses another.12
FptA plays a key role in the outer membrane for the uptake of the right metal by PCH. Previous studies from our group have shown that FptA at the bacterial surface can bind different PCH-metal complexes, with affinities ranging from 10 nM to 4.8 µM, (the affinity of PCH-Fe being 10 nM).24 However, only Fe3+ and, to a lesser extent, Co2+ can accumulate significantly in P. aeruginosa cells via the PCH pathway, but with uptake rates clearly lower than those for Fe3+. Moreover, previous studies have also shown that PCH complexes Ga3+ and the formed complex is transported into P. aeruginosa cells via FptA.24,54 Ni2+ is probably also transported in complex with PCH with low uptake rates, since the presence of this metal in the bacterial environment represses PchR regulated genes. FptA, due to its uptake specificity, avoids and controls the uptake of most metals other than Fe3+ across the outer
membrane and limits the uptake of Co2+ and Ni2+. Fe3+, Co2+ and Ni2+ are part of the iron triad and all three elements show similar properties such as the metallic radius (124, 125, 125 pm, respectively) and the electronic configuration. Ga3+ has a radius slightly larger (187 ppm) than Fe3+ but very similar coordination properties. Consequently, PCH-Co, PCH-Ni and PCH-Ga have certainly very close conformations, which is not the case for PCH-Cu and PCH-Zn complexes (two metals with different coordination properties compared to Fe3+). The metallic radius and similar coordination properties
could be responsible for the high specificity of FptA for PCH-metal complexes. 3 4 5 6 7 8 9 10 11 12 13 14 15 16 17 18 19 20 21 22 23 24 25 26 27 28 29 30 31 32 33 34 35 36 37 38 39 40 41 42 43 44 45 46 47 48 49 50 51 52 53 54 55 56 57 58 59 60
We are aware that the µM concentrations of Co2+ and Ni2+ used in this study are not truly physiological in the natural environment thrived by P. aeruginosa, and exposure to such concentrations appears unlike during infections and exceptional also in natural environment. However, such concentrations are often used in the literature in studies investigating the role of siderophores in bacterial resistance to metals or in development of bioremediation processes using siderophore producing bacteria to decontaminated metal polluted media or wastes. In such contexts, it is important to understand how siderophore production and siderophore-dependent Fe3+ uptake pathways in bacteria interfere with
an excess of metals other than Fe3+ and what are the molecular mechanisms involved.
Conclusion
We show for the first time, how an excess of biological metals, other than iron, can interfere with transcriptional regulators that control the transcription of genes of the PCH pathway. The presence of high levels of Fe3+, Co2+, or Ni2+ (to a lesser extent) in the bacterial environment represses the transcription of PCH genes by two different molecular mechanisms. In the presence of increasing Fe3+ concentrations, the transcriptional repressor Fur gets loaded with Fe2+ and represses the expression
of all pch genes. In the presence of increasing Co2+ or Ni2+ concentrations, Fur is not involved, but the transcriptional activator PchR gets loaded with PCH-Co and PCH-Ni and consequently is no more able to activate the transcription of pch genes, due to a decrease in the intracellular concentration of PchR-PCH-Fe complexes.
PchR appears to have broad metal-binding specificity, but since only a few metals (Fe3+, Ga3+, Co2+, and Ni2+) are able to enter bacteria by the FptA/PCH pathway, most which could be present as a contaminant in the bacterial environment do not affect PCH production. Indeed, FptA acts as a selective gate for the uptake of PCH-metal complexes and allows the uptake of only PCH-Fe and, to a lesser extent, PCH-Ga, PCH-Co, and PCH-Ni. The presence of these PCH-metal complexes in the bacterial cytoplasm interferes with the regulation of PCH production by interacting with PchR and inhibiting the positive autoregulatory loop that involves PchR (Scheme 2). The inability of PchR-PCH-3 4 5 6 7 8 9 10 11 12 13 14 15 16 17 18 19 20 21 22 23 24 25 26 27 28 29 30 31 32 33 34 35 36 37 38 39 40 41 42 43 44 45 46 47 48 49 50 51 52 53 54 55 56 57 58 59 60
Co and PchR-PCH-Ni to activate the expression of PCH genes highly suggests that PCH is not involved in the acquisition by P. aeruginosa of these two metals, but that their uptake via PCH is simply a non-specific interference of these two metals with the PCH pathway. Moreover, the Achilles heel of the P.
aeruginosa PCH pathway, in terms of excess Co2+ in the bacterial environment, is the selectivity of FptA for metal transport. However, the ability of PchR to interact with many different PCH-metal complexes leads to a decrease in PCH production and consequently a decrease in PCH-Co and PCH-Ni import.
Conflicts of interest
There are no conflicts to declare.
Acknowledgments
This work was partly funded by the Centre National de la Recherche Scientifique. O. Cunrath held a fellowship from the French Ministère de la Recherche et de la Technologie (3 years) and the FRM (Fondation pour la Recherche Médical, 6 months). A.Y Carballido Lopez held a fellowship from the University of Strasbourg (IDEX) and B. Pesset from the DGA (Direction Générale des l’Armement). J.P. and I.M.S. thank the Laboratory of Excellence GRAL (grant ANR-11-LABX-49-01) and the Labex ARCANE (grant ANR-11-LABX-0003-01). The Transcriptome and Epigenome Platform is a member of the France Génomique consortium (ANR10-NBS-09-08). We thank Dr A. Boos and P. Ronot (Institut Pluridisciplinaire Hubert Curien, Strasbourg) for their help in the ICP-AES measurements.
Author contributions
ACL evaluated the siderophore production in the presence of metals, performed the iron uptake assays, the experiment with the fluorescent strains (Figure 2) and binding assays with MBP-PchR. OC performed the metal uptake assays and metal quantifications. AF realized the molecular biology 3 4 5 6 7 8 9 10 11 12 13 14 15 16 17 18 19 20 21 22 23 24 25 26 27 28 29 30 31 32 33 34 35 36 37 38 39 40 41 42 43 44 45 46 47 48 49 50 51 52 53 54 55 56 57 58 59 60
(plasmid and strain constructions) and the fluorescent experiments in Figure 7 with GG. RL, HV, OS, JYC performed the transcriptional experiments and analyses. PMS and DB performed the proteomic experiments and analysis. JP and IM-S performed the electrophoresis mobility shift assays. BP and GLAM synthesized the PCH used in the experiments. QP realized the spectral characterization of PCH-metal complexes. PF realized the RT-qPCR experiment and participated in the design of all experiments and the analysis of all data. IJS directed the project, analyzed data and wrote the paper. All authors discussed the results and contributed to the writing of the manuscript.
References
1 C. L. Dupont, S. Yang, B. Palenik and P. E. Bourne, Proc. Natl. Acad. Sci. U. S. A., 2006, 103, 17822– 17827.
2 N. J. Robinson, Nat Chem Biol, 2007, 3, 692–3.
3 K. J. Waldron, J. C. Rutherford, D. Ford and N. J. Robinson, Nature, 2009, 460, 823–30. 4 E. D. Weinberg, Biochim. Biophys. Acta, 2009, 1790, 600–605.
5 T. E. Kehl-Fie and E. P. Skaar, Curr. Opin. Chem. Biol., 2010, 14, 218–224.
6 K. Y. Djoko, C. Y. Ong, M. J. Walker and A. G. McEwan, J. Biol. Chem., 2015, 290, 18954–18961. 7 R. C. Hider and X. Kong, Nat Prod Rep, 2011, 27, 637–57.
8 K. N. Raymond, E. A. Dertz and S. S. Kim, Proc Natl Acad Sci U A, 2003, 100, 3584–8. 9 P. Cornelis, Appl Microbiol Biotechnol, 2010, 86, 1637–45.
10 I. J. Schalk and L. Guillon, Amino Acids, 2013, 44, 1267–1277.
11 P. E. Powell, G. R. Cline, C. P. P. Reid and P. J. Szaniszlo, Nature, 1980, 287, 833–834. 12 P. Cornelis and J. Dingemans, Front Cell Infect Microbiol, 2013, 3, 75.
13 O. Cunrath, V. A. Geoffroy and I. J. Schalk, Environ. Microbiol., 2016, 18, 3258–3267. 14 Z. Dumas, A. Ross-Gillespie and R. Kümmerli, Proc. Biol. Sci., 2013, 280, 20131055. 15 I. J. Schalk, G. L. A. Mislin and K. Brillet, Curr. Top. Membr., 2012, 69, 37–66. 16 I. J. Schalk and L. Guillon, Environ. Microbiol., 2013, 15, 1661–1673.
17 A. Braud, V. Geoffroy, F. Hoegy, G. L. A. Mislin and I. J. Schalk, Env. Microbiol Rep., 2010, 2, 419– 425.
18 I. J. Schalk, M. Hannauer and A. Braud, Env. Microbiol, 2011, 13, 2844–54. 19 M. F. Fillat, Arch. Biochem. Biophys., 2014, 546, 41–52.
20 M. A. Llamas, F. Imperi, P. Visca and I. L. Lamont, FEMS Microbiol Rev, 2014, 38, 569–97. 21 P. Cornelis, S. Matthijs and L. Van Oeffelen, Biometals, 2009, 22, 15–22.
22 P. Visca, Pseudomonas Vol. 2 Ed. Juan-Luis Ramos Kluver Acad. Publ. New-York, 2004, 69–123. 23 Z. A. Youard and C. Reimmann, Microbiol. Read. Engl., 2010, 156, 1772–1782.
24 A. Braud, M. Hannauer, G. L. A. Mislin and I. J. Schalk, J Bacteriol, 2009, 191, 5317–25. 25 A. Braud, F. Hoegy, K. Jezequel, T. Lebeau and I. J. Schalk, Env. Microbiol, 2009, 11, 1079–91. 26 A. M. Albrecht-Gary, S. Blanc, N. Rochel, A. Z. Ocacktan and M. A. Abdallah, Inorg Chem, 1994, 33,
6391–6402. 3 4 5 6 7 8 9 10 11 12 13 14 15 16 17 18 19 20 21 22 23 24 25 26 27 28 29 30 31 32 33 34 35 36 37 38 39 40 41 42 43 44 45 46 47 48 49 50 51 52 53 54 55 56 57 58 59 60
27 C. Ferret, J. Y. Cornu, M. Elhabiri, T. Sterckeman, A. Braud, K. Jezequel, M. Lollier, T. Lebeau, I. J. Schalk and V. A. Geoffroy, Env. Sci Pollut Res Int, , DOI:10.1007/s11356-014-3487-2.
28 J. Brandel, N. Humbert, M. Elhabiri, I. J. Schalk, G. L. A. Mislin and A.-M. Albrecht-Garry, Dalton
Trans, 2012, 41, 2820–34.
29 C. Baysse, D. De Vos, Y. Naudet, A. Vandermonde, U. Ochsner, J. M. Meyer, H. Budzikiewicz, M. Schafer, R. Fuchs and P. Cornelis, Microbiology, 2000, 146 ( Pt 10), 2425–34.
30 M. Huyer and W. J. Page, Appl Env. Microbiol, 1988, 54, 2625–2631.
31 M. Hofte, S. Buysens, N. Koedam and P. Cornelis, Biometals, 1993, 6, 85–91. 32 X. Hu and G. L. Boyer, Appl Env. Microbiol, 1996, 62, 4044–4048.
33 P. Visca, G. Colotti, L. Serino, D. Verzili, N. Orsi and E. Chiancone, Appl Env. Microbiol, 1992, 58, 2886–93.
34 G. M. Teitzel, A. Geddie, S. K. De Long, M. J. Kirisits, M. Whiteley and M. R. Parsek, J Bacteriol, 2006,
188, 7242–56.
35 A. Zamri and M. A. Abdallah, Tetrahedron, 2000, 56, 249–256.
36 F. Hoegy, G. L. Mislin and I. J. Schalk, Methods Mol Biol, 2014, 1149, 293–301.
37 V. Gasser, E. Baco, O. Cunrath, P. S. August, Q. Perraud, N. Zill, C. Schleberger, A. Schmidt, A. Paulen, D. Bumann, G. L. A. Mislin and I. J. Schalk, Environ. Microbiol., 2016, 18, 819–832.
38 R Core Team, .
39 M. I. Love, W. Huber and S. Anders, Genome Biol., 2014, 15, 550. 40 Y. Benjamini and Y. Hochberg, J. R. Stat. Soc., 1995, 57, 289–300.
41 B. Langmead, C. Trapnell, M. Pop and S. L. Salzberg, Genome Biol., 2009, 10, R25. 42 Y. Liao, G. K. Smyth and W. Shi, Bioinforma. Oxf. Engl., 2014, 30, 923–930. 43 F. Hoegy and I. J. Schalk, Methods Mol Biol, 2014, 1149, 337–46.
44 J. Pérard, J. Covès, M. Castellan, C. Solard, M. Savard, R. Miras, S. Galop, L. Signor, S. Crouzy, I. Michaud-Soret and E. de Rosny, Biochemistry, 2016, 55, 1503–1515.
45 L. Michel, N. Gonzalez, S. Jagdeep, T. Nguyen-Ngoc and C. Reimmann, Mol Microbiol, 2005, 58, 495– 509.
46 P.-C. Lin, Z. A. Youard and C. Reimmann, Biometals Int. J. Role Met. Ions Biol. Biochem. Med., 2013,
26, 1067–1073.
47 H. Gross and J. E. Loper, Nat Prod Rep, 2009, 26, 1408–46.
48 O. Cunrath, V. Gasser, F. Hoegy, C. Reimmann, L. Guillon and I. J. Schalk, Env. Microbiol, 2015, 17, 171–85.
49 D. Cobessi, H. Celia, N. Folschweiller, M. Heymann, I. Schalk, M. Abdallah and F. Pattus, Acta
Crystallogr Biol Crystallogr, 2004, 60, 1467–9.
50 K. Brillet, C. Reimmann, G. L. A. Mislin, S. Noël, D. Rognan, I. J. Schalk and D. Cobessi, J Am Chem
Soc, 2011, 133, 16503–9.
51 A. Adrait, L. Jacquamet, L. Le Pape, A. Gonzalez de Peredo, D. Aberdam, J. L. Hazemann, J. M. Latour and I. Michaud-Soret, Biochemistry, 1999, 38, 6248–6260.
52 U. A. Ochsner, A. I. Vasil and M. L. Vasil, J Bacteriol, 1995, 177, 7194–201. 53 C. E. Outten and T. V. O’Halloran, Science, 2001, 292, 2488–92.
54 E. Frangipani, C. Bonchi, F. Minandri, F. Imperi and P. Visca, Antimicrob. Agents Chemother., 2014,
58, 5572–5575.
55 C. K. Stover, X. Q. Pham, A. L. Erwin, S. D. Mizoguchi, P. Warrener, M. J. Hickey, F. S. Brinkman, W. O. Hufnagle, D. J. Kowalik, M. Lagrou, R. L. Garber, L. Goltry, E. Tolentino, S. Westbrock-Wadman, Y. Yuan, L. L. Brody, S. N. Coulter, K. R. Folger, A. Kas, K. Larbig, R. Lim, K. Smith, D. Spencer, G. K. Wong, Z. Wu, I. T. Paulsen, J. Reizer, M. H. Saier, R. E. Hancock, S. Lory and M. V. Olson, Nature, 2000, 406, 959–64.
56 V. Gasser, L. Guillon, O. Cunrath and I. J. Schalk, J Inorg Biochem, 2015, 148, 27–34.
57 E. Martínez-García, T. Aparicio, A. Goñi-Moreno, S. Fraile and V. de Lorenzo, Nucleic Acids Res., 2015, 43, D1183-1189.
58 L. Guillon, S. Altenburger, P. L. Graumann and I. J. Schalk, PLoS ONE, 2013, 8, e79111. 3 4 5 6 7 8 9 10 11 12 13 14 15 16 17 18 19 20 21 22 23 24 25 26 27 28 29 30 31 32 33 34 35 36 37 38 39 40 41 42 43 44 45 46 47 48 49 50 51 52 53 54 55 56 57 58 59 60
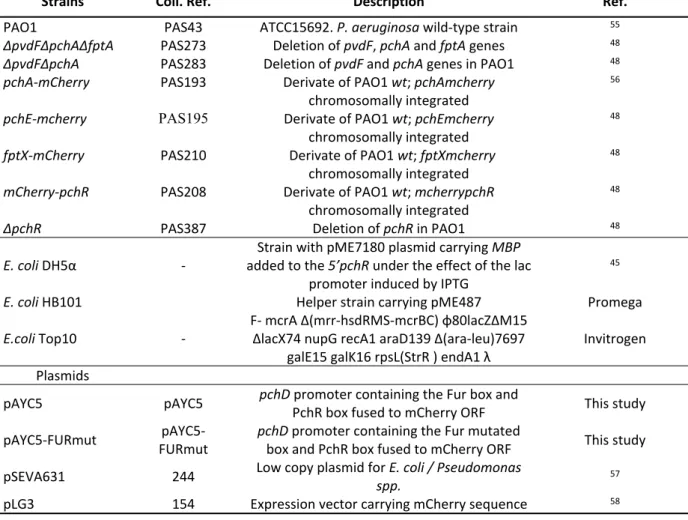
Table 1. Bacterial strains and plasmids used in this study.
Strains Coll. Ref. Description Ref.
PAO1 PAS43 ATCC15692. P. aeruginosa wild-type strain 55
ΔpvdFΔpchAΔfptA PAS273 Deletion of pvdF, pchA and fptA genes 48
ΔpvdFΔpchA PAS283 Deletion of pvdF and pchA genes in PAO1 48
pchA-mCherry PAS193 Derivate of PAO1 wt; pchAmcherry
chromosomally integrated
56
pchE-mcherry PAS195 Derivate of PAO1 wt; pchEmcherry
chromosomally integrated
48
fptX-mCherry PAS210 Derivate of PAO1 wt; fptXmcherry
chromosomally integrated
48
mCherry-pchR PAS208 Derivate of PAO1 wt; mcherrypchR
chromosomally integrated
48
ΔpchR PAS387 Deletion of pchR in PAO1 48
E. coli DH5α -
Strain with pME7180 plasmid carrying MBP added to the 5’pchR under the effect of the lac
promoter induced by IPTG
45
E. coli HB101 Helper strain carrying pME487 Promega
E.coli Top10 - F- mcrA Δ(mrr-hsdRMS-mcrBC) φ80lacZΔM15 ΔlacX74 nupG recA1 araD139 Δ(ara-leu)7697 galE15 galK16 rpsL(StrR ) endA1 λ
Invitrogen Plasmids
pAYC5 pAYC5 pchD promoter containing the Fur box and PchR box fused to mCherry ORF This study pAYC5-FURmut FURmut pAYC5- pchD promoter containing the Fur mutated box and PchR box fused to mCherry ORF This study pSEVA631 244 Low copy plasmid for E. coli / Pseudomonas spp. 57 pLG3 154 Expression vector carrying mCherry sequence 58 3 4 5 6 7 8 9 10 11 12 13 14 15 16 17 18 19 20 21 22 23 24 25 26 27 28 29 30 31 32 33 34 35 36 37 38 39 40 41 42 43 44 45 46 47 48 49 50 51 52 53 54 55 56 57 58 59 60