Concept of Operations and the DoD Architecture
Framework
by
Nicholas K. James
Submitted to the Department of Aeronautics and Astronautics
in partial fulfillment of the requirements for the degree of
Master of Science in Aeronautics and Astronautics
at the
MASSACHUSETTS INSTITUTE OF TECHNOLOGY
June 2018
@
Massachusetts Institute of Technology 2018. All rights reserved.
Signature redacted
A uthor ...
Department of Aeronautics and Astronautics
May 24, 2018
Certified by ...
Signature redacted
EdvzEU1. Crawley
Professor of Aeronautics and Astronautics
Thesis Supervisor
Accepted by...
JUN
28
2018
LIBRARIES
Signature redacted
Hamsa Balakrishnan
Associate Professor of Aeronautics and Astronautics
Chair, Graduate Program Committee
Concept of Operations and the DoD Architecture Framework
by
Nicholas K. James
Submitted to the Department of Aeronautics and Astronautics on May 24, 2018, in partial fulfillment of the
requirements for the degree of
Master of Science in Aeronautics and Astronautics
Abstract
This thesis presents a framework for Concept of Operations (ConOps), based on the standards for capturing operations used in the government and industry. An understanding of operations early in system design is critical to the development of effective, successful systems. The current standards for Operational Concepts and the Operational Viewpoint of the Department of Defense Architecture Framework (DoDAF) outline lengthy descriptions that are cumbersome in the early stages of a system's development. The DoDAF Operational Viewpoint was analyzed in depth to distill the important information relevant to operations. This information was built into the System Architecture framework as a bottom-up approach of coordinating the operations of architecture, operators, and context in order to meet system goals. The resulting ConOps definition and framework was then compared against DoDAF Operational Viewpoint diagram samples in a Search and Rescue system case study, in order to validate the framework. The study found that the framework provides a shorter description with more clarity than the DoDAF diagrams.
Thesis Supervisor: Edward F. Crawley
Acknowledgments
I would like to thank my advior, Edward F. Crawley, Ford Professor of Engineering
at MIT and Founding President of Skoltech. Ed tirelessly guided me in the field of systems architecture, which I had no experience or prior knowledge of, and taught me how to think in terms of systems. He has been endlessly patient with me, and is an excellent mentor in professional and informal settings. It's been wonderful working with him, and I'm going to miss hearing stories about his fascinating life.
The cadre of AFROTC Det 365, especially Lt Col Sheryl "Double" Ott, Capt Peterson Dela Cruz, and TSgt Jason Spon, were immensely helpful in my development as a leader, and my pursuit of this opportunity at MIT. I wish them all the best, and will keep in touch!
Martin York and John Graham blazed the trail that I followed in taking this fifth year as a graduate student, and I would not have been able to do it without them. I am grateful for their mentorship and friendship over the years, and look forward to joining them in Texas next year!
I was incredibly lucky to have such a great network of friends, throughout my fraternity, the AeroAstro department, Det 365, and all my office mates in 33-409. Nick Villanueva toiled away with me into the wee hours of the morning, and was consistently there to bounce ideas off of, vent to, and blow off steam with. Kirsty Cullinan could always cheer me up and give me the motivation I needed to keep going. Last, I would like to thank my family for supporting me, developing me, and understanding when I had to stay in Boston over breaks to keep working. I promise
Contents
1 Introduction
1.1 M otivation . . . . 1.2 Literature review . . . . 1.2.1 System Architecture . . . . 1.2.2 Concept of Operations and Operational Concept .
1.2.3 Department of Defense Architecture Framework .
1.3 Specific thesis objectives . . . . 1.4 Thesis overview . . . .
2 Analysis of DoDAF Operational Viewpoint
2.1 Introduction to the Operational Viewpoint . . . . 2.2 Individual diagram analysis . . . .
2.2.1 OV-1: High-Level Operational Concept Graphic 2.2.2 OV-2: Operational Resource Flow Description .
2.2.3 OV-3: Operational Resource Flow Matrix . . . .
2.2.4 OV-4: Organizational Relationships Chart . . . .
2.2.5 OV-5a: Operational Activity Decomposition Tree
2.2.6 OV-5b: Operational Activity Model . . . . 2.2.7 OV-6a: Operational Rules Model . . . .
2.2.8 OV-6b: State Transition Description . . . . 2.2.9 OV-6c: Event-Trace Description . . . .
2.3 Sum m ary . . . . 13 . . . . 13 . . . . 15 . . . . 15 . . . . 20 . . . . 22 . . . . 26 . . . . 27 29 . . . . 29 . . . . 33 . . . . 33 . . . . 36 . . . . 39 . . . . 41 . . . . 42 . . . . 46 . . . . 47 . . . . 49 . . . . 53 . . . . 55
3 Development of ConOps Framework 59
3.1 Operational Viewpoint information content ... 59
3.1.1 Overlap within the Operational Viewpoint . . . . 59
3.1.2 Operations versus architecture . . . . 63
3.1.3 Summary of results . . . . 64
3.2 Defining and capturing ConOps . . . . 65
3.2.1 ConOps framework . . . . 66
4 ConOps Case Study: Search and Rescue 71 4.1 Textual SAR ConOps . . . . 72
4.2 Depicting SAR ConOps . . . . 73
4.2.1 Recommended depiction . . . . 73
4.2.2 DoDAF depiction . . . . 74
4.2.3 D iscussion . . . . 78
5 Conclusion 81 5.1 Summary and main findings . . . . 81
List of Figures
1-1
1-2
1-3
Basic OPM Elements ... OPM Relationships ... Simple OPD Example ... 2-1 DoDAF Operational Viewp
2-2 DoDAF Operational Viewp
2-3 "Complete" OV-1 Sample 2-4 2-5 2-6 2-7 2-8 2-9 2-10 2-11 2-12 2-13 2-14 2-15 2-16 2-17 2-18 int- CPD oint OPI . . . .
with Sample Info.
. . . . . . . . . . . . . . . . . . . . . . . . . . . . . . . . . . . . . . . . . . . . . .1. . . . . Annotations
Sparse OV-1 Sample . . . .
OPD of "Complete" OV-2 Elements OPD of Minimum OV-2 Elements . OV-2 Sample ...
OPD of OV-3 Elements ...
OV-3 Sample ...
OPD of OV-4 Elements ... OV-4 Sample ...
OPD of OV-5a Elements ... OV-5a Sample ... OPD of OV-5b Elements ... OV-5b Sample ...
OV-6a Sample ...
Pictorial OV-6a Sample
OPD of OV-6b Elements (A lternativ
2-19 OPD of OV-6b Elements (Alternative 2)
18 19 20 31 32 34 35 37 37 38 40 41 42 43 44 45 46 47 49 50 51 52 (A
2-20 2-21 2-22 2-23 3-1 3-2 3-3 3-4 OV-6b Sample ...
OPD of OV-6c Elements ...
Flowchart OV-6c Sample . . . . Sequence Diagram OV-6c Sample . . . .
Count of Appearances of Elements in OPDs OPD of Systems Viewpoint -1 Elements . . OPD of ConOps Elements . . . . ConOps Framework . . . . 52 54 55 56 60 64 67 69
List of Tables
1.1 Standards for Operational Concept Documents/Descriptions . . . . . 23 3.1 Operational Viewpoint Sample Summary Table . . . . 61 3.2 Operational Viewpoint Samples Cross Analysis . . . . 62
Chapter 1
Introduction
1.1
Motivation
The idea of operations, or the process of producing an effect, is important and complex enough that an entire field of study, Operations Research (OR), has been built around it. Although the practice has been around for as long as humans have applied science to the organization and management of systems, it only became a named field as recently as World War II, when the British government organized a team that included scientists to advise military leaders on how to employ new radar technology most effectively
133].
The term Operations Research was originally used to distinguish this application from the technical research being done on understanding and improving radar itself [33].Since then, the domain of OR has been expanded, unified, and codified into a field that "uses indeed quantitative techniques to make and prepare decisions, by deter-mining the most efficient way to act under given circumstances" [16]. The research makes impacts in areas as varied as energy, finance, health care, marketing, and trans-portation [22]. Similarly to how engineering can be thought of as the application of scientific principles to build systems, OR applies scientific methods to organize and manage systems.
There are plentiful examples of well designed systems being improperly or in-efficiently operated. One example of this is the Concorde Supersonic Transport, a
supersonic passenger aircraft that was flown commercially from 1976 to 2003 [7]. Al-though the aircraft itself met the engineering requirements defined for it and was well built, the aircraft did not succeed in making a profit [7]. An analysis of its operations early on in the process could have set expectations for the operating costs, which would subsequently set some requirements for the design of the aircraft. This exam-ple also hints that operations are relevant to the idea of system validation, which goes beyond verification (satisfying engineering requirements) to determine if the system satisfies the needs of stakeholders.
An example of the impact of OR closer to home is a city power grid. When a person turns on a light, they expect that there will be electricity to power it. However, power plants do not supply a constant amount of power at all times. Rather, they adjust their power production throughout the day and year to meet expected needs [23J. The optimization of this system is non-trivial, and includes factors such maximum plant capacity, individual unit capacities, likelihood and impact of equipment failures and other outages, etc.
1231.
Building power plants that are optimized for efficiency, while also never failing to provide the necessary power, falls within the scope of OR. The question becomes, can the operational considerations from the OR domain be considered during the design process, to produce systems that are already tailored to their operational context? Research shows that as a complex system progresses through its lifecycle, the cost of fixing errors in the system grows exponentially [30].A similar increase can be assumed to apply to changing a system to better suit its
operational environment. Thus, the earlier that a system's operational context can be understood, the easier and less expensive it will be to tailor it to function efficiently, and the more likely the project will be a success. If the operations of a system can be modeled during the development of a system architecture, then it will have the greatest impact on creating a successful system.
In general, the purpose of this thesis is to determine how operations can be framed and modeled early in the design process to be used as a tool in designing, simulating, and building a successful system.
1.2
Literature review
In order to build a framework for operations, it is important to determine where the framework should fit in to the design process, and how system operations are currently captured. The domain of System Architecture will be discussed first, to introduce the framework and terminology that will persist throughout the remainder of the thesis. That discussion will also include an introduction to the Object-Process Methodology sometimes used to model architecture. This review will then delve into the literature related to Concept of Operations (and Operational Concepts), followed
by a specific introduction to the Department of Defense Architecture Framework.
1.2.1
System Architecture
The idea of architecting has ancient origins, dating back to thousands of years to
Egypt and Rome [261. The concept of architecture has expanded beyond buildings to
encompass the fundamental structure of any thing; simple circuits, algorithms, space-craft, human teams, and transportation systems all have architectures. Architectures consist of abstractions of the elements of a system and their relationships [111.
The merging of architecture and systems has been spurred on in the past few decades by several factors, including an increase in system complexity and scope, the introduction of computers into systems, and the use of models and simulations in the design process
1261.
System Architecture, as the domain is formally called in modern times, is gaining recognition, with over 100,000 professionals using the title "system architect" 111]. Similarly to System Engineering, System Architecting focuses on managing complexity in a system and organizing its components to achieve a goal beyond that of the sum of its parts [11]. A formal definition of System Architecture is proposed by Crawley et. al.:System Architecture is the embodiment of concept, the allocation of physical/informational function to the elements of form, and the def-inition of relationships among the elements and with the surrounding
The fundamental elements of architectures, highlighted in the definition above, are: concept, function, form, relationships, and context. An introduction to these elements follows, but Crawley et. al. provide detailed descriptions in reference [11].
In general, a concept is vision, idea, notion or mental image that maps one set of ideas to another, and supports larger cognitive transitions [111. As such, an ar-chitectural concept is not meant to be a complete model of a system, but rather a simplification of the architecture that allows for high-level reasoning [111. It is an intermediate step in linking the goals of a system to the system architecture.
Form refers to the elements that compose a system and their relationships. These elements need not be strictly physical: for example, the form associated with an al-gorithm would be the lines of code. Many types of relationships can exist between these elements of form. The predominant relationships are spatial/topological, which describe where the elements are relative to one another, and connectivity, which de-scribe how different elements are joined to each other. For example, a vehicle wheel is underneath the vehicle (spatial), and is connected mechanically to the vehicle's axle (connectivity). Other relationships can include membership to a group or class, se-quence, and interpersonal human relationships. Another term for form is instrument, which specifically refers to an element of a system that performs processes.
Function is the combination of process and operand. Operands are the objects that are produced, consumed, or modified by processes. In other words, they are what processes act on. Processes are what happens, entirely independent of form and operand. In this framework, processes are usually stated as verbs ending in "-ing" Elements can also be related via functional relationships, which refer to processes transferring, exchanging, or jointly acting on operands.
Context describes everything relevant to a system, but outside of the system boundary. One strategy for defining the system boundary is to ensure that, when systems in the context intrude on the system, the intrusions can be accommodated without breaking the system [26]. Everything that would break the system is thus included within the boundary. Formal and functional relationships can cross the system boundary into the context.
Object-Process Methodology
There are several tools that are commonly used to model architectures, including Uni-fied Modeling Language (UML), System Modeling Language (SySML), and Object-Process Methodology (OPM). This thesis will primarily use OPM for architecture modeling, so an introduction to OPM and its notation follows. This introduction provides information on the aspects being used in this thesis, but for more informa-tion refer to reference 115].
OPM was created to be a simple method for modeling complex systems, whether it be during the design of a system or modeling an existing system for understanding or improvement. Dov Dori's philosophy in creating OPM was that systems are complex enough, so a modeling methodology should be as simple as possible while capturing the essential aspects of a system. These aspects were determined to be: function (what a system does), structure (composition and relationships of the system), and behavior (system change over time). OPM was designed to be abstract enough that it can be applied to any domain.
OPM conveys system information through Object-Process Diagrams (OPDs) and Object-Process Language (OPL), in order to appeal to different parts of the brain. These two representations have specified rules relating one to the other. OPL is written in plain English for ease of understanding. The content of this thesis focuses on OPDs, the elements of which are described below.
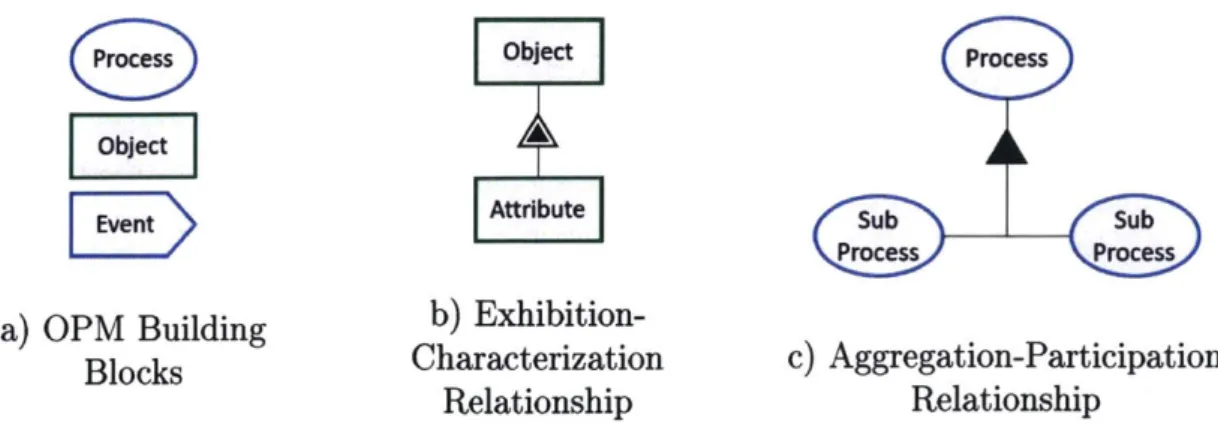
As shown in Figure 1-1-a, OPDs represent processes as blue-outlined ovals, and ob-jects (form, operands, agents, and organizations) as green-outlined rectangles. Events are not specified entities in OPM, but they are used in this thesis and will be shown in blue-outlined rectangles tapered to a point on the right side. The definition of event used here is a combination of those used in DoDAF and SySML: the instantaneous receipt of an operand (either physical or informational), often from another system [12, 181.
Figure 1-1-b depicts an Exhibition-Characterization relationship between an ob-ject and an attribute. This type of relationship can provide additional details about
Object Process
objct
EntAttribute Sub Sub
Process Process
a) OPM Building b)
Exhibition-Blocks Characterization c) Aggregation-Participation Relationship Relationship
Figure 1-1: Depicts the building blocks and two essential relationships of OPM, and their representation in OPDs
an object or process by depicting a feature that is important to the system, or is affected by a process. Features, specifically called attributes and operations, are spe-cial instances of either objects or processes respectively, and are depicted in the same manner of their counterparts. Either type of feature can be used to describe objects and processes, and they characterize what they are connected to. For example, the object Printer could have the attribute Black and White, and an operation Printing, since both of these features characterize a printer. The convention is for the triangle to point toward the object or process being described, as shown.
Figure 1-1-c shows an Aggregation-Participation relationship between processes. This relationship is used as a way of decomposing either processes or objects. This relationship can only connect elements of the same type, i.e. a process cannot decom-pose into objects. The convention is for the arrow to point toward the higher-level object or process. Objects and processes can also be nested within higher level objects or processes, but that notation is not used in this thesis.
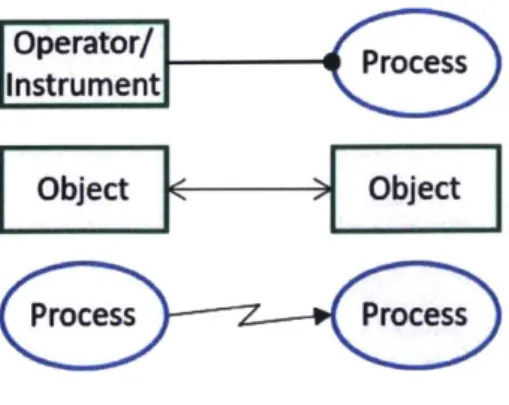
Other types of relationships used in this thesis are shown in Figure 2. Figure 1-2-a shows the three fundamental relationships between processes and operands, which are (from top to bottom): consumption, modification, and production. Modifications can also be shown by connecting processes to operand attributes.
Figure 1-2-b depicts the other three OPM relationships used in this thesis. The top relationship is an operator/instrument link. Operators and instruments are both
Proces E Operand peato
ProcessOperand Object Object
Procei " ~OperandPrcsPoes
a) Process-Operand Relationships b) Other Relationships
Figure 1-2: a) Depicts the three Process-Operand relationships used in OPM: (top to bottom) consumption, modification, and production. b) Shows three other important OPM relationships used in this thesis: (top to bottom) operator/instrument link, structural link, and invocation link
performers, with the former referring to a person or organization capable of indepen-dent thought and action, and the latter referring to an element of form. For example, for the process of writing, the operator would be the writer, and the instrument would be a pencil or pen. The OPM documentation actually specifies that instrument links use open circles, but for the purpose of this thesis, all performer links will be shown with closed circles.
The middle relationship in Figure 1-2-b is a structural link. It typically connects objects, and can connect processes, but not between the two types. Structural links are used to show spatial/topological relationships, organizational relationships, or relationships other than those specified elsewhere. The arrow can be double-headed, showing a mutual relationship, or single-headed, showing a one-way relationship.
The bottom part of Figure 1-2-b depicts an invocation relationship. This is used to depict that one process follows another, while repressing the operand that is passed between them. Note that in this framework it is assumed that processes are always triggered by the transfer of an operand, whether that be a signal, physical mass flow, or any other object.
Salt, water, flour, yeast Mixing Mixer I Dough Baking Oven Bread Slicing Cutter System Boundary Slices
Figure 1-3: Depicts a simple OPD for a sliced-bread-making system [11]. It shows the flow of operands from top to bottom, and the performer-process-operand convention from right to left.
[111. The two-dimensional arrangement of elements in this system is used to
con-vey the conventional performer-function (performer-process-operand) structure. More complicated systems are not expected to be arranged in this way. None of the re-lationships are constrained in number, i.e. a process can have multiple performers, an instrument or operator can be the performer of multiple processes, a process can consume, create, or modify multiple operands, etc.
Note that the inputs (salt, water, flour, yeast) and the outputs (slices) are passed across the system boundary. The accompanying systems (not shown) that produce the inputs and consume the outputs are in the context, not the system. What is shown is the concept of a sliced-bread-making system.
1.2.2
Concept of Operations and Operational Concept
Having reviewed the concepts of architecture, System Architecture, and Object-Process Methodology, the question becomes: how does the understanding of
oper-ations fit into the picture? A logical starting point is looking into Concept of Opera-tions (ConOps).
ConOps is a widely used tool in engineering to depict how a system is used, or expected to be used, in practice. Various definitions exist throughout literature:
The concept of operations sketches out how the system will operate: who will operate it, when, and coordinated with what else [11]
[ConOps] describes how the system will be operated during life-cycle phases to meet stakeholder expectations. It describes the system char-acteristics from an operational perspective and helps facilitate an under-standing of the system goals.
[..
.
It stimulates the development of the requirements and architecture related to the user elements of the system. [241A verbal and graphic statement of an enterprise's assumptions or intent
in regard to an operation or series of operations of a system or a related set of systems. The operational concept is frequently developed as part of a system development or acquisition program. The operational concept is designed to give an overall picture of the operations using one or more specific systems, or set of related systems, in the enterprise's operational environment from the users' and operators' perspective. [35]
Note that the last of those definitions is actually for Operational Concept (Op-sCon) rather than ConOps. It was presented next to a definition for ConOps that referred to a strategic plan for the operations of an organization or enterprise, rather than of a designed system, which is what this thesis is interested in. This demon-strates that there is a lack of consensus on even the terminology of ConOps/OpsCon. In general, the difference is just in preferred terminology, and this thesis will continue to use ConOps except when discussing sources that explicitly use OpsCon.
With the exception of the inconsistent terminology, the definitions presented above share some common threads. All three specifically include references to the user or
operator of a system, and they all focus on depicting how the system is operated. Two of them mention context or environment, but only one mentions sequence or timing. Beyond these commonalities, the definitions offer no rigorous definition of what should be included in ConOps, at what scope, and with what focus.
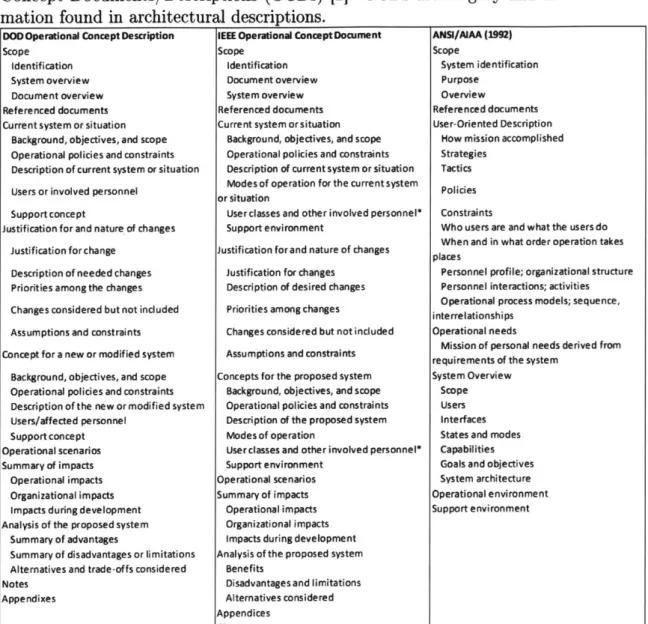
The search for standards regarding ConOps continued into the evaluation of lit-erature discussing OpsCon. Table 1.1 lists the elements specified by the Depart-ment of Defense, IEEE, and ANSI/AIAA standards for Operational Concept Docu-ments/Descriptions (OCDs) [2]. The literature appears to agree that OpsCon is the more frequently used term in industry, as three standards were found for creating OCDs and none for ConOps.
The first striking observation is how much information the OCDs are expected to include, and how lengthy a full description would be. This observation is proven correct; six sample OCDs for systems ranging from the DalTrans Transportation Management Center to the James Webb Space Telescope range in length from 25 to
265 pages [8, 28, 29, 31, 32, 341.
A closer inspection of the standards shows that not only are these descriptions
lengthy, but they also include many aspects of the systems that fall distinctly into a description of architecture, as described in Section 1.2.1. Both the standards and examples indicate that much of the information is conveyed textually rather than visually. With the rising popularity of model based systems engineering, a visual depiction is preferred for conveying ConOps. The Department of Defense Architecture Framework attempts to capture operations using sets of diagrams, and is introduced next in Section 1.2.3.
1.2.3
Department of Defense Architecture Framework
The Department of Defense Architecture Framework (DoDAF) standardizes the fram-ing and modelfram-ing of all architectures within the Department of Defense (DoD) so that managers can more effectively make key decisions, and information can be easily shared between departments, projects, and other entities
1131.
Although it only gov-erns architectures within the US DoD, it has become a standard for militaries aroundTable 1.1: Contents of the DoD, IEEE, and ANSI/AIAA standards for Operational Concept Documents/Descriptions (OCDs)
121.
OCDs are lengthy and includeinfor-mation found in architectural descriptions.
DOD Operational Concept Description Scope
Identification System overview Document overview
Referenced documents Current system or situation
Background, objectives, and scope
Operational policies and constraints
Description of current system or situation
Users or involved personnel
Support concept
Justification for and nature of changes Justification for change
Description of needed changes
Priorities among the changes
Changes considered but not induded
Assumptions and constraints
Concept for a new or modified system Background, objectives, and scope Operational policies and constraints Description of the new or modified system Users/affected personnel Support concept Operational scenarios Summary of impacts Operational impacts Organizational impacts impacts during development
Analysis of the proposed system
Summary of advantages
Summary of disadvantages or limitations
Alternatives and trade-offs considered Notes
Appendixes
IEEE Operational Concept Document Scope
Identification Document overview System overview
Referenced documents Current system or situation
Background, objectives, and scope Operational policies and constraints Description of current system or situation Modes of operation for the currentsystem or situation
User classes and other involved personnel*
Support environment
Justification for and nature of changes
Justification for changes Description of desired changes Priorities among changes
Changes considered but not included
Assumptions and constraints Concepts for the proposed system
Background, objectives, and scope Operational policies and constraints Description of the proposed system Modes of operation
User classes and other involved personnel*
Support environment
Operational scenarios Summary of impacts
Operational impacts Organizational impacts impacts during development
Analysis of the proposed system
Benefits
Disadvantages and limitations
Alternatives considered Appendices Glossary ANSI/AIAA (1992) Scope System identification Purpose Overview Referenced documents User-Oriented Description
How mission accomplished Strategies
Tactics Policies Constraints
Who users are and what the users do When and in what order operation takes
places
Personnel profile; organizational structure Personnel interactions; activities Operational process models; sequence,
interrelationships Operational needs
Mission of personal needs derived from requirements of the system
System Overview Scope
Users interfaces States and modes Capabilities Goals and objectives
System architecture
Operational environment
the globe, with similar architectures existing for NATO, the UK, France, Canada, Italy, and Australia, among others [17].
The framework specifies two types of architectures: Enterprise Architectures and Solution Architectures. The distinction is that Enterprise Architectures discuss a mission and the organizational approach to that mission, and Solution Architectures focus on a designed system.
The formal definition of Solution Architectures proposed by DoDAF is:
A framework or structure that portrays the relationships among all the
elements of something that answers a problem. This architecture type
[...I is used to define a particular project to create, update, revise, or
delete established activities in the Department. Solution architecture may be developed to update or extend one or more of the other architecture types. [...] Solution architectures include, but are not limited to, those
[Service-Oriented Architecture]-based architectures developed in support of specific data and other services solutions. [13]
This formulation aligns with the discussion of architecture found in Section 1.2.1; it depicts the elements and relationships of a system to meet a goal. Beyond defining what an architecture is, DoDAF also breaks it into several viewpoints, tailored to meet the needs of different stakeholders. These viewpoints are (descriptions from reference [12]):
* All Viewpoint: describes the overarching aspects of architecture context that relate to all viewpoints
* Capability Viewpoint: articulates the capability requirements, the delivery tim-ing, and the deployed capability
" Data and Information Viewpoint: articulates the data relationships and
align-ment structures in the architecture content for the capability and operational requirements, system engineering processes, and systems and services
* Operational Viewpoint: includes the operational scenarios, activities, and re-quirements that support capabilities
" Project Viewpoint: describes the relationships between operational and
capa-bility requirements and the various projects being implemented
" Services Viewpoint: the design for solutions articulating the Performers,
Ac-tivities, Services, and their Exchanges, providing for or supporting operational and capability functions
" Standards Viewpoint: articulates the applicable operational, business,
techni-cal, and industry policies, standards, guidance, constraints, and forecasts that apply to capability and operational requirements, system engineering processes, and systems and services
" Systems Viewpoint: the design for solutions articulating the systems, their
com-position, interconnectivity, and context providing for or supporting operational and capability functions
The Operational Viewpoint is of specific interest to this thesis, and will be dis-cussed in depth in Chapter 2. Details of the other viewpoints can be found in refer-ences [12, 13].
History of DoDAF
DoDAF is currently on Version 2.02, but the history of architecture frameworks in the DoD dates back to 1996, with the introduction of Version 1.0 of the C4ISR Architecture Framework
191.
C4ISR stands for Command, Control, Communica-tions, Computers, Intelligence, Surveillance, and Reconnaissance, and is very much an information-technologies domain. Although the scope of applicability was smaller, the purpose of this original architecture was the same as that of DoDAF today: to standardize architectural information across the DoD such that systems are more easily understandable and integratable.Even with the introduction of DoDAF V1.0, which took the framework beyond the C4ISR domain and into DoD-wide applicability, remnants of the information-technologies centric framework remained. Until DoDAF V2.0, the only operands (objects that processes act on) that could be passed between processes or form was information. Now they can be funding, personnel, materiel, etc. 1121. Despite this up-date, it is expected that DoDAF may not be entirely equipped to adequately capture operations of systems with physical, mobile elements. The usefulness of the DoDAF
Operational Viewpoint is discussed in Chapters 3 and 4.
Other important changes that came with DoDAF V2.0 were the exclusion of the node element, and the switch from focusing on products to focusing on architectural data. The former change came as a result of nodes being used to represent almost any aspect of a system that this framework dubs form: organizations, systems, facilities, locations, etc. [12]. Thus, the use of nodes varied between architectures, and the resulting confusion led to them being removed in favor of representing each concept
individually.
The change to focusing on specifying architectural data was an attempt to in-crease flexibility and allow architects to display information in whatever format is best suited for the system [121. This shifted the burden of modeling architectures from the DoDAF specification to commercial tools such as UML and SySML [121. The assumption was that these tools would update to the changes in DoDAF V2.0.
1.3
Specific thesis objectives
Having reviewed the literature, a few observations about the state of the field become apparent. The first is that the domain of Systems Architecture is an ideal starting point to define a ConOps. Architectural descriptions are at an appropriate level of abstraction for depicting ConOps, and the terminology and building blocks are general enough that they can be applied to describe operations as well as architectures.
The second observation is that the literature lacks a framework for ConOps that is consistent, but not redundant, with architectural models. Most of the documentation
on ConOps and OpsCon is lengthy and unwieldy, and consists mainly of elements found in an architecture. These standards are far too detailed to be manageable at an early stage in the design process, and thus their impact will not be as beneficial to the design of the system description.
The last observation, discussed in depth in Chapter 3, is that DoDAF specifically contains far more diagrams than the content suggest are required. Though diagrams can be a more effective tool than the other, largely textual documents, diagrams to excess can waste valuable time in the design process. Further, the number of comparisons required to make sure different diagrams are consistent is the factorial of the number of diagrams. Inconsistent diagrams will be confusing in the best case, and lead to system failure in the worst case.
With these observations in mind, the specific objectives of this thesis are to:
1. analyze the DoDAF Operational Viewpoint by evaluating the information
con-tent of diagram descriptions and samples, using OPM modeling methods 2. construct a ConOps framework by defining ConOps and outlining the
informa-tion that it should contain, using the results from the DoDAF analysis and the existing System Architecture framework
3. validate the ConOps framework developed by comparing it to textual and
DoDAF representations, using a Search and Rescue system case study
1.4
Thesis overview
This chapter reviewed the relevant literature and concepts related to architectures and ConOps. Chapter 2 will dissect the information contained in the DoDAF Operational Viewpoint by modeling the descriptions using OPM and distilling key information from sample diagrams.
The results of that analysis will be discussed in Chapter 3 to help inform a defini-tion of ConOps. This definidefini-tion will then be integrated into a Systems Architecture framework such that they are consistent and minimally redundant.
Chapter 4 will use a Search and Rescue (SAR) system case study to compare and contrast the DoDAF Operational Viewpoint depiction to that produced by the framework developed in Chapter 3. SAR was chosen because it is frequently used in the sample DoDAF diagrams, due to it being a universally understood concept with plenty of readily available information [201. Chapter 5 will summarize the thesis' main findings and contributions, and outline potential for future work.
Chapter 2
Analysis of DoDAF Operational
Viewpoint
2.1
Introduction to the Operational Viewpoint
The DoDAF Operational Viewpoint is one of the industry standards for describing the operations of complex systems, and as such, understanding it is vital to developing a ConOps framework. The Operational Viewpoint is just one of several viewpoints prescribed by DoDAF, so the information content, scope, and focus of the diagrams will indicate areas of interest to the development of the framework in Chapter 3.
This chapter will analyze the diagrams prescribed by the operational viewpoint, both by DoDAF specification and by information content of sample diagrams. The viewpoint is divided into nine diagrams that "describe the tasks and activities, oper-ational elements, and resource flow exchanges required to conduct operations" [121. The nine diagrams that comprise the Operational Viewpoint are:
" OV-1: High Level Operational Concept Graphic " OV-2: Operational Resource Flow Description
* OV-3: Operational Resource Flow Matrix
e OV-5a: Operational Activity Decomposition Tree
" OV-5b: Operational Activity Model " OV-6a: Operational Rules Model " OV-6b: State Transition Description " OV-6c: Event-Trace Description
Although DoDAF specifies that an explanation should accompany each diagram, this analysis will focus purely on diagram content. Each of the nine diagrams will be studied individually in two ways. First, the expected information content will be modeled in an OPD created from the DoDAF descriptions in reference [12]. Following that, sample diagrams found in the open literature will be dissected to determine what information they contain in practice. Approximately 150 sample diagrams were found and analyzed, though they are not uniformly distributed between the nine diagram types. A subset of samples were reviewed for a basic understanding, and to identify appropriate criteria to evaluate the entire set on. It was determined that the samples should be evaluated for the presence of the following information:
" Performers (operators/instruments) " Processes
" Process attributes (removed subsequently because virtually nonexistent)
* Sequence/timing " Operands
" Operand attributes
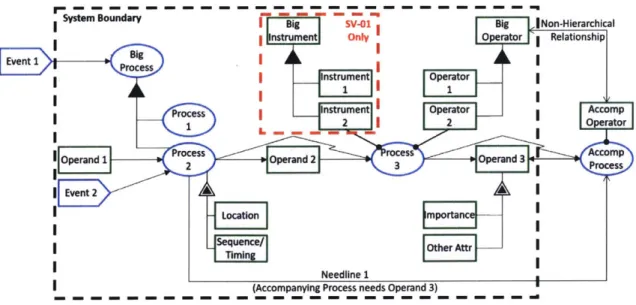
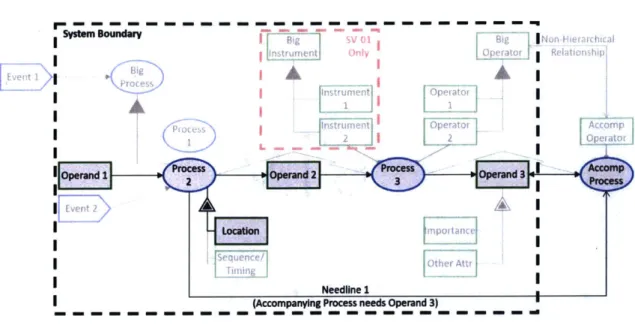
Following the individual diagram analysis, the total information content of the Operational Viewpoint will be discussed. The DoDAF Operational Viewpoint OPD shown in Figure 2-1 contains at least one instance of every element described in the
System Boundary Syte oudayBig
F
';M- SV-01 Big liNon-HierarchicalB nstrument Only 0 rator Relationship
Event I Proes
( a nynProcess n eed Operator
iael en cnstrument iOperator V p Accomp
2 | | 2 0 Oprator
Operand 1 Process Operand 2 rocess Operand 3 Viewp
Event 2
-tiinuO contmportance
Sehuence/wO tha
Timing
Needline 1
(d companying P itcess needsOpe 3)ncnd
Figure 2-1: DoDAF Operational Viewpoint OPD. This OPD depicts at least one
instance of every element contained in the DoDAF Operational Viewpoint.
Operational Viewpoint descriptions. The decomposition of form in the red dashed box appears only in the Systems Viewpoint, and not in the Operational Viewpoint, but is included so that the OPD contains all aspects of a complete system architec-ture. There are a few features of other sequeneh walking through. The top half of the OPD is broken into three somewhat distinct sections. On the left is a process decomposition, which refines Big Process into its component procses. In the center is a decomposition of instruments, which represents the static elements of the system itself. On the right is an organizational decomposition, which shows relationships
among various operators.
Shown across the center of the OPD is the critical sequence, which starts with Process 2 consuming Operand 1, and ends with the Accompanying process modifying Operand 3. Although there are no other sequences in this diagram, it should be noted that identifying the most important sequence of events for an operation is useful for understanding the operation and what might affect it. Below the critical sequence
are some example attributes of processes and operands. Needline 1 shows that the
Accompanying Process requires Operand 3 from Process 2, but does not depict how the operand actually flows through the system. The events on the left side of the diagram trigger the operation.
Systemn Boundary -~ -_ N
j g SVi 01 Bi INon Hlerarghica
Instrument Only _operator I Relationship
strument Opeator
A I r7o I
j I--!
(Process - - I Acomp
2 2e rator
10perand 1 2 Operand 2rocess %Operand 3L % AcTip .
- - .;-! -..-. Event 2 > Location -seue6cNeOtherAttr I Neecline I . .I - Performers I Operands Sequence I Operand Attributes DI Processes
Figure 2-2: Depicts which elements of the DoDAF Operational Viewpoint OPD cor-respond to which items of interest in the analysis of sample diagrams.
Figure 2-2 delineates what parts of the OPD correspond to the information being identified in the sample diagrams. The samples may include information beyond what is shown, but the important elements are boxed. Note that sequence is indicated both through logical arrangement of elements (hence the critical sequence being boxed) and through a diagram convention (hence the Sequence/Timing attribute being boxed).
There is some ambiguity in the analysis of the DoDAF specifications and sample diagrams. First, the DoDAF diagram descriptions contain imprecise language and, in some cases, contradictions. Second, interpreting sample diagrams with little or no context is a challenge and some decisions had to be made at the researcher's discretion.
Lastly, many of the sample diagrams found were created prior to DoDAF V2.0. The Operational Viewpoint remains mostly the same between versions, with two main changes: the removal of nodes as an element, and the inclusion of non-information resources. Prior to DoDAF V2.0, nodes could represent activities, systems, organiza-tions, personnel types, facilities, locaorganiza-tions, materials, installaorganiza-tions, etc. DoDAF V2.0
removes nodes in favor of individually depicting those entities. For the purpose of this analysis, nodes were assumed to represent either instruments or operators.
Regarding the latter change, in previous versions of DoDAF, diagrams could only show flows of information, a reminder of the information-technology-centric origins of DoDAF. Now, flows can be funding, personnel, and materiel, in addition to in-formation. For this analysis, any flow (information or otherwise) was categorized as a resource. These changes are not significant to the sample diagram analysis, so diagrams made for previous versions of DoDAF are included.
2.2
Individual diagram analysis
2.2.1
OV-1: High-Level Operational Concept Graphic
The OV-1 is a flexible, high level diagram used as a presentation or discussion tool, and as such is omitted from the combined analysis. Short summaries of the DoDAF description and sample diagrams are included for informative purposes.
Description
The primary purpose of the OV-1 is to aid communication by summarizing the op-erations of a complex system in a mission, class of missions, or scenario. It depicts, at a high level, what the subject of the architecture does, how it does it, and who does what in what order. In addition, the diagram sets the scope of the system, and highlights interactions with the environment and accompanying systems, interesting aspects of the operations, key operators and organizations, location of assets, and any other important high-level aspects of the system. Although there are many differ-ent elemdiffer-ents of information that can be included, it is up to the architect to decide which elements warrant inclusion, and at what level of detail, such that the diagram is understandable and useful. In the language of Systems Architecture, the OV-1 is a level 1 diagram, which is more abstract than level 2, where the other Operational Viewpoint diagrams exist [11].
OV-1 High-Level Operationa, Concept Graphic [AR HLOC ) Mon tr signal ~ NAkrcrt:INASR alo V ackicto / 4 ~ 4 h41
Figure 2-3: Sample of a "complete"
OV-1
High-Level Operational Concept Graphic for a Search and Rescue system[3].
This diagram contains most of the information that can be in an OV-1: instruments, operands, and location context.Samples
As expected from the description above, the sample OV-ls found vary in information contained and presentation format. Most of them, including that in Figure 2-3, took the form of resource flow networks, showing the exchange of information and other operands between instruments at different locations [3]. Figure 2-3 shows a "complete" OV-1, i.e. it depicts all of the information stated above, including labels on the operand flows. However, some of the samples, such as that in Figure 2-4, omitted one or two of those aspects
[10].
Figure 2-4 depicts a sparse diagram that only includes the instruments and limited location information. These two diagrams capture the two ends of the spectrum of OV-1 diagrams found.- Teisprwe 4 IV
hirastructurn
Command Center
Figure 2-4: Sample of a sparse
OV-1
High-Level Operational Concept Graphic for a school emergency response system [10]. This diagram contains the minimum amount of information expected in an OV-1: instruments and limited location context.2.2.2
OV-2: Operational Resource Flow Description
Description
The OV-2 description is somewhat self-contradictory and ambiguous, focusing in some places on operand flows, and noting that they are optional in other places. The most important feature seems to be the needline, which is a line that indicates a need to exchange operands between processes. The needline does not indicate an actual flow of operands, nor does it indicate the path that an operand flow would follow. The specification conveys that actual flows of operands are optional in the OV-2. Actual operand flows are required to be in the OV-3, and appear in the OV-5b, 6b, and 6c as well. In addition, the attributes of a process (specifically the location of the process) may be included in the OV-2. The information of an OV-2 including optional aspects is shown in Figure 2-5, and the minimum content is shown in Figure 2-5.
OV-2 diagrams can be used to express the capability boundary to stakeholders. DoDAF defines capability as "the ability to achieve a Desired Effect under specified (performance) standards and conditions through combinations of ways and means (ac-tivities and resources) to perform a set of ac(ac-tivities" [121. The capability boundary, though not explicitly defined, is interpreted as the boundary between the processes and operand flows belonging to the system-of-systems that directly provide the capa-bility, and those considered to be external or belonging to accompanying systems. The OV-2 is well suited to describe the capability boundary because it explicitly shows the processes and operand flows being considered, with little cluttering information.
For this reason, the OV-2 (or a simplified version) if often used as an OV-1.
Note that the needline for Operand 3 leads directly to Accompanying Process, whereas the actual flow of Operand 3 comes from Process 3. Figure 2-5 also depicts three different kind of interactions between operands and processes. Process 2 con-sumes Operand 1, and produces Operand 2, and Process 3 concon-sumes Operand 2 and produces Operand 3. The third kind of interaction is transformative, shown by the double headed arrow between Operand 3 and Accompanying Process; the process doesn't consume or produce Operand 3, but rather alters its attributes.
I
-~~
Bondr sV01 instrumentl Only Instrument IEvo'!rl NI I Big Process Operator I AL I i I cinstrument Operatot AOperand I Poess Operand 2 PoesOperand 3 cm
2rcs 3 Pr~aor oe
FI e~J nI 2>Lz\
LocaNen dmpoetan1
Needilne 1
(Accompanying Process needs Operand 3)
Figure 2-5: Depicts a "complete" OV-2 Operational Resource Flow Description. Note that it includes optional aspects such as actual resource flows and intermediate pro-cesses. ) rocess Process oc atio Sequenc Timing F---- - - F Instrument Only Astr~ment operator I nstrument Operator 2 2 Oprnd2rocess E~e e]
I
J
Other Lel-Att]erator1 Nor! -H ierai chicaI
Relationshipi Accomp Operatr_ ran3 I I I I Needline 1
(Accompanying Process needs Operand 3)
Figure 2-6: Depicts the minimum OV-2 Operational Resource Flow Description.
I
Syte Bondr
risPocess
IFperand Big Operator Rehati0ns - noUPDM SAR OV-2
OV-2 [Architectural Description] Nodes
V-2: Operya ne cti n na'l Operational connectivity and resource flow needlines
M~odes 10 odes Search * Needlinev Place Of Safety
Tsk tas ing''line*e DS distressSignal
Tsk:tak!
M tsIin 49"% =
Stat : stewus
ee 2lines V odes DS:distressSignal Nodes Rescue - Person In Distress
SNeedinml
as eitedin Figure 27 tedasml foc
DS : distressSignal Rqst: request r oTk atasking b elnea
sNeedli sa
q odes Rqst : request aNodes TI trackinfe inoeb
SAR Asset Controller Tactical C2 Mon"rn
of hischpte, adigra usngaln fte* lbln meds erecutda e Figure 2-7: Sample OV-2 Operational Resource Flow Description for a Search and
Rescue system [141.
Samples
As depicted in Figure 2-7, the OV-2 samples focus on performers (operators or
in-struments) and operands [14i. The performers are typically represented as the nodes using labeled boxes or other shapes, but several of the diagrams use pictures of the
performers. The lines connecting the nodes are labeled in a variety of ways. Some are simply labeled "Needline", some are given an identifying number, some have generic descriptions such as "Data Packet", and some show specific resources such as
"Re-quest for Aid". For the taxonomy of diagram samples introduced in the beginning
of this chapter, a diagram using any of those labeling methods were counted as de-picting resources. However, in diagrams with resource descriptions (whether generic or specific), it was rarely indicated whether the line represented a needline or actual operand flow.
Several of the samples included processes, generally associated with a performer but sometimes as their own nodes. Fewer included any details about the operands, and those that did simply listed the information type, transmission frequency, or units of measurement.
While the general format and information content of the OV-2 samples match the DoDAF specification, too many of them neglected to specify needlines or distin-guish them from actual resource flows for the needline to be considered a standard in practice. This may result from the fact that many stakeholder needs are more thoroughly identified and analyzed in a stakeholder map, making their inclusion in an Operational Resource Flow Description redundant [11].
2.2.3
OV-3: Operational Resource Flow Matrix
Description
The OV-3 is one of two non-pictorial diagrams prescribed by the Operational View-point (the other being the OV-6a). Instead, it takes the form of a matrix that associates operand flows with their important attributes, as shown in Figure 2-8. It uses this matrix form to organize much of the same information shown in the OV-2, but with more detail, into a table that can be referenced throughout the rest of the viewpoint. The DoDAF description does not specify what information must be included with the operand flows, except for the following: producing and consuming processes and locations, why the operand is necessary, and what needline the operand flow satisfies. One needline can represent one or more operand flows of different types. The information shown in the OV-3 is not meant to be exhaustive, but rather focus on the important operand flows, and the most important attributes associated with those operands. The diagram description specifically highlights flows that cross the capability boundary or are critical to the mission.
U-B -ig 0 I Nr
h instrument only er a tor era
BA
Ircs Instrument Operator
(Procesas insr ene Operator A
22 Opera
Operand 1 e Oper and Althd sho smportanc
Many of the sample OV-3s are actually templates for making the matrix, rather than examples of a matrix for a specific system such as that depicted in Figure 2-9 [25]. The elements meant to be contained in the matrix are labeled in the headings of each column. The headings align well with the types of information specified in the DoDAF description. Without exception, the samples include processes and operands. The focus is on operands, with processes only mentioned to provide context about where the operands are produced and consumed. Although most of the diagrams include details about the operand transfer (security, timeliness, etc.), only about half of the samples include additional information about the operands themselves.
Not all of the "diagrams" referenced needlines, and instead reference the operands themselves or other identifiers. This further supports the idea that needlines, despite being an important part of the DoDAF specifications, are either not practical or useful enough for universal use in industry, or are not well enough understood or implemented. As discussed in Section 2.2.2, this may be because needlines can be captured elsewhere, while actual operand flows are more important to operations.
Operational Exchange 5ending Receiving Producing Operational Consuming Operational
Operational Exchange Sending
Item Node
1 CV Request Tactical C2 Node
2 (j) Control Order Tactical C2 Node
3 (J Control Order Tactical C2 Node
4 ® Warning Order Search Node
5 T Medical Condition Search Node 6 CD Task SAR Asset Controller
7 (1 Task c9b SAR Asset Controller
. .. Disres Signlrson In Distress
8 CD Distress Signal Person In Distress
10 CD Distress Signal Person In Distress
11 (1) Track Info I& Monitoring Node
Receiving Producing Operational Consuming Operational
Node Activity Activity
5AR Asset Controller
f
Rescue Node C% Search Node Place Of Safety Rescue Node % Search Node % Rescue Node % Search Node Rescue Node c% Monitoring Node % Tactical C2 NodeSend Warning Order Monitor Health
Send Distress Signal Send Distress Signal
1
Figure 2-9: Sample OV-3 Operational Resource Flow Matrix for a Search and Rescue system 125].
2.2.4
OV-4: Organizational Relationships Chart
Description
The OV-4, as the name suggests, depicts relationships among organizations and op-erators, as shown in Figure 2-10. These relationships can take many forms, and are not strictly hierarchical. Examples include customer-supplier, supervisory reporting, command and control, and collaborative relationships. Architects may define any re-lationship that is useful to understanding the architecture. Though individual billets (roles/jobs) may be included in the OV-4 to represent specific skills required, actual people are not meant to be included.
There are two variations of the OV-4: role-based, and actual. Role-based OV-4s may depict a typical organization and the relationships and roles that it would have, while actual OV-4s depict a real organization at a certain point in time. Architects may also create hybrid diagrams containing aspects of both.
The purpose of the OV-4 is to highlight the key stakeholders involved with an architecture, and the relationships they have with each other. It also serves to specify individual skills that certain operators or organizations need for the architecture to function. As with the needlines discussed in Section 2.2.2, stakeholder identification and analysis is primarily conducted in a stakeholder map.
Process Warning Order Provide Medical Assistance
Receive Distress Signal
I-System Boundary Process loperand J1Process i Even2 I Isequerl( I~ Timini I
fig '] sv (I Big INon-Hierarchcal
O0nstrumentl Only 0 rator Relationship
nstrument Operator Instrument L2 2Oeao 17 rocess --- Oeau---- Acr Operand 2 rIcess 3 mpoPtonc e Other Attr Needline 1
Figure 2-10: Depicts OV-4 Organizational Relationships Chart. As shown, the chart can include hierarchical and non-hierarchical relationships.
Samples
The information contained in the OV-4 samples examined exactly matches the DoDAF description. The only exception is that one diagram includes actual named people, in addition to the billet they fill. Otherwise, the diagrams only contain organiza-tions, operators, and the relationships among them, as shown in Figure 2-11 [36]. Most of the connections between organizations/operators are unlabeled, and their relationships are implied from their names and two-dimensional arrangement. Some lines, particularly those that do not represent command or aggregation relationships, are labeled for clarity. About a third of the diagrams label every or almost every relationship, or include a legend describing how different relationships are depicted.
2.2.5
OV-5a: Operational Activity Decomposition Tree
Description
The OV-5a simply decomposes higher level processes into more specific ones that are necessary for mission completion. Figure 2-12 depicts the information content of the OV-5a. Note that relationships among processes can be decomposition or other non-hierarchical relationships. The processes specified in the OV-5a are dubbed
8.arch / 1 CoM-- (C2)vrpn don MM 0 1 T CuResew U T ewMRHS hI
Figure 2-11: Sample OV-4 Organizational Relationships Chart for a Search and Res-cue system [361.
r
ig B INon Hieracci3 instrument Only Operator ReltionhiplBig4
Ktii
Process IAnstrument Operator
Process nstrument Operator Accomp
I2 2 Operator I _Z 1 Operand P Opea .2 d3L vent 2 I Location rnportncej i ~~Sequence/ eArI
Timinge Other Att
Needline 1
(Accompanying Process needs Operand 3)
Figure 2-12: Depicts OV-5a Operational Activity Decomposition Tree. Note that the relationships between processes can be hierarchical, as with Big Process and Processes
1 and 2, or non-hierarchical, as with Process 3 and Accompanying Process.
dard operational activities, which are activities defined in doctrine but still solution-neutral. Solution-neutral means that the activities do not limit the design space; it is the difference between "traveling to Florida" and "flying JetBlue to Florida". Operational activities in the OV-5a map to system or service functions, which are de-scribed in either the Systems or Services Viewpoints respectively. System and service functions describe the "how" to the operational activities' "what".
Samples
As demonstrated by Figure 2-13, the sample OV-5a samples show exactly what the description calls for: processes decomposed or aggregated into other processes [361. Six of the eight samples have letter/number IDs for the processes. One diagram includes the performers, in addition to the processes.
Search
And
Rescue
Search Communicate
Coordinate Plan Execute Dist
Search Search Search ignal
Locate Warning VictimOrder Monitor Health Rescue Maritime Rescue Modkeal Recover ia Victim Assist
Figure 2-13: Sample OV-5a Operational Decomposition Tree for a Search and Rescue system [36].
![Figure 1-3: Depicts a simple OPD for a sliced-bread-making system [11]. It shows the flow of operands from top to bottom, and the performer-process-operand convention from right to left.](https://thumb-eu.123doks.com/thumbv2/123doknet/14448045.518114/20.917.275.613.110.508/figure-depicts-simple-operands-performer-process-operand-convention.webp)

![Figure 2-3: Sample of a "complete" OV-1 High-Level Operational Concept Graphic for a Search and Rescue system [3]](https://thumb-eu.123doks.com/thumbv2/123doknet/14448045.518114/34.917.194.735.110.495/figure-sample-complete-operational-concept-graphic-search-rescue.webp)
![Figure 2-4: Sample of a sparse OV-1 High-Level Operational Concept Graphic for a school emergency response system [10]](https://thumb-eu.123doks.com/thumbv2/123doknet/14448045.518114/35.917.133.776.358.754/figure-sample-sparse-operational-concept-graphic-emergency-response.webp)
![Figure 2-9: Sample OV-3 Operational Resource Flow Matrix for a Search and Rescue system 125].](https://thumb-eu.123doks.com/thumbv2/123doknet/14448045.518114/41.917.136.788.110.369/figure-sample-operational-resource-flow-matrix-search-rescue.webp)
