Prof. W. A. Rosenblith Dr. J. W. Kuiper$$ G. E. Forsen
Prof. M. H. Goldstein, Jr. Dr. T. T. Sandel Mrs. Margaret Z. Freeman Dr. J. S. Barlowt W. A. Clark, Jr.""" C. D. Geisler
Dr. M. A. B. Braziert O. C. Gutierrez':. C. E. Molnar Dr. Eda Bergert Aurice V. Albert D. F. O'Brien Dr. B. G. Farley ", J. Allantft W. T. Peake Dr. G. L. GersteinT J. D. Cowan$8T R. W. Rodieck Dr. N. Y-S. Kiang A. H. Crist T. F. Weiss
RESEARCH OBJECTIVES
This group continues to study the electrical activity of the nervous system with emphasis upon a quantitative and analytical treatment of specific responses to sensory stimuli and of so-called ongoing activity. We have made increasing use of special-purpose and general-special-purpose computers to the point where most of our experiments are now designed with a view toward data reduction by means of appropriate programs. This approach has been carried farthest in the "on-line" use of ARC-1 (average response computer, ref. 1), which, without delay, provides experimenters with numerically inter-pretable displays of average evoked responses.
Use of ARC-1 and of ERD (evoked response detector, ref. 2) has permitted us to carry further the analysis of potentials evoked by flashes (3, 4) and auditory stimuli (5, 6) and, in particular, has permitted us to detect responses - presumably of cortical origin
- from the skull of awake subjects at stimulus intensities that are comparable to psycho-physical thresholds (7).
A preliminary study of the combined effects of acoustic stimulation and electric stimulation of the auditory nerve has been reported (8). Certain adaptation phenomena in the somesthetic and auditory systems have been compared (9). The relation of intrinsic alpha activity to sensory after-discharges to photic stimulation has been further investigated (10). A technical report has been published (11) which summarizes a first study in the use of a general-purpose digital computer for giving a quantitative descrip-tion of certain characteristic patterns in the electroencephalogram.
A review article (12) by Mary A. B. Brazier provides a historical perspective on the development of concepts relating to the electrical activity of the brain.
Our studies of statistical models for the description of evoked responses are being continued (13). An account of some of the earlier work has now appeared in print (14).
In psychophysical studies we have dealt with loudness judgments of clicks (15) and with reaction times to clicks delivered against a background of noise (16).
Completion of the construction of Eaton Peabody Laboratory of Auditory Physiology in the courtyard of Massachusetts Eye and Ear Infirmary has provided facilities for microelectrode studies and other physiological studies of the auditory system. Joint
experimentation by members of Massachusetts Eye and Ear Infirmary and of the Research Laboratory of Electronics is under way.
W. A. Rosenblith [See following page for references.]
This work was supported in part by the U.S. Air Force under Contract AF19(604)-4112.
tFrom the Neurophysiologi, al Laboratory of the Neurology Service of the Massa cusetts General Hospital.
Postdoctoral Fello . of the National Institute of Mental Health. Staff Member, Lincoln Labororaory, I. T.
ttPostdoctoral Fellow of the National Institute of Neurological Dieases and lindness. 1tSloan Postdoctoral Fello of tie School For Advanced StuY, . I.T.
Doherty Foundation low.
tttifamo-Wooldridge Fellow in Systems Engineering.
TIIGraduate Fellow of British labulating Machine Company Ltd.
(XXI. COMMUNICATIONS BIOPHYSICS)
References
1. W. A. Clark, Jr., Average response computer (ARC-1), Quarterly Progress Report, Research Laboratory of Electronics, M. I. T., April 15, 1958, pp. 114-117; op. cit., Oct. 15, 1958, p. 118.
2. J. S. Barlow, An electronic method for detecting evoked responses of the brain and for reproducing their average waveforms, EEG Clin. Neurophysiol. 9, 340-343 (1957).
3. M. A. B. Brazier, A study of the late response to flash in the cortex of the cat, Acta Physiol. Pharmacol. Neerlandica 6, 692-714 (1957).
4. M. A. B. Brazier, Studies of evoked responses by flash in man and cat, Reticular
Formation of the Brain, Edited by H. H. Jasper, L. D. Proctor, R. S. Knighton,
W. C. Noshay, and R. T. Costello (Little, Brown and Company, Boston, 1958),
pp. 151-176.
5. M. H. Goldstein, Jr., N. Y-S. Kiang, and R. M. Brown, Responses of the audi-tory cortex to repetitive acoustic stimuli, J. Acoust. Soc. Am. (to appear in March
1959 issue).
6. W. T. Peake, M. H. Goldstein, Jr., and N. Y-S. Kiang, "Steady-state" auditory nerve responses to bursts of noise at different repetition rates, Quarterly Progress Report, Research Laboratory of Electronics, M.I.T., Oct. 15, 1958, pp. 116-118. 7. C. D. Geisler, L. S. Frishkopf, and W. A. Rosenblith, Extracranial responses to
acoustic clicks in man, Science 128, 1210-1211 (1958).
8. N. Y-S. Kiang and W. T. Peake, Studies of the auditory nervous system by using
combined acoustic and electric stimulation, Quarterly Progress Report, Research
Laboratory of Electronics, M.I.T., Jan. 15, 1958, 124-128.
9. W. D. Keidel, Ursula O. Keidel, N. Y-S. Kiang, and L. S. Frishkopf, Time
course of adaption of evoked responses from the cat's somesthetic and auditory systems, Quarterly Progress Report, Research Laboratory of Electronics, M. I. T.,
Jan. 15, 1958, pp. 121-124.
10. J. S. Barlow, Relation of intrinsic alpha activity to rhythmic activity induced by
photic stimulation in man, Quarterly Progress Report, Research Laboratory of
Electronics, M.I.T., Jan. 15, 1958, pp. 128-133.
11. B. G. Farley, L. S. Frishkopf, W. A. Clark, Jr., and J. T. Gilmore, Jr.,
Computer techniques for the study of patterns in the electroencephalogram, Technical Report 337, Research Laboratory of Electronics, and Technical Report
165, Lincoln Laboratory, M.I.T., Nov. 6, 1957.
12. M. A. B. Brazier, The development of concepts relating to the electrical activity
of the brain, J. Nerv. and Mental Disease 126, 303-321 (1958).
13. M. H. Goldstein, Jr., Mathematical description of average evoked responses in
terms of activity of neural units, Quarterly Progress Report, Research Laboratory
of Electronics, M.I.T., April 15, 1958, pp. 112-114.
14. L. S. Frishkopf and W. A. Rosenblith, Fluctuations in neural thresholds,
Symposium on Information Theory in Biology, Edited by H. P. Yockey,
R. L. Platzman, and H. Quastler (Pergamon Press, New York, 1958), pp. 153-169.
15. C. D. Geisler, C. E. Molnar, W. T. Peake, C. A. Steinberg, and T. F. Weiss,
Judgments of the loudness of clicks, Quarterly Progress Report, Research
Laboratory of Electronics, M.I.T., July 15, 1958, pp. 177-184; op. cit., Oct. 15,
1958, p. 118.
16. W. Thompson, Jr., Human reaction time to a masked acoustic stimulus, Quarterly Progress Report, Research Laboratory of Electronics, M. I. T., July 15, 1958,
pp. 185-186.
A. DISPERSION MEASURES OF EVOKED ELECTROCORTICAL ACTIVITY
We recently programmed the TX-0 digital computer to provide a rough measure of the dispersion of the amplitude distributions seen at various fixed points in time
following presentaticn of stimuli. A measure of dispersion is of interest to us
because we feel that eventually with this information a logical reduction of the proc-esses underlying evoked cortical activity, which is not possible on the basis of measures of central tendency alone, can be made.
WRITER COMPUTER
STIMULUS
CATHODE-GENERATOR RAY
DISPLAY
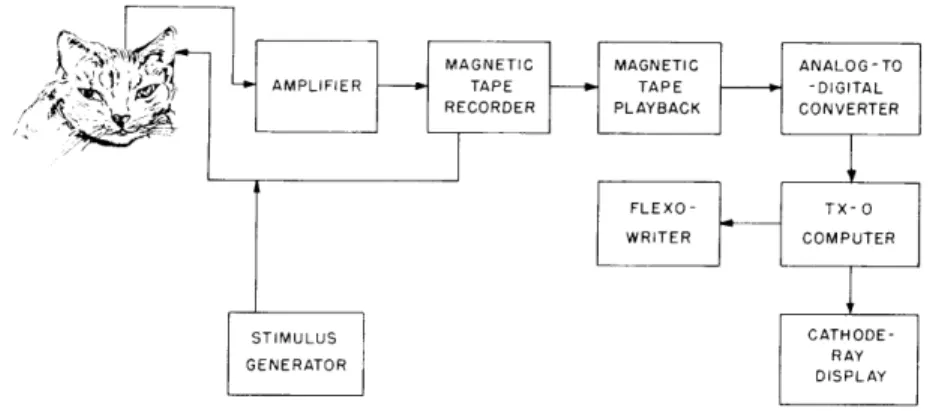
Fig. XXI- 1. Block diagram of recording and computing procedure for
TX-0 digital computer.
Figure XXI-1 is a block diagram of the system that we have employed. In
keeping with methods previously used (1, 2) the cortical signals are recorded and
played back on FM magnetic tape. An analog-to-digital converter is used to
pro-vide an adequate input to the TX-0 computer. The computer has been programmed
to calculate the median, the first and third quartiles, and the interquartile range
for 8 time intervals or "instants." Programs have been written to display the
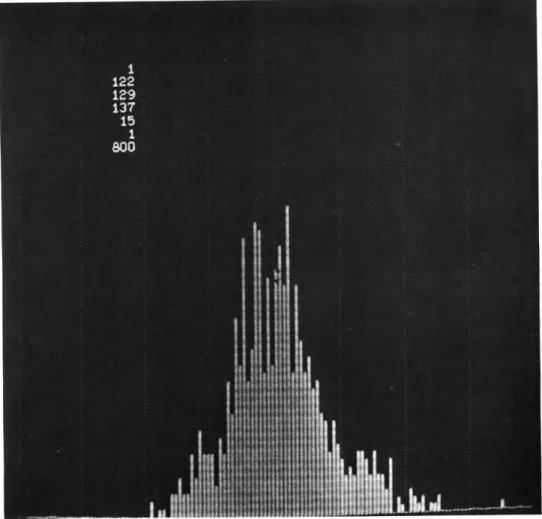
amplitude histograms on a cathode-ray tube and to print the associated numerical
values on a typewriter. Figure XXI-2 shows a typical display that was photographed
from the cathode-ray tube. The numbers in the upper left-hand corner represent,
from top to bottom: identification number; first quartile, Q1; median, Q2; third
quartile, Q3; absolute difference of Q1 and Q3; a crude measure of skewness
(2Q2 - - Q3); number of responses sampled.
When the information produced by these operations is plotted as a function of
time, a representation such as that shown in Fig. XXI-3 is produced. Here, the
points along the heavy line represent the medians of the amplitude distribution for the various instants of time following the presentation of the stimulus (T = 0). The vertical bars represent the magnitude of the interquartile ranges around the
Fig. XXI-2. Amplitude histogram on TX-O cathode-ray tube display. c z 00 -20 S20 0-496,SECTION AT 02 T-134,E-F,1-7
S30 - STIMULUS : 2900~ TONE BURST
S ' +40DB RE THRESHOLD
S....150MSEC DURATION
z 40
0 RESPONSE : MEDIAN,Q, AND 03
800B RESPONSES
50 _TIME INTERVAL 1.125MSEC
0 50 100
TIME (MILLISECONDS)
Fig. XXI-3. Medians and interquartile ranges as functions of time.
156
j
--C-496, SECTION AT C2
T-134, E-F,I-7
STIMULUS: 2900- TONE BURST +40DB RE THRESHOLD
150 MSEC DURATION
RESPONSE: INTERQUARTILE RANGE
800 RESPONSES
40 TIME INTERVAL 1125 MSEC
LU 7 J 30 j a_20 -mo , O 50 100 TIME (MILLISECONDS)
Fig. XXI-4. Absolute magnitude of interquartile range as a function of time.
corresponding medians. Figure XXI-4 shows the interquartile ranges plotted as magnitudes.
Figures XXI-3 and XXI-4 suggest that although the median of the late activity of evoked responses returns to values quite close to zero, the variability remains rela-tively high. This leads to the tentative conclusion that in some way a representa-tion of a signal persists beyond the initial deflecrepresenta-tion that is ordinarily identified as the "early" or "late" components of evoked-response activity.
This conclusion gives us reason to believe that further study of measures of dis-persion is pertinent to our investigations. We anticipate writing more elaborate programs for computing other possibly meaningful statistics of the process.
T. T. Sandel, T. F. Weiss, C. E. Molnar, G. L. Gerstein
References
1. J. S. Barlow and R. M. Brown, An analog correlator system for brain potentials,
Technical Report 300, Research Laboratory of Electronics, M. I. T., July 14, 1955.
2. W. A. Clark, Jr., Average response computer (ARC-I), Quarterly Progress Report,
Research Laboratory of Electronics, M.I. T., April 15, 1958, pp. 114-117; op. cit.,
Oct. 15, 1958, p. 118.
B. RESPONSE OF AN IDEALIZED NEURAL POPULATION TO A TRAIN OF
REPETITIVE STIMULI
Electrophysiological responses to repetitive stimuli are of interest in studies of
sensory systems in which such stimuli correspond in some ways to "natural" stimuli,
(XXI. COMMUNICATIONS BIOPHYSICS)
and as a means of studying the dynamical properties of the neural elements contributing to the responses. Here we shall consider a very simple statistical model of a population of "neural units." It is a zero-interaction model in which the dynamical properties of the units are described by a single random variable. The response is taken as the summated activity of the units of the population. The postulates defining the mathemat-ical model are:
I. A population is composed of N statistically homogeneous units that have no mutual interaction.
II. At the presentation of a stimulus, each unit of the population either "fires" or "does not fire." Units do not fire spontaneously.
III. Recovery time, , is the time interval required before a unit which has fired will be refired by a stimulus of given intensity. Recovery time for any unit is not a constant but is a random variable described by a probability density function. Since the units are statistically homogeneous, recovery time of each unit is described by the same probability density function. The random variable, , is a function of stimulus inten-sity.
IV. The response, nk , of the population to the kt h stimulus in a train is equal to the number of units that fire when this stimulus is presented. The relative response to the kth stimulus is nk/N.
In the postulated model there is no explicit consideration of a neural threshold. The fluctuating threshold of a unit and the recovery of responsiveness following the time when a unit fires are both represented in the random variable
a.
We shall derive the relationship between the statistical average of the responses of a neural population to a train of repetitive stimuli and the probability density of recovery time. The averages would be obtained experimentally by presenting the train of stimuli to the preparation many times and averaging the responses to the first stimulus in the train to obtain E(no), the responses to the second stimulus to obtain E(nl), and so forth. The relationship of these average responses to the probability density of
a
takes the form of difference equations, the solutions of which are the sum of two parts: a tran-sient part, and a steady-state part. We shall consider both parts.Assume that the population is excited by a train of stimuli occurring at times 0, T, 2T, ... , kT, .... Call the responses of the population to these stimuli no , n1, n2 . . .. . nk' '....
The expectation of nk+1 can be expressed by
N
E(nk+) = P(nk+1) • nk+l (1)
nk+l= 1
in which P(nk+l) is the probability distribution of nk+l. It follows that
N N E(nk+l) P(nk+ Ink) P(nk) nk+l nk+l= 1 nk= 1 N Z E(nk+l Ink) P(nk) (2) nk= 1
We shall consider the case in which the probability density function of the recovery time
a
is zero fora
greater than 2T. Then2T
p( ) d = 1
o
(3)p() = 0 > 2T
where T is the time between the stimuli of the train. Call T
Tp(a) dg = P1 (4)
which gives the probability that a unit recovers in a time less than T. Consider the response at the time (k+l) T. If we know that nk units fire at time kT, then from Eqs. 3 we know that the remaining N - nk units will fire at time (k+l) T. On the aver-age, P1 * nk units will also refire at time (k+l) T. Thus
E(nk+1 Ink) = N - nk + Pink
= N - nk(1- P) (5)
Therefore
N
E(nk+l) = P(n k ) [N- nk(1-Pl (6)
nk= 1
and it follows that
E(nk+l) + (l-P 1) E(nk) = N (7)
The solution (1) of this difference equation with the condition that E(no) = N (i. e.,
all units fire in response to the first stimulus) is
E(nk) P (- 1)k (1 -Pk+l + 1 (8)
The mean relative response,
(XXI. COMMUNICATIONS BIOPHYSICS)
E() 1 [()k (1-P )k+1 +1 (9)
is independent of N.
If instead of the condition of Eqs. 3 the probability density function
S
p( ) dg = 1 (10)0
p() = 0 > 3T (11)
with the notation
T p(a) d = P1
2T
0 T p( ) d = P 2
By a similar procedure, we obtain the difference equation
E(nk+2) + (1-P 1) E(nk+l) + (1-P 2) E(nk) = N (12)
The roots of the homogeneous solution may be real, equal, or complex, as deter-mined by whether
(2P ) =(1-P 2) (13)
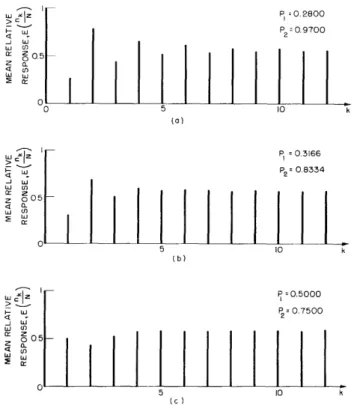
In Fig. XXI-5 an example of the solution of Eq. 12 with the initial condition E(no) = N is presented for each of the three conditions of Eq. 13. The parameters have
been chosen so that the three examples have identical steady-state behavior.
Following the same procedure, we can derive the difference equation for the mean response in the general case in which
p() = 0
(
> RTRT (14)
p( ) dg = 1
The resulting expression is R-2
E(nk+R- 1 ) + E(nk+m) (1-PR-1-m) = N (15)
m=0 where
0sT p() d = P s 1 Z,... R- 1
The steady-state solution of this general case has the form
N (16)
E(nkss R-I
R- X P m=l
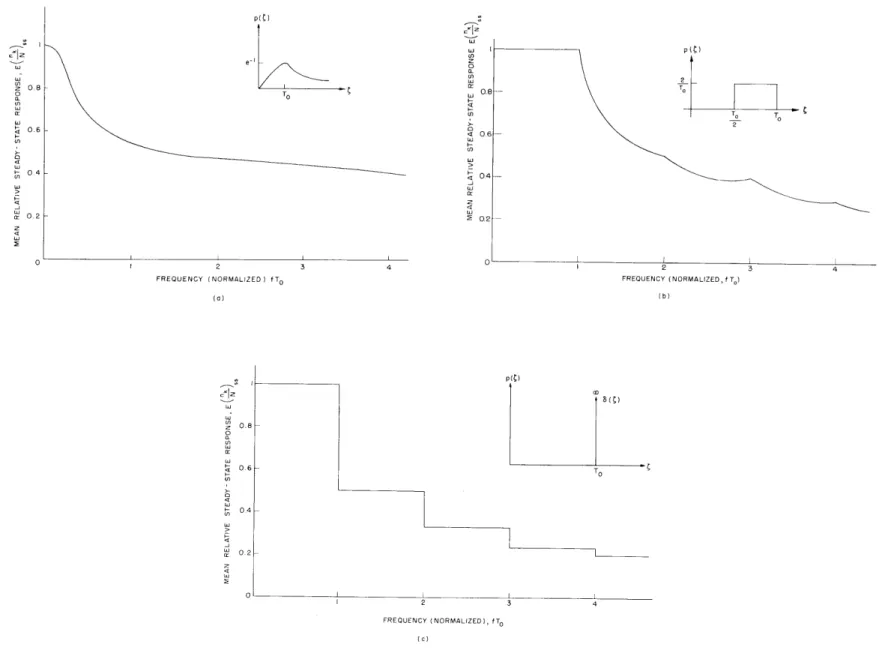
The relative steady-state response is plotted against frequency for three different p( ) in Fig. XXI-6. Note that a continuous p(g) (Fig. XXI-6a) leads to a continuous decrease in response as a function of frequency; a sharply truncated p( ) (Fig. XXI-6b) corresponds to a "scalloped" function; and the limiting case, in which recovery time has some given value To (with a probability of 1) corresponds to the staircase function
(Fig. XXI-6c). The third case would result if the response of a neural population to repetitive stimuli were viewed in the light of the simplest interpretation of the Wever volley principle (2).
Further theoretical work will include investigation of statistics other than the expectation.
The present work is in some respects an extension of the model discussed by
1 P, 0O 2800 P2 0. 9700 jw W 0 0 5 10 k (o) ,- .3I66 4 IP 2 0.8334 005-W U0 5 10 (b) ,[-P, =o0.5000 0. (c)
Fig. XXI-5. Mean relative response to a train of stimuli for three conditions.
5 o a w It 0.8 0.6 LLJ 04 2 0,2 FREQUENCY (NORMALIZED) fT0 (o ) LU1 S0.8 o S06 LU S04 0 W 02 3 -P -2 To T O 2 3 4 FREQUENCY (NORMALIZED, f T) (b) FREQUENCY (NORMALIZED), fT0
Fig. XXI-6. Mean relative steady-state response versus normalized frequency for three p( ).
m w 0.8 o a_ 0 'W O 0.6 04 d 2 02 w~ I
Frishkopf and Rosenblith (3). A treatment of steady-state responses similar to ours was derived independently by David (4).
R. W. Rodieck, M. H. Goldstein, Jr. References
1. F. B. Hildebrand, Methods of Applied Mathematics (Prentice-Hall, Inc., New York,
1952), pp. 227-249.
2. E. G. Wever, Theory of Hearing (John Wiley and Sons, Inc., New York, 1949).
3. L. S. Frishkopf and W. A. Rosenblith, Fluctuations in neural thresholds, Symposium
on Information Theory in Biology (Pergamon Press, New York, 1958), pp. 153-168.
4. E. E. David, Jr. (private communication), July 23, 1958.
C. AN INVESTIGATION OF THE FINITE-TIME SAMPLE AUTOCORRELATION
FUNCTION OF THE EEG
(This report is an abstract from a forthcoming thesis for the degree of Master of Science, Department of Electrical Engineering, M. I. T.)
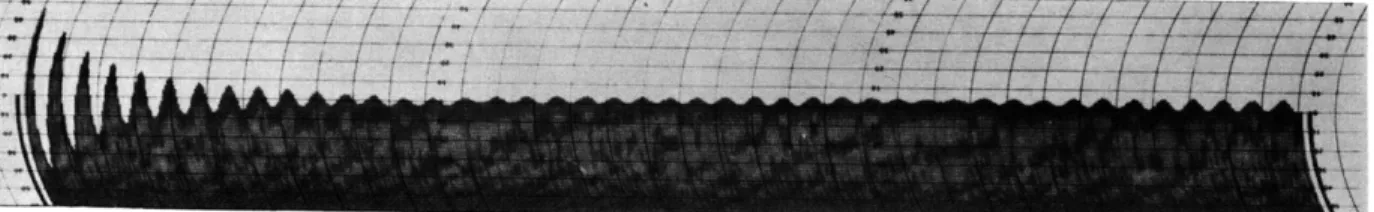
The autocorrelogram (machine-computed estimate of an autocorrelation function) of the electroencephalogram (EEG) of many human subjects has been known to show a considerable amount of cyclic activity at large values of delay (see Fig. XXI-7). There has been some conjecture concerning the physiological significance of this apparent marked in-phaseness in the EEG when it exhibits the 10-cps alpha rhythm. The present investigation attempts to demonstrate that this type of cyclic behavior may be explained by the finite length of the time sample used for computing the autocorrelation function.
In general, the autocorrelation function of a stationary, random time series is defined as
T
1
x(T) = lim 2T x(t) x(t-T) dt (1)
T--co -T
By machine computation methods (1) an estimate of this function can be obtained by computing the function
T
1
x(T, T) - - x(t) x(t-T) dt (2)
0
This finite-time sample autocorrelation function is, itself, a random variable
with parameters T and T. Thus far, the problem of finding the probability defisity
function of this random variable has not been solved (2). Davenport (3) and others
have, however, given the following expressions for the mean and second moment
(XXI. COMMUNICATIONS BIOPHYSICS)
Fig. XXI-7. Correlogram of EEG of a "resting" subject (left parieto-occipital used). Sample length, 3 minutes; maximum delay, 4.6 sec; delay increment, 6.25 msec.
of the finite-time sample autocorrelation function:
E[Px(T, T)] = Q(T) (3)
T
E [cxt(T, T) = 1 -0 )E[x(t) x(t-T) x(t - T) x(t - T - To)] dTr (4)
Equation 4 shows that the fourth-order moment of the random variable xt must be known in order to estimate a measure of the errors of a finite observation time on the autocorrelation function of xt. It can be shown, however, that x(T, T) converges in the
mean to cx(T) as T approaches infinity (4).
For the particular, and very interesting, case of a Gaussian random variable with zero mean, the fourth-order expectation factors and the variance can be shown to be
T
S(T,T) = (T- 2 (Tx + x +o) xo(T-T) dTo (5)
Now consider the case in which x (T) is a narrow-band, quadratic function such as
(T) = e-a I cos T (6)
where Za is the bandwidth, and w the central frequency. For a value of T that is large compared with the maximum value of 7, and for a value of T that is large compared with
1
a, the variance can be shown to approximate
2 1
ZaT (7)
Similar results were derived independently by Bendat (5).
Equation 7 indicates that for values of delay that are large compared with the time
164
I _
-(XXI. COMMUNICATIONS BIOPHYSICS)
Fig. XXI-8. Correlogram of narrow-band, Gaussian noise (central frequency, 237 cps; bandwidth, 13.2 cps). Sample length, 7.5 sec; maximum delay, 185 msec; delay increment, 0.25 msec.
constant of the autocorrelation functions, the ratio of "signal" (autocorrelation function) to "noise" (variance of the finite-time sample autocorrelation function) is very low. Con-sider the form of the finite-time sample autocorrelation function for large values of delay. Figure XXI-8 shows this function computed for narrow-band, Gaussian noise. Note the recurrence of the cyclic activity at large values of delay for which the theoret-ical autocorrelation function is essentially zero. Figure XXI-8 suggests that successive samples of the finite-time sample autocorrelation function for large delay are correlated, whereas the samples of the theoretical autocorrelation function are uncorrelated for large delay. Consider the correlation of two samples of the finite-time sample autocor-relation function separated by an interval of delay T'
4 = E[ x(T, T) x(T + T', T)] (8)
The random process xt is again assumed to be a narrow-band, Gaussian noise with
zero mean, and T is assumed to be large enough so that xt and xtT can be assumed to
be statistically independent. After some manipulations, Eq. 8 can be shown to approx-imate
1 -aT'
2aT e cos w T' for T' > 0 (9)
which means that the errors attributable to the finite time of observation of x() give rise to cyclic activity in the finite-time sample autocorrelation function, as has been shown experimentally. Further experimental work has been done to confirm the fact that the cyclic activity at large delays decreases as the sample length is increased. If statistically independent samples of noise are used for the computation of each point in the correlogram, then the cyclic activity at large values of delay is replaced by random activity, as shown in Fig. XXI-9.
It has been shown, therefore, that the long-delay cyclic activity of the finite-time sample autocorrelation function of narrow-band, Gaussian noise results from the errors
Fig. XXI-9. Correlogram of narrow-band, Gaussian noise (central frequency, 237 cps; bandwidth, 13. 2 cps) computed from statistically independent samples for each point of delay. Sample length, 7.5 sec; maximum delay, 90 msec; delay increment, 0.25 msec.
1S
o.i0 . .l 1 2 1 .o % WmAj S, N m .so I . . . ., ... LIOArTI VI % I S C&.A ICAS IRnMA.
Fig. XXI- 10.
Fig. XXI-11.
Cumulative histogram of EEG of a "resting" subject plotted on probability paper (50, 000 samples).
Correlograms of EEG of a "resting" subject for two values of sample length of EEG (left parieto-occipital used). Sample length (top), 100 sec, (bottom), 400 sec; maximum delay, 4. 6 sec; delay increment, 6. 25 msec.
166 _ _
~O1*
Ml~lII )Ira 7Dr IIn i 1 lI.~nr
MOM nly PA PE L -4-,:I: -44" EVER-- EVER--~ -- --. ... -i L 2 WO"'~
__ __
_ _ ~
~
--
c~
__
__~_~_
caused by the finite-time sample.
The implications of these results on the problem of estimating the autocorrelation
function of the EEG are not entirely clear. Certainly, the EEG's of many subjects in
the "relaxed state" exhibit alpha activity which results in correlograms that resemble
those of the narrow-band noise signal (witness Figs. XXI-7 and XXI-8). Preliminary
tests on the histogram of amplitudes of the EEG of a few subjects indicate that a Gaussian distribution can be fitted reasonably well to the central part of the curve. Figure XXI-10 shows one such histogram plotted on probability paper, which plots Gauss-ian distributions as straight lines. However, the narrow-band noise model is a stationary model, and it has been shown that some statistics (6) of the EEG of a subject deprived of
auditory and visual stimulation decrease with time (7). Thus all of the statistics of the
EEG computed here must be considered as time-average statistics, and the narrow-band noise model must be interpreted as being a model of these time-average statistics.
For a sample from a single subject whose EEG shows little time dependence in its
statistics, our model has been verified. Figure XXI-11 shows the autocorrelograms of
this subject for sample lengths of 100 and 400 seconds. Note the decrease of the
ampli-tude of the long-delay cyclic activity, which indicates strongly that this cyclic activity
is a result of the finite length of the sample of EEG processed. An estimate of the
root-mean-square values of the long-delay cyclic activity for the two correlograms yields a ratio of 2. 2, as opposed to a predicted value of 2.
T. F. Weiss References
1. J. S. Barlow and R. M. Brown, An analog correlator system for brain potentials,
Technical Report 300, Research Laboratory of Electronics, M. I. T., July 14, 1955.
2. D. G. Lampard, The probability distribution for the filtered output of a multiplier
whose inputs are correlated, stationary, Gaussian time series, Trans. IRE, vol. IT-1, pp. 4-11 (1956).
3. W. B. Davenport, Jr., Correlator errors due to finite observation intervals,
Tech-nical Report 191, Research Laboratory of Electronics, M.I.T., March 8, 1951.
4. W. B. Davenport, Jr. and W. L. Root, An Introduction to the Theory of Random
Signals and Noise (McGraw-Hill Publishing Company, Inc., New York, 1958).
5. J. S. Bendat, Principles and Applications of Random Noise Theory (John Wiley and
Sons, Inc., New York, 1958).
6. B. G. Farley, L. S. Frishkopf, W. A. Clark, and J. T. Gilmore, Computer
tech-niques for the study of patterns in the electroencephalogram, Technical Report 337, Research Laboratory of Electronics, M.I. T., Nov. 6, 1957.
7. M. Z. Freeman, C. E. Molnar, and T. F. Weiss (unpublished work).