Publisher’s version / Version de l'éditeur:
Vous avez des questions? Nous pouvons vous aider. Pour communiquer directement avec un auteur, consultez la première page de la revue dans laquelle son article a été publié afin de trouver ses coordonnées. Si vous n’arrivez pas à les repérer, communiquez avec nous à [email protected].
Questions? Contact the NRC Publications Archive team at
[email protected]. If you wish to email the authors directly, please see the first page of the publication for their contact information.
https://publications-cnrc.canada.ca/fra/droits
L’accès à ce site Web et l’utilisation de son contenu sont assujettis aux conditions présentées dans le site LISEZ CES CONDITIONS ATTENTIVEMENT AVANT D’UTILISER CE SITE WEB.
Internal Report (National Research Council of Canada. Division of Building
Research), 1972-11-01
READ THESE TERMS AND CONDITIONS CAREFULLY BEFORE USING THIS WEBSITE.
https://nrc-publications.canada.ca/eng/copyright
NRC Publications Archive Record / Notice des Archives des publications du CNRC :
https://nrc-publications.canada.ca/eng/view/object/?id=8f7241a6-3d11-4bd5-bd50-43924b4a64c9 https://publications-cnrc.canada.ca/fra/voir/objet/?id=8f7241a6-3d11-4bd5-bd50-43924b4a64c9
NRC Publications Archive
Archives des publications du CNRC
For the publisher’s version, please access the DOI link below./ Pour consulter la version de l’éditeur, utilisez le lien DOI ci-dessous.
https://doi.org/10.4224/20359099
Access and use of this website and the material on it are subject to the Terms and Conditions set forth at
Acoustic survey of an open-plan landscaped office
DIVISION OF BUILDING RESEARCH
ACOUSTIC SURVEY OF AN OPEN-PLAN LANDSCAPED OFFICE
by
A. C. C. Warnock, D. N. Henning, and T. D. Northwood
Internal Report No. 400 of the
Division of Building Research
OTTAWA November 1972
)
ACOUSTIC SURVEY OF AN OPEN -PLAN LANDSCAPED OFFICE
by
A.C.C. Warnock, D.N. Henning, and T.D. Northwood
PREFACE
The Department of Public Works, Capital Region, cornrni e s ioried an acoustical study of the new landscaped office ac cornrnodat'ion of the
Ministry of Transport, Tower "C", Place de Ville, Ottawa. The office staff taking part in the expe r irne nt included both professional and clerical
workers. They had been previously ac comrn od ated in older buildings with cellular type offices each containing as rn arry as four workers.
The study was carried out in three parts each part analyzing an area of intere st.
a) A subjective a s se s sment of the ITlasking sound installation by the occupants was obtained by exposing therri to two different sound spectra each day and polling t hern for their opinions. b] A direct rne a su r ern.errt of the effectiveness of a rn a sking
sound sy stern in iITlproving speech privacy conditions was rriade by rn e an s of subjective articulation tests. These subjective rn e a su r ernent s were cornpa r e d with objective e stirna.te s derived f'r om physical rne a su r erne nt s ,
c) Objective rn e a au r errre nt s of sound propagation in the land-scaped office environment were rn ade and the efficacy of several e Iernent s used to decrease sound propagation was assessed.
LANDSCAPED OFFICE
by
A. C. C. Warnock, D. N. Henning, and T. D. Northwood
In the last few years the open-plan office has be corrie increasingly popular (1 to 3). There are undoubtedly significant advantages in this use of open space, but such offices often have acoustical pr ob lern s and psychological studies have seldom. investigated the acceptability of the acoustical environm.ent. The survey now reported was undertaken to exam.ine these p r oblern s in an actual situation by evaluating the acoustics of the space.
A landscaped office usually include s a large work area (recom.-m.ended absolute rniriirnurn 4000 sq ft) fitted with a carpet, an
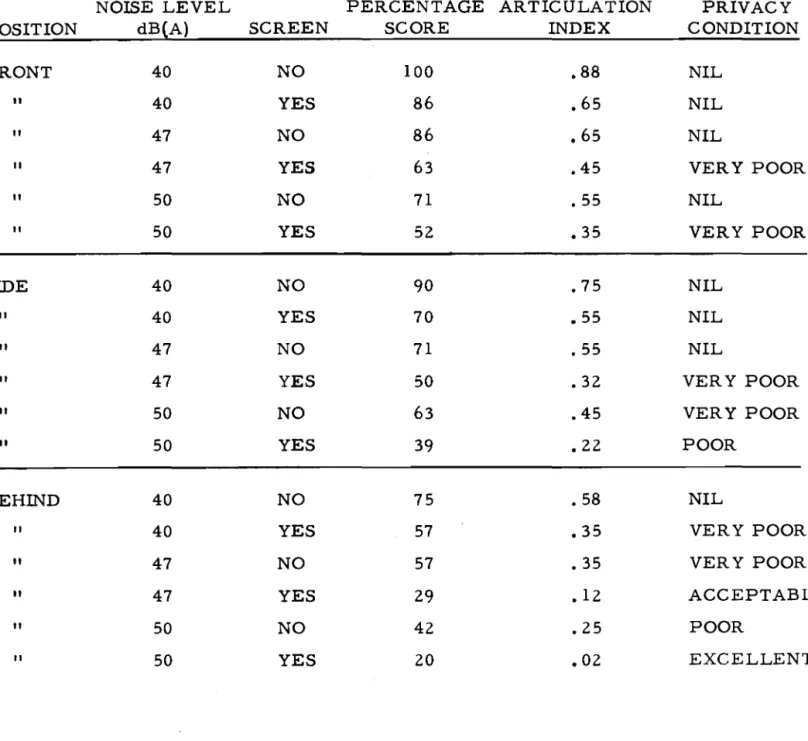
acoustic ceiling, air conditioning, uniform. glare -free lighting and m.odern functional furniture. Sound-absorbing, free-standing screens, plants, objets d'art, as well as the use of colour, texture and various planning approaches provide the necessary visual privacy and add variety and interest for the occupants. Figure 1 gives the general plan of part of the space under study. Induction units installed around three sides of the office for heating and cooling, com.plicated the
acoustic tests to som.e degree, as will be explained.
In such an open space conversation and other noises rnay propa-gate freely over large areas and still rem.ain intelligible and distracting. The provision of sound-absorbing flooring, ceiling and furniture is
therefore a reasonable m e an s of reducing sound propagation and partially alleviating the pr oblern, Such me a sur e s , however, do not provide full acoustical privacy. Confidential conversations m.ay still be overheard at adjacent work positions. Careful arrangem.ent of
furniture, spacing of occupants and use of acoustical screens can help(4). but it has be c orne alrn o st standard procedure to install an electronic m.asking noise sy s'tern , An array of loudspeakers is placed out of sight in the plenum. above the ceiling. A noise generator and filters provide noise with a spectrum. shape chosen, to a large extent, by the supplier of the sy stern , The noise signal is fed into the
loud-speakers and a relatively uniform sound field established in the plenum and in the room below. It is the purpose of this system to raise the background noise level by an amount sufficient to mask the intelligi-bility of speech from nearby work positions without causing undue dissatisfaction am ong the office per sonnel because of the increased sound level.
2-An array of ceiling baffles m.ay also be used to reduce sound
t r an srn.i s s i on , These are intended to increase the effective absorption of the acoustical ceiling, and, by breaking up the plane surface, to interfere with specular reflections from. the ceiling to neighbouring workplaces.
The pre sent study has exam.ined the acoustic environm.ent of a typical landscaped office to determ.ine the following:
subjective preferences in level and spectrum. shape of m.asking noise;
effectiveness of various m.asking noise conditions in m.asking speech;
effect of proposed ceiling baffle configuration on sound transm.ission and speech privacy;
sound propagation characteristics of the space; effectiveness of the acoustic screens.
The experim.ents perform.ed are described in the following sections.
SUBJECTIVE REACTION TO MASKING NOISE
As introduction, the potential benefits of a m.asking noise system. were explained to the participants and their as sistance was sought in determ.ining optim.um. working conditions (Appendix A). The subjects were therefore aware that m.asking techniques were in use and, although exact details were withheld, they were under the im.pression that the m.asking system. was functioning at all t irne s ,
Four different spectra were used at three pos sible sound levels In addition to the existing noise from. the air conditioning
sy stern , Spectra are de signated as follows: 1. 3dBj octave reduction with frequency
2. 5dBJ octave II II II
3. 7dB/ octave " " "
4. sim.ilar to No. 3 but reduced high and low frequencie s , These de scriptions are only appr oxirnate and the m.easured spectral distributions are shown in Figure 2 (a to d). For com.parison a spectrum. shape recently recom.m.ended by Beranek and others (5) is shown in Figure Ze ,
Sound levels are designated as follows: A-5ldB{A); B-48dB(A); C -45dB(A). Thus, B2 denotes -5dBj octave and a weighted over -all level of 48dB(A). The test schedule is shown in Table I.
For a period of two and one half weeks the occupants were exposed daily to two background noise conditions, one in the
morning and one in the afternoon. The change -over took place at lunch time when the space was vacated. Each day a questionnaire (Figure 3) was completed and collected in the late afternoon. The subjects stated their preference for either the morning or afternoon condition and provision was made for additional comments. This series of tests was followed by a two-week study in which each con-dition remained constant for one week. A one-day test was then conducted with the air -conditioning diffuser s turned off; a low-level uniform sound field was then created. The opinions of the occupants on these last two tests were obtained during an interview held one day later. Finally, when the formal study had been completed, one further unannounced experiment was made.
Details of the subject group and their work functions are set out in Table II. Of the 40 people who worked in the office some were on outside duty most of the time, so that about 30 people answered the questionnaire on a regular basis. The number of cards returned each day varied from 22 to 35, with an average of 28 cards.
Occupantsl Comments
Generally, the occupants disliked the background noise system and preferred the ambient condition. Of the 124 comments received, 81 per cent indicated negative reaction to the noise or relief when the
system was turned off. There was almost no statement that could be interpreted as favourable to the noise system.
Some of the comments follow:
I} "Noise is still too loud for comfort of co ness to efficient work" (5ldB(A)}.
ncentration and
conducive-2) "This afternoon is not tiring to hear" (N afternoon).
o artifical noise in the
3) "Turn it off" (5ldB(A)).
4) "Noise bothers melt {45dB(A}}.
5) "When artificial sound system was turne total relaxation felt throughout my body and annoying all morning" (48dB(A)}.
d --off at 12: 30 a system was t sense of oo loud
-4-6) "The noise continues - - but to a lesser degree than some days. The noise level still remains too high and is unacceptable to me, and it does not contribute to ideal working conditions. Read the October 1971 issue of the Readers Digest -- page 120 "I am J oer s Ear" and do not subject us to any more noise please" (45dB(A) and 48dB(A)).
In many cases a choice for uno preference" was qualified by a sugge stion that both conditions were unde sir able. The choise of "slightly prefer morning" probably means "this afternoon seems especially bad so the morning must have been a bit better". The choice of "slightly prefer afternoon" probably means "it does not seem quite so bad as usual this afte r noon ";
SOUND LEVEL PREFERENCE
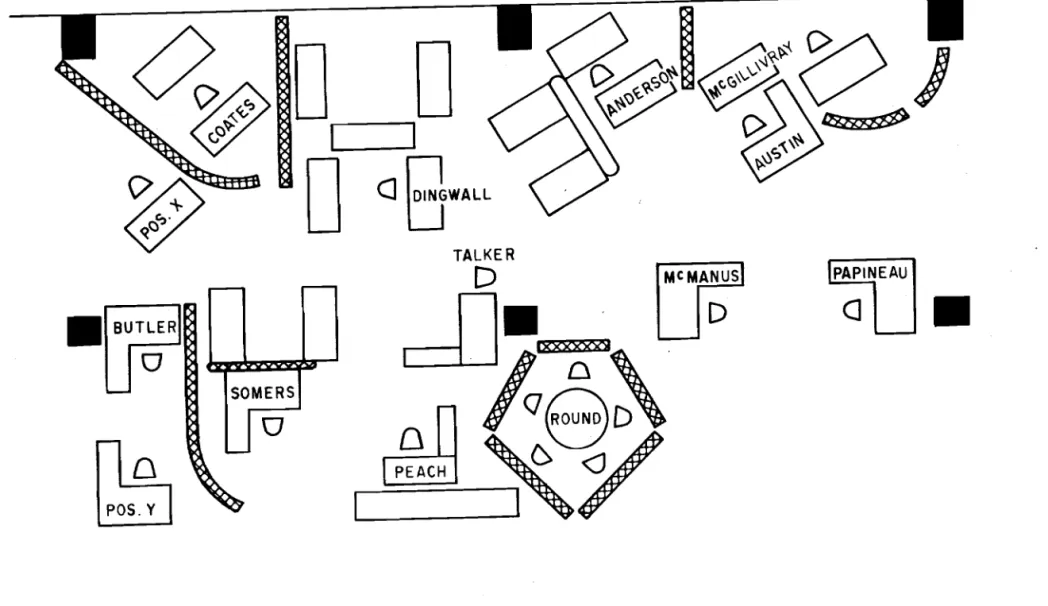
There was a consistent preference for lower sound levels. In
considering all the half-day comparisons of sound levels, 59 per cent preferred the lower level, 30 per cent gave no preference, and 11 per cent preferred the higher level. As the difference between sound levels increased, so did the strength of preference. Eighty-five per cent of the returns favoured ambient over 5ldB(A); 48 per cent favoured ambient over 48dB(A). The detailed results are shown in Figures 4 to 8. Figure 9 shows the mean for all sound level
comparisons.
Many occupants were unable to remember much about the weeks of 1 November and 8 November. The results in Figure lOa exclude 13 who could not remember and one who preferred the quieter week but could not remember which it was. If the 14 excluded are included as no-preference votes, the results change to those shown in Figure lOb. SOUND SPECTRUM PREFERENCE
Although the results show only slight preferences in some cases, the wide range of responses to similar conditions makes any con-clusion very tentative. At 48dB(A), 5dBJ octave is preferred to
7dBJ octave. At 45dB(A} and 5ldB(A), 7dB/ octave is preferred to 5dBJ octave. There was no preference between 3dBJ octave and
5dB/ octave at 45dB(A). The detailed results are shown in Figures 11 to 14.
PHYSICAL MEASUREMENTS OF MASKING SPECTRA
Masking spectra 1, 2, and 4 were generated using a Bruel
& Kj ae r noise generator and multifilter. Spectrum 3 was that set up by the supplier of the sound masking system. The spectra were
-5-adjusted and measured at the approximate centre of the te st space and at a height of about 4 ft (see Figure I for test area layout). The signal from a l v in , B & K condenser microphone was passed through a microphone amplifier into a General Radio real-time analyser. The spectra so obtained are shown in Figure s 2 (a) to (e). One unfortunate feature of the study space was the pre sence of fairly noisy induction heating units around the three perimeter window walls. The noise from them created a gradient in the ambient background level. the sound level being highe st. about 4 7dB(A). at the windows and dropping toward the core wall by as much as 7dB(A). Although this disturbing effect was present. however. it did not seriously alter the shape of the masking noise spectra except for a few Cases where the high frequency components were slightly increased.
PROXIM.ITY TO DIFFUSERS
In investigating the possible influence of diffuser noise the subjects were considered in two groups:
those located at the building perimeter; and those located in the central core area.
This division not only separted the subjects close to the noise
generated by the air-conditioning diffusers from those further away but also separated senior personnel from lower ranks. In all but two Cases. one of which ocurred on the first day. the response from the perimeter group Was similar to that from the group in the central part of the building. People located at the perimeter were not so strong in their opinions, but because the number of returns from the perimeter group Was often quite low this conclusion is tentative.
Unannounced Experiment
When people are aware that a rr.. asking system is pre sent in an open office there is a tendency for some individuals to attribute various ailments to the effects of the noise. for example. headaches, nervous tension. inability to sleep. ringing ears. As the levels in use are not in the least harmful. it is apparent that the noise is a target for emotional and psychological discontent. It is generally
advised. therefore, that the presence of a masking sound system not be announced. In inve stigating this aspect of open office planning, a further clande stine experiment Was carried out. At the completion of the initial phase of the experiment the staff were informed that in view of their rejection of masking sound they would not be subjected
-6-to it any longer. Four rn orrth s later the rna sking noise was turned on at night at about 1
1/z
dB(A) above the arnb ie nt level in the middle of the office. At intervals of a pp roxdrnat e Iy one week thesound was increased in steps of 1 l/Z dB{A). A rn ernbe r of the office staff was aware of this experiInent and rn onito r ed office conversations for s orne evidence of awareness of the noise. There was no staff reaction until the level at the rnid -point of the office reached 47dB(A), when sorne c orrrpla'int s were rnade ,
During the period when the sound was off, no cornpla int s about lack of privacy were rnade , This, together with the second
rejection of m a sking noise, very strongly suggests that this partic-ular group does not need privacy and that rna sking noise is a rn o st unwe lcorne intrusion.
CONCLUSIONS
This section of the survey m ight be described as a partial failure ina smu ch as no preferred spe ct rurn choise was det.e rrrrined , It was not without value, however, because several irnport ant points emerged:
The original high levels [5ldB{A) ] set by the supplier prior to occupation of the space and used in the early parts of the test provoked surprisingly hostile reactions and this unpleasant pre l irrrina.ry experience rn ay have disposed the subjects to view the whole idea in a negative
way. The result of the unannounced expe r iment , however, tends to indicate that the rejection is genuine. Although the comrne nt s and reactions became less ext r erne as time went on, they r ernarned negative. The reasons for this consistently negative attitude be c am.e slightly clearer during the interviews at the end of the
survey. From their comments, the people in the area apparently felt no great need for acoustic privacy and did not, therefore, require any masking.
The e xpe r irne nt a l result for 18 Novernbe r when the induction units were turned off seems to be a definite rejection of noise, although it was only set at 45dB(A) which is less than the induction unit noise in rn o st cases and theoretically less obtrusive in character.
It should be erripha s i sed that a cornpl.etely different result can be obtained where the need for privacy exists. A srnaIl scale e.xpe r irne nt (6) in another open office situation where the staff had a high speech privacy r equi r erne nt resulted in unequivocal acceptance of a m a sking sy stern operated at 48dB(A) with a spe ct rum shape similar to Spe ct rurn Z. It is therefore imperative that privacy requirements be evaluated at an early stage of planning so that the need for sound masking can be estimated.
If privacy requirements are sufficiently stringent, it rnay be advisable to reject open planning and to use a cellular type of
st r u ction , As this experiment shows, however, the need for speech privacy is often not so great as was initially believed.
The twoweek experiment seems to indicate that 48dB(A) is not too intrusive; many people were unaware of it. (The un-announced experiment points to a lower acceptable value of about 46dB(A), which could be used to irnpr ove speech privacy without irritating staff.
Experiments elsewhere (7) have shown that the maximum advisable masking level is .about 48dB(A). When asked to speak at a normal level against varying background noise levels, people begin to raise their voices when the background noise exceeds NC 40, which corresponds to about 48dB{A). Apparently, it is at this level that the noise begins to be intrusive. Further increase s in masking level are not so effective as might be expected because of the rise in voice level and because higher levels tend to cause some dis satisfaction •.
It is concluded that if a masking system is deemed necessary it should not be operated above 48dB(A) and that staff should not be informed of its existence.
MEASUREMENT OF INTELLIGIBILITY OF SPEECH
To estimate the effectiveness of different masking spectra it is possible to make calculations based on assumptions about voice spectra and ambient noise levels (8). These procedures were
developed, however, for a different purpose: the evaluation of speech communication systems. It was considered desirable in the present application to compare the results of such calculations with direct subjective articulation measurements, utilizing a test crew listening to and trying to identify a list of selected words. The test chosen was that described by Griffiths (9). It requires no subject training, has no learning effects, and the scoring is quite straightforward. Calculation of Articulation Index
Thirteen te st positions were chosen (Figure 1) and the articulation index in each was calculated as follows:
1) The noise level in each te st position was measured in dB(A) for each masking condition.
2) The ideal speech spectrum (8) in Figure 15 was used to calculate articulation index (AI) as a function of signalto-noise ratio (SiN) for all the spectra used (Figure s 16 a, b). The long term rms value of ideal speech was taken as 65dB.
セセ MセMN⦅セMセセセセセMMMMMGMMセセセセセセセMMMMMMMMMMMMMMMMNL[NLN
8-3} Using the values of signal attenuation obtained in the second series of propagation measurements (Section IV), the signal level in each test position was determined. 4) The information obtained in steps (1) and (3) gives a value
of
siN
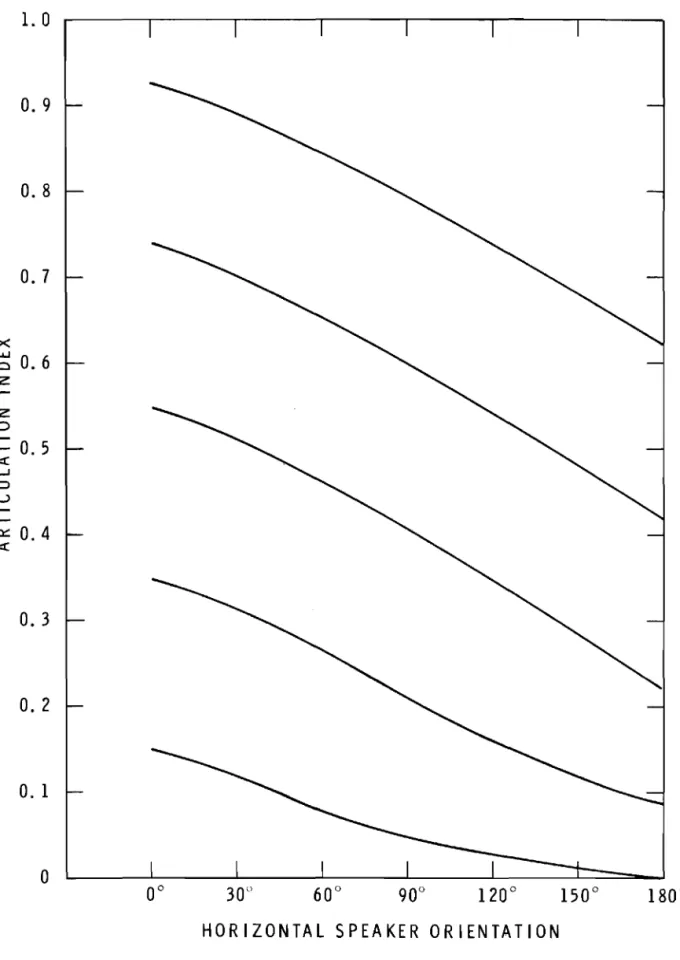
for each test position, and Figures l6(a) and (b) derived in step (2) can then be used to give a preliminary value of AI.5) These preliminary values of AI were corrected to take account of azimuthal effects, using Figure 17 (9). The number finally obtained for each position is called the calculated AI (Table III).
SUBJECTIVE INTELLIGIBILITY ASSESSMENT
In the G'r iffi.th s! test the listeners are presented with a test list containing 250 CVC (Consonant VowelConsonant) words
arranged in rhyming groups of five. The words within each group of five differ in either the initial or final consonant, but not in both. The speaker reads one word from each group of five and the listener has to make a choice from the five, guessing if he does not know. This forced choice from five gives a chance
score of 20 per cent on the test.
A volunteer crew of twelve, drawn from outside the occupants of the space, comprised the test team. Each was given an audio-metric test and all had hearing that was within normal limits
considering age effects. The tests were carried out in the work space, during the lunch hour. As the team was not specially selected there was a large scatter in the results, reflecting different aural acuities and listening skills.
The mean subject score for each of the positions shown in Figure 1 was obtained under the different noise conditions in the schedule. The voice level of the speaker was monitored at a
distance of 3 ft using a B & K sound level meter on the A scale and the fast time constant. The initial tests were made with the observed peak reading on the meter at VP、bサaスセ but it was decided that
this was too high and during the latter tests a peak reading of 55dB(A) was maintained. Due to illness, the speaker unfortunately had to be changed towards the end of the test series, but repeat tests indicated that the effects of this change were of minor importance. Table IV
shows the mean score obtained in each position for the 60dB(A) tests and Table V shows those for the 55dB{A} tests. The relative effect-iveness of the different masking spectra can be estimated from these.
Comparison may be made more easily, however, by the mean normalized score s shown in Figure l8{a) and (b). The te st score in each position was normalized to the score obtained under
ambient conditions with a 60dB(A) voice level. The normalized scores for all positions were then averaged to obtain the mean normalized score.
The expected mean normalized score was obtained from the calculated AI value s for a typical po sition (T able III) and Figure s 20 and 21. To take account of the different voice levels used in the tests, the AI values were increased by 0.17 when a 60dB{A) peak voice level was used. The score s so obtained were
normalized as before t o give Figure l8{b). It is quite clear that by choosing a poor spectrum workers in the office can be
subjected to fairly high noise levels and gain little extra privacy. Conversely, a wise choice of masking spectrum Can greatly improve speech privacy without seriously degrading the environment.
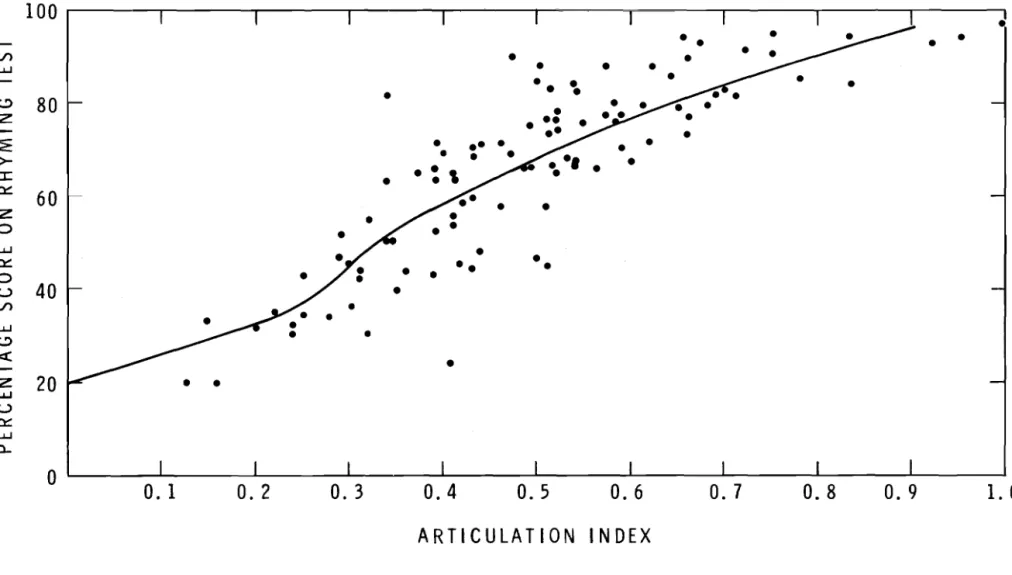
Figure 19 shows a plot of the mean score for each te st in each position versus calculated AI; the different voice levels were allowed for as before. The two lines are simply linear regression lines and there is no a priori reason to expect them to fit. The
standard error, Sy' is 10.57.
[S2
=
セ
(y observed - y calc) 2/ nJ
y Iand the correlation coefficient between mean score s and calculated AI is 0.82.
Two othe r curve s from diffe rent source s are of inte re st in relation to this plot. The first is obtained from Griffiths' work (8) by assuming that when AI
=
0, the score obtained is 20 per cent, the chance score. This necessitates a small amount of extrapolation of Griffiths'data. The curve can best be fitted to the points of Figure 19 by increasing all the calculated AI values by 0.04. When this is done the standard error, Sy has a minimum value of 10. 33 and the index of correlation p of 0.83(o 2
=
1 _ Sセ
crセ
) •The result of this fitting process is shown in Figure 20.
The second curve of interest, Figure 21, is obtained from the 1000 PB (phonetically balanced) word curve in the ANSI standard (8) by as suming that the subject hears p per cent of the words correctly and guesses one fifth of the remaining (100 - p) per cent correctly. (Although this treatment is rather unsophisticated, it appears to give an approxi-mately correct cu r ve , ]
MMMセMMMMMMMMMMセMMMMMMMMMMMMMMMMMMMMMMMMMMMMMセMMGMGM
-10-To obtain a be st fit of this curve to the points of Figure 19 all the calculated AI values are decreased by 0.05 so that the m.inirnum. value of Sy
=
10.85 and p :II 0.8l.It is necessary at this point to elaborate on a discrepancy in the foregoing work: the ideal voice level assum.ed for the calculations of AI was 65dB long -term. rm.s whereas the real voice level was
closer to 55dB long-term. r-m s , If taken into account this difference of 10dB necessitates a reduction in the calculated AI values of 0.33. The change, if rriade , would m.ean that when AI is zero, subjects can score 50 per cent on the Griffiths' test. This result seem.ed som.ewhat surprising and because of this, and other reasons, it was decided to rnake a careful com.parison of the Griffiths! test with the standard ASA te st.
This com.parison has since been m.ade in the DBR/NRC labor-atory using a carefully selected test crew with good hearing. The
scatter in the results is m.uch less but the sam.e feature erne rg ad; when the calculated AI was zero, the score obtained on the Griffiths! test was 60 per cent.
To achieve acceptable privacy in an open office, it appear s that AI should be less than O. 15. The critical range of AI is from. 0.35 down to zero. In this range very srnall change s in AI produce great change s in sentence intelligibility, and any te sts used to evaluate AI in this region should be either very sensitive to sm.all change s in AI or
very accurate. The Griffiths' test is not at all sensitive to AI changes and, when used with a random.ly selected crew, is not at all precise. The precision of the te st can be im.proved by selecting the te st crew with care, but this would erase the sim.plicity of the test. One m.ust conclude that the Griffith s! test, although superficially attractive, is not suitable for simple estim.ates of Al in the open-plan office.
Re suIts
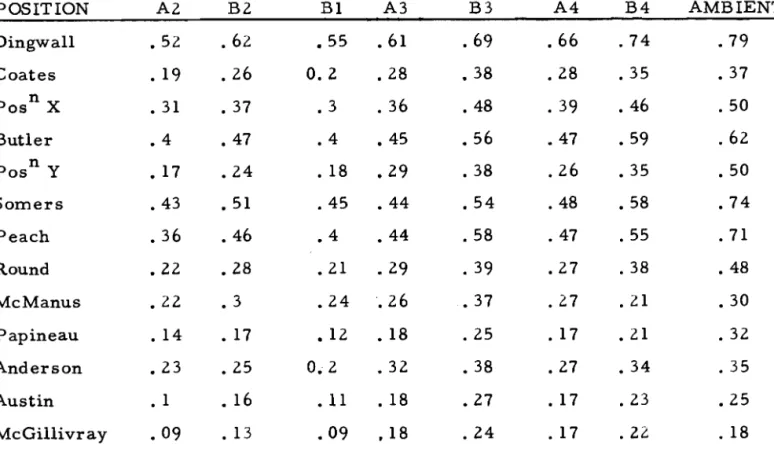
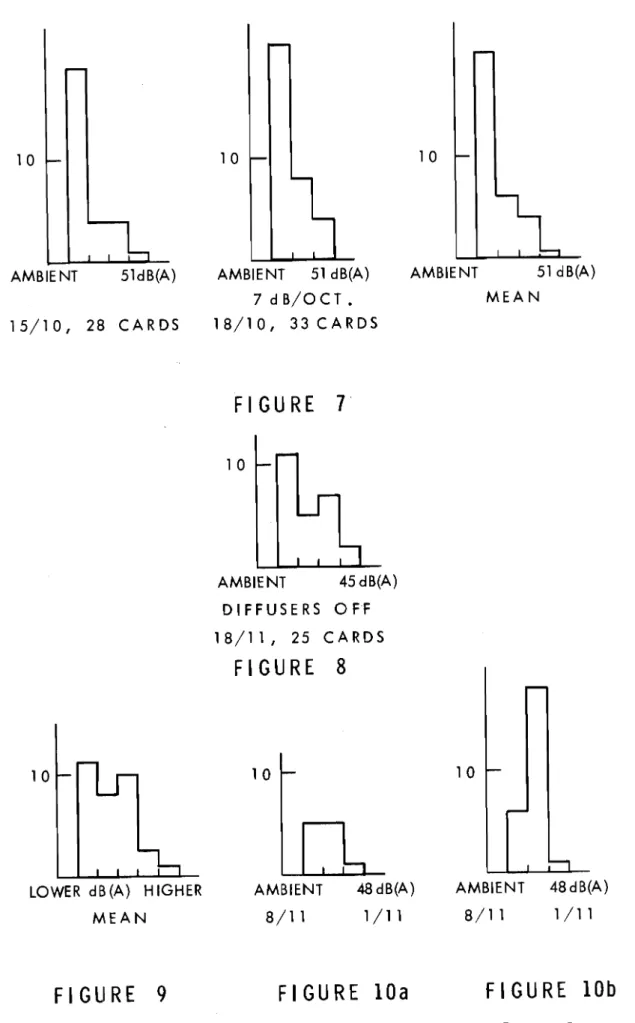
The findings of the intelligibility tests together with AI calcula-tions provided a m.eans of predicting the speech privacy relation corre s-ponding to any talker-listener pair in the space. As an exam.ple, a
range of conditions for a talker-listener separation of 12 ft is sum.m.arized in Table VI. (Som.e of these values have been adjusted to m.ake them.
directly cornpa r ab le , ] It will be seen that with no added m.asking noise (natural am.bient 40dB{A)) the Articulation Index varie s from. 0.35 to 0.88 depending on the arrangem.ent of screens and talker orientation. In the be st case speech privacy would be rated as "very poor". With the 50dB{A) of m.asking noise the be st case is prom.oted to "excellent". The fact that so m.any of the ratings are not satisfactory is a result of the poor perform.ance of the ceiling installed.
It should be remarked that the se privacy criteria relate to how much a listener may understand if he is actively paying atten-tion. The converse question of how much he will be disturbed by intruding speech is more complex, but probably the acceptable level will be somewhat higher. It is surmised that the listener who is typically exposed to several more or less concurrent voices in the AI range of 0.30 to 0.50 will be relatively undisturbed by any one of them.
PHYSICAL PROPERTIES OF THE SPACE
The general behaviour of sound in the test space was examined by means of propagation measurements taken with the apparatus
indicated in Figure 22. The test signal was pink noise (wide-band random noise containing equal sound power per third octave). The sound level meter was set on either a flat frequency response or the A-weighting network.
The first series of te sts involved a propagation path with no intervening screens except those introduced to investigate screening effects. The se measurements, to be discus sed below, were taken to permit evaluation of the performance of the ceiling, ceiling baffles, and screens. The test area was the middle of the space where reflections from boundary walls were expected to be small. By way of confirmation, propagation measurements before and after installation of absorbing panels on the inner core walls showed no difference.
It should be noted that this study is circumscribed by the propertie s of the installed ceiling, a fis sured mineral fibreboard having only moderate absorption (measured NRC = 0.45). A more definitive study is planned in another space where it will be possible to change the ceiling board as well as the other parameters.
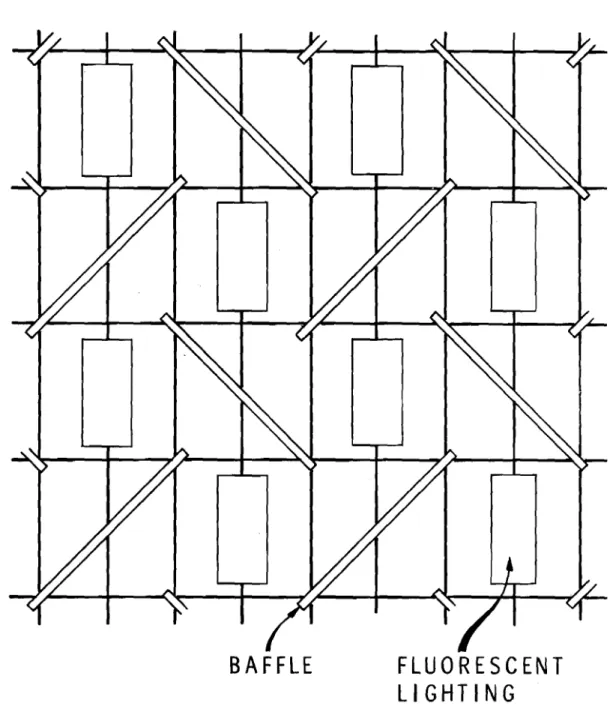
Four sets of measurements were taken along the same pro-pagation path: with and without ceiling baffle s , and with and without an. セセNョエ・イカ・ョゥョァ screen. The ceiling panels measured 5 by 2 1/2 ft and were installed in metal T-bars. The baffles were made of glass fibre covered with a white porous cloth, measured 8 ft by 8 in. by
2
1/
2 in., and were suspended 1 -Ln , below the ceiling from the T -bars. The arrangement is shown in Figure 23. The intervening screen consisted of glass fibre batts in a frame covered with open-weave cloth. The top and bottom of the screen were 5 it and 6 in. ,respectively, from the ground. The screens were 6 ft wide and about 3 in. thick, either flat or gently curved. The results of the propagation measurements are shown in Figure 24, and are replotted in Figure 25 to draw attention to the effects of the screens.
-12-Measurements taken from point to point within the space, with no intervening screens or b aff Ie s , show that the absorption is adequately high, giving a decrease in sound intensity of about
5dB(A) with doubling of distance. By comparison, attenuation in free space would be 6dB per doubling of distance. The same
serie s of measurements rnacie after the installation of ceiling baffles shows that this b affIe configuration produced no significant change in the rate of sound a tt e nu ati o n ,
Another se rie s of propagation rrie a su r erne nt s , using the same apparatus, was made as an adjunct to the subjective articula-tion measurements. In this series the loudspeaker was pointed directly at each of the several work positions used for articulation tests and the sound levels noted. Following installation of the ceiling baffles the series wa.s repeated and the two sets of results are compared in Figure 26, again demonstrating the limited importance of the ceiling baffles in this configuration.
The significance of trii s information needs careful con-sideration. Othe r tests h ave shown that baffle devices fixed to the ceiling at sufficiently cIc s e spacing can reduce sound propaga-tion in an open-plan offi c e , at least beyond a certain minimum
range. The area of interest is within a lO-ft :;:oange of any speaker position because it is in this zone that speech privacy and annoyance problems exist. At greater distance s the signal will normally
have sufficiently decreased in intensity to be little more than part of the general noise, and this will even have an advantageous effect on the level of naturally generated rn a s k irig noise. The ineffectiveness of the baffle s, as installed, is probably due to their configuration. Along the propagation path the baffle centre s were lOft apart and the degree of baffle interaction wit h sound waves was understandably
small. It should be added, however, that many favourable comments were received about reduction of glare from £luore scent lighting fixtures.
The effects of free - standing screens on the propagation of sound in the test office may be seen in Figure 26. Screens should not be regarded as a panacea for ac ou st.i c ills in a landscaped office, but with careful use and attention to other important parameters, they can be very valuable in acoustically separating adjacent work
stations.
When considering the performance of a screen, the importance of the ceiling material emerges. Sound, at the important speech
by direct transmis sion through the screen, by diffraction around the screen,
by reflection from the ceiling,
by reflection from vertical flanking surfaces.
For moderately well constructed screens one can expect to achieve attenuations of 15 to 25dB for sound travelling through them. For a given size of screen the amount of diffraction is fix.ed and generally, is not the rn o st important limiting factor at the important speech
frequencies.
The most important paths involve reflections from horizontal or vertical flanking surface s , In the absence of vertical flanking
surfaces, reflection from the ceiling plays the dominant role in determining the performance of a screen. For this reason much attention is given to the absorption of the ceiling material in an open-plan office. More specifically the absorption coefficient for sound wave s incident at angle s around 50 0
is critically related to the reflected sound signal received at nearby work stations. As this latter property varies from material to material, preferences have been expressed for use of some materials over others.
For a screen positioned 6 it from the source, typical
insertion losses are 5dB(A), corresponding to a reduction in articula-tion index of O. 17. For a given speaker-listener distance, the inser-tion loss is greatest when the screen is close to the speaker or
listene r ,
A subsidiary experiment, the results of which are not shown here, indicates that for any separation of 9 ft or greater the insertion loss achieved by positioning a screen 3 ft from the listener is fairly constant at about 7dB(A), co r re sponding to a reduction in articulation index of 0.23. Such changes in AI can alter a situation from "marginal" to " c o nfidential privacy" or from "fa.i r communication" to "normal privacy. II
It should be kept in mind that these results were obtained in an office space with a fairly high density of furniture, including
sound-absorbing screens. Measurements were made along a fortuitously-occuring aisle and it is possible that the presence of the furniture on either side of the aisle interfered slightly with the propagation measurements.
Conclusion
The major problem in a landscaped office is the annoyance caused by intrusive sounds, particularly speech. There is no doubt
-14-that the installation of a background noise system can effectively improve the isolation between neighbouring work places. It appears from this study, however, that unles s workers have a strong need for privacy background noise is unacceptable. Other workers,
having a stronger need for privacy, show a different reaction.
When there is a strong need for privacy or freedom from distraction, one might reasonably que stion the openplan approach.
This study illuminate s an obvious fact; that people do not gladly accept added noise in their lives. Given the choice, they prefer to have quietness. With this in mind, it seems that any open office design that requires the use of high masking noise levels to guarantee privacy should be carefully considered and other possible approaches looked into. It is also important in making such an assessment that the desire for visual privacy not be confused with the need for acoustical privacy. There will, naturally, be intermediate cases where absolute privacy is not essential and a masking noise system in an open office can provide the answer.
In the environment studied a moderate level of masking noise is provided by mechanical equipment. Although the character of the mechanical equipment noise is not ideal, it has the advantage of being as sociated with a de sirable attribute of the space (air conditioning) and it provide s the modicum of masking needed to make the space tolerable. Except for real privacy needs this seems to be sufficient. The physical measurements were in accord with expectations, although the ceiling baffles were not very effective, probably due in part to the spacing}depth relation used.
Acoustic screens are most valuable for the separation of adjacent workspaces and, used intelligently, can give attenuations of 57dB(A), a value limited primarily by the properties of the ceiling. To avoid decreasing the effect of screens, surfaces above desk level should be absorptive, where practicable, to eliminate reflected sound. The value of screens is further enhanced by the fact that they introduce absorption into a space and provide visual privacy.
-
REFERENCES
15-1. Abrahams, M. L. Environmental Space Planning and Design ESPD. oーエゥュオュLセL No.3, 1971.
2. Lappat , A. Criticisms of Officescapes, Bauen und Wohen 25, No. I, pl , Jan. 1971, (In German, will appear as National Science Library Technical Translation Note).
3. Lorenzen, H. J. and Jaeger, D. The Office Landscape. Contract Magazine, January, 1968.
4. Hegvold, L. W. Acoustical Design of OpenPlanned Offices National Research Council of Canada, Division of Building Research, CBD 139, July 1971.
5. Beranek, L. L., Blazier, W. E., and Figwer, J. J. Preferred Noise Criterion Curves and their Application to Rooms, J. Ac ou st , Soc. Am.e r , セL No.5 (Part I), 1971, P 1223. 6. Hegvold, L. W. Experimental Masking Noise Installation
in an OpenPlanned Office, National Research Council of Canada, Division of Building Research, Technical Note No. 563.
7. Hamme, R. N. and Huggins, D. N. The Problem of Acoustical Specifications for Office Landscape Ceilings, Paper Dll, 83rd meeting of Acoustical Society of America, April 1972.
8. American National Standard Methods for the Calculation of the Articulation Index, ANSI S3. 5, 1969.
9. Griffiths, J. D. Rhyming Minimal Contrasts: A Simplified Diagnostic Articulation Test, J. Acou st , Soc. Arne r , 42, No. I, 1967, P 236.
TABLE I TEST SCHEDULE
MASKING NOISE CONDITION
DATE AM
PM
Wed Oct 13 A3 B3
Thurs Oct 14 B3 A3
Fri Oct 15 A3 ambient
Man Oct 18 ambient A3
Tues Oct 19 A3 A2
Wed Oct 20 A2 B2
Thurs Oct 21 B3 BZ
Fri Oct 22 B2 B3
Man Oct 25 B2 Bl
Tues Oct 26 B2 C2
Wed Oct 27 B2 ambient
Thurs Oct 28 C3
Cl
Fri Oct 29 B2 B3
Man Nov 1 till
Fri Nov 5 B4 B4
Man Nov 8 till
Fri Nov 12 ambient ambient
Thurs Nov 18 ambient C4
TABLE U
SUBJECT GROUP CLASSIFICATION
POSITION C LASSIFICA T ION
Director. Const , Branch Director's Sec'y
Chief Engineer Chief Eng's. Sec'y Chief Architect Chief Arch. 's Sec'y
Chief Management Support Chief Man. Supp. 's Sec'y Arch. Contracts Officer Stenographer
Chief. Contracts Division Chief. Con.' s Se cfy
Typist
Authorities Officer Contracts Clerk
Eng. Contracts Officer Special Contracts Officer Contracts Clerk
Contracts Clerk Financial Officer Fin. Off. IS Clerk
Fin. Off.'s Clerk Chief Admin. Services Chief Admin. Se r l s , Sec'y Chief Program CoOrd. Mail Clerk Purchasing Clerk Program CoOrd. Officer Personnel Clerk Records Clerk Records Clerk
Elect. Power EO. Design Off. Elect. Power Design Off. Stenographer
Elect. Power EO. Design Eng. Chief Elect. Engineering
Eng.
ric
Elect. Power EO. Design Elect. Power Systems Eng.Elect. Power Systems Eng. Elect. Power Systems Eng.
SX2 ST6 EN2 CR4 ARB CR3 AS7 ST5 AS4 CR4 AS6 ST4 ST3 ASl CR3 AS4 AS4 CR5 CR3 FII CR3 CR2 AS4 ST4 AS4 CR3 CR4 AS2 CR5 CR3 CR2 EG9 EG6 ST3 EN3 EN5 EN4 EN2 EN4 ENB
TABLE ill
CALCULATED AI IN EACH POSITION FOR ALL TEST CONDITIONS USING IDEALIZED VOICE
MASKING CONDITIONS TEST
POSITION A2 B2 Bl A3 B3 A4 B4 AMBIENT
Dingwall • 52 • 62 .55 • 61 .69 .66 .74 · 79 Coates • 19 • 26 0.2 • 28 • 38 · 28 · 35 • 37 n Pos X • 31 • 37 • 3 · 36 .48 · 39 .46 · 50 Butler • 4 • 47 • 4 .45 .56 .47 • 59 · 62 n Pos Y .17 .24 • 18 .29 • 38 · 26 • 35 • 50 Somers .43 • 51 .45 .44 .54 .48 • 58 .74 Peach • 36 .46 • 4 .44 · 58 · 47 · 55 · 71 Round • 22 .28 • 21 · 29 · 39 .27 · 38 .48 McManus • 22 • 3 .24 .26 • 37 · 27 · 21 • 30 Papineau • 14 .17 • 12 • 18 · 25 · 17 • 21 · 32 Anderson • 23 • 25 0.2 · 32 • 38 • 27 • 34 · 35 Austin • 1 • 16
.11
• 18 • 27 • 17 · 23 • 25 McGillivr ay .09 • 13 .09 • 18 · 24 · 17 · 22 · 18MEAN SCORE ON RHYMING TEST POSITION Dingwall Coates Position X Butler Position Y Somers Peach Round McManus Papineau Anderson Austin McGillivray A2 69.5 78 79.5 86 88 68.75 70. 5 40.2 62.7 50.7 36.7
TEST FOR 60dB(A) PEAK VOICE LEVEL
MASKING B2 69.25 79.7 79.2 91. 5 93 75. 5 73.25 65 57.7 CONDITION A3 66.5 77.7 77.5 93.5 79.7 76 76 69.7 AMBIENT 97 76 81. 7 84.2 94.2 93 82.25 83. 5 68.6 65.7 71. 5 64.0
TABLE V
MEAN SCORE ON RHYMING TEST FOR 55dB(A) PEAK VOICE LEVEL
MASKING CONDITIONS TEST
POSITION B2 B1 B3 A4 B4 AMBIENT
Dingwall 90 77.7 83.25 Coates 45 30.7 58.75 29.75 23.7 55.5 Position X 53.7 50.25 65 44.7 46.6 66.2 Butler 57.7 48 67.5 44.8 72.7 Position Y 34.5 43.1 67.0 Somers 75.4 66 74.6 71. 7 85.5 Peach 84.8 71 88 77.0 70.6 90.7 Round 55 43 59.5 43.75 45.4 65.7 McManus 50.5 33.7 64.75 41. 75 34.3 43.5 Papineau 20 43.5 Anderson 46.7 32.5 52.2 Austin 31. 7 33.2 51. 5 McGillivray 20
TABLE VI
SPEECH PRIVACY FOR VARIOUS POSITIONS
NOISE LEVEL
POSITION
dB(A)
FRONT
40
"
40
47
"
47
"
50
"
50
"
SIDE
40
40
"
47
"
47
"
50
"
50
"
BEHIND
40
40
"
47
"
47
"
50
"
"
50
12 FT FROM TALKER
PERCENTAGE
SCREEN
SCORE
NO
YES
NO
YES
NO
YES
100
86
86
63
71
52
NO
YES
NO
YES
NO
YES
90
70
71
50
63
39
NO
YES
NO
YES
NO
YES
75
57
57
29
42
20
ARTICULATION
INDEX
PRIVACY
CONDITION
.88
.65
.65
.45
· 55
.35
NIL
NIL
NIL
VERY POOR
NIL
VERY POOR
.75
.55
· 55
.32
.45
.22
NIL
NIL
NIL
VERY POOR
VERY POOR
POOR
.58
.35
· 35
.12
.25
.02
NIL
VERY POOR
VERY POOR
ACCEPTABLE
POOR
EXCELLENT
o
CJ
BWALL
TALKERD
PAPINEAU、jセュククxxxl
イctセsi
(]l
I .
ᄋ「tセri
SOMERS
o
PEACH \セセO
I
I '
セ
FIGURE 1 TOWER C 4th FLOOR LAYOUT
•
• •
60
W e:::: co '"050
Z•
e::::•
•
. . J « Wco >0 We:::: ..J40
U cャセ Z « N co 0 030
wO > . « 0 I-u
20
0 I Cl e:::: :J: I-1000
10000
100
FREQUENCY IN HERTZFIGURE 2a
MASKING SPECTRUM 81 (DOTS) COMPARED
WIT HAM 8 lEN T SO UND (S 0 LID LIN E) 42 d8 (A )
6
a __...
⦅MNNNNNMMMLMMMセM⦅イMMMMイMMMMMイMMMMMMLセMMLLU
0::: Z 50•
•
•
...Jo:::LU«
>COセ セ
40
oU zセ«
CON 030
LUo
> 0.
«
1 0 U0
,
20
•
0 0::::c
I-10000
1000
100 FREQUENCY IN HERTZFIGURE 2b
MASKING SPECTRUM B2 (DOTS) COMPARED
WITH AMBIENT SOUND (SOLID LINE) 42dB(A)
brセセYP -3
co
•
"1J•
Z50
•
•
...J a::::LU«
>coLUO
...Ja::::40
oU zセ«
co N 030
LUO
> 0«
.
0 1-U0
20
I Cl•
a::::
:I: FREQUENCY IN HERTZFIGURE 2c
MASKING SPECTRUM B3 (DOTS) COMPARED
WITH AMBIENT SOUND (SOLID LINE) 42dB(A)
LU
60
0:::
I
• •
60•
Z 50•
Ie:::: •LU«
>coLUO
I e::::40
oU zセ«
coN o 30 LUO ^セ«0
I -Uo
20
Io
e:::: FREQUENCY IN HERTZFIGURE 2d
MASKING SPECTRUM B4 (DOTS) COMPARED WITH
AMBIENT SOUND (SOLID LINE) 42 dB (A)
1 00
1000
10000
N o o o o
60
LLl 0::: Z 50 0::: --14: LLla:lセo
--I 0::: 40
u
0 -Z::f 4: a:l 30 LLl>
4: I -Uo
20
Io
0::: :c I -1 001000
FREQUENCY IN HERTZ
FIGURE 2e
BBN RECOMMEN DED RANGE I N THE NO I SE
SPECTRUM IN AN OPEN PLAN OFFICE
10000
ACOUSTIC SURVEY OF TOWER C National Research Council of Canada
Division of Building Research DATE 1 _
PLEASE CHECK ONE OF THE FOLLOWING: much prefer morning .•..•....••••..
D
slightly prefer morning ...••.•.D
no preference ...•....•.•..•.•.••D
slightly prefer afternoon .••.•...•.D
much prefer afternoon .•.•..•....•.•D
OTHER COMMENTS1 0 45 dB(A) 48 dB(A) 26/10, 29CARDS 5dB/OCT 20 Vl LU Vl Z
o
Q.. Vl LU セ LL. 1 0o
セ LU co :E ::> Z セ LU LL. LU Q.. I U ::> :E .,J::t::. セ LU LL. LU セ Q.. >-...J I -I 0
...J Vl LU U Z LU セ LU LL. LU セ Q.. 0z
セ LU LL. LU セ Q.. >-...J l -I 0 -...J Vl セ LU LL. LU セ Q.. I u ::> :E CONDITION CONDITION ONE TWO KEYFIGURE 4
1 0 10 10 48dB(A) 13/10, 35 51 dB(A) CARDS 48 dB(A) 14/10, 51 d B(A) 33 CARDS 48 dB(A) 51 dB(A) MEAN -7dB/OCTFI GURE 5
1 0 AMBIENT 48dB(A) 27/10, 25 CARDS -5dB/OCTFIGURE 6
BR ...セセo -81 0 10 1 0
AMBIENT AMBIENT 51 dB(A) AMBIENT 51 dB(A)
7dB/OCT. MEAN 15/10, 28 CARDS 18/10, 33 CARDS
FIGURE 7
51dB(A) 1 0 AMBIENT 45dB(A) D IFF USE RS 18/11,25FIGURE
10 1 0AMBIENT 48 dB(A) AMBIENT 48dB(A) 8/1 1 1/1 1 8/1 1 1 /1 1
FIGURE lOa
FIGURE lOb
1 0
LOWER dB (A) HIGHER MEAN
FIGURE 9
0 FF CARDS8
VセGャGャセッMY10 1 0 5 dB/OCT. 7 dB/OCT. 28/10, 22 CARDS 45 dB (A)
FIGURE 11
10 1 0 5 dB/OCT . 7 dB/OCT. 5dB 7dB 5dB 7 dB 5 dB 7dB 21/10, 28 CARDS 22/10, 23 CARDS 29/10, 25 CARDS MEAN48 d B(A)
FIGURE
12
5dB/OCT. 7 dB/OCT. 20/10, 29CARDS 51 dB (A)FIGURE 13
1 0 1 0 1 05 dB/OCT. 7dB/OCT. 5 dB/OCT. 7 dB/OCT.
19/10, 29 CARDS MEAN
1 0 5 dB/OCT. 3 dB/OCT. 48 dB(A) 25/10, 26 CARDS
FIGURE 14
80 . . . . - - - - . - - - , . - - - , - - - - r - - - r - - r - - -...- - - - , - - , - - , Z 70 10:::w«
> d l wO - I 0::: 60 cャセ zセ « N dl o 50 w O ^セ «0 t-uo
40 I Cl 0::: :::c t-30 PE A KS R. M. S . 1000 10000 FREQUENCY IN HERTZSPEECH AT 1 METRE, MALE VOICES
LONG TERM
r. m. s.
=65 dB)
BR"''''fO-I\ 100FIGURE 15
IDEALIZED
( OVERALL
1.0
o.
8
· 6
«
· 4
· 2
NO.4 SPECTRUM
I , I I I I I I I ,o
,-17
13
9
5
1
3
7
11
15
19
23
SIGNAL TO NOISE RATIO, dB
FIGURE 16a
AI VS SIN FOR IDEAL SPEECH SPECTRUM
1. 0
I i i i i i I i i i "'"""· 8
· 6
«
· 4
· 2
0
,13
9
5
-1
3
,7
11
15
19
NO.
NO.3 SPECTRUM
'
,.,...-
' . . . - . = : ' , I i17
i 'SIGNAL TO NOISE RATIO, dB
i
23
IFIGURE 16b
AI VS SIN FOR IDEAL SPEECH
SPEECH LEVEL AT 3FT TAKEN AS 65 dB LONG TERM
r. m. s.
NOISE LEVELS IN dB A
O. 9
O. 8
O. 7
x セ 0.6z
z
o;:: 0.5
«
....J :=l U l -e:::0.4
«
O. 3
0.2
O. 1
o
HORIZONTAL SPEAKER ORIENTATION
FIGURE 17 AI VS. SPEAKER ORIENTATION
SR ,,"'.0 -1*
NOISE CONDITION u.J ""o
u V"I Cl u.J セ 0.6 ....J « ::E""
o
z
z
0.4 « u.J ::E u.J""
o
1.0 u V"I Cl u.J N ....J 0.8 « ::E""
o
z
Z 0.6 « u.J ::E Cl u.J I-U 0.4 u.J Q.. X u.J 0.2 B4 A4 Bl B2 B3 0.8 \ /"
"
/ \. • SPEAKER 1 0SPEAKER 2 (0 )•
セ -, \. 0 0 0 , • _ . ... ...00 jO--.-...""""
,
. / <,.
_. 0 /0-'...
-,.
'0"'/"""-. : , • . / ... <, / / • GRIFFITHS •o
ANSI (b) (60) (60) (55) (60) (55) (55) (55) (55) (55) (55) VOICE LEVEL FIGURE 18EXPERIMENTAL AND EXPECTED MEAN NORMALIZED
•
•
•
••
•
•
• •
••
•
•
•• • •
• •
•
•••
• •
• •••
• • • •
•
•
•
•
•
.
Vl100
L.U .-C> Z セ80
>-I e::::: Zo
L.U60
e:::::o
u
Vl L.U C>40
«
.-z
L.U Uセ
20
c,z
«
L.U セo
•
•
: . .
.
vBセZ
·
セ
. /...
セN
".
.
..
セ
.
.
セ
..
•
•
セNO
.
...-..
r
O. 82
..
セNGN
•
O. 1
O. 2
0.3
0.4
0.5
0.6
0.7
O. 8
0.9
LO
CALCULATED ARTICULATION INDEX
FIGURE 19
MEAN SCORE ON RHYMING TEST VS CALCULATED A I
•
•
•
••
•
•
• •
•
•
I I I I I I•
l-100
• •
セ
.
•
..
Vl•
•
•
•
•
•
l..LJ l - セ -c.:>80
•
•
•
•
-
•
セ•
• • • •
• •
:z
•
. .
»:
...
.
>-:::I: セ60
•
-:z
セN 0•
l..LJ 0 u セ40
/!
.
•
•
•
•
•
Vl -l..LJ I セM c.:> セ•
:z
I -RPセ
•
•
l..LJ U セ l..LJ0-a
O. 1
0.2
O. 3
0.4
O. 5
0.6
O. 7
O. 8
O. 9
1.0
ARTICULATION INDEX
FIGURE
20
BEST FIT OF TEST DATA TO GRIFFITHS' RESULTS
bセlKYYc|M|BB
• •
•
•
• •
••
•
•
•
•
•
•
•
••
•
•
•
•
•
•
•
0-a 00 a•
r-.
•
a•
\,Q•
•
•
•
a•
•
• •
•
Lt'\•
a•
••
セ
...
•
..
•
•
•
•
er•
a•
••
•
•
•
•
C""•
a•
N a•
•
l"""'4 a•
a a a a a a 00 N l"""'41531
セniwahセNO
SセojU Sセ|ヲQnSjセS、 X LJ.J 0 Z Z 0 I -<t: J => U I c:::: <t: <t: I -セ <t: 0 Q..
0-:I" Ii V') Z b <t: 0 LJ.J u... 0 0 :2: 0 l -<t: l -<t: 0 l V') LJ.J I u... 0 l u... l V') LJ.J co l"""'4 N LJ.J c:::: => <.:> u...POWER
PINK NOISE
AMPLIFIER
GENERATOR
d
..
..
セ
[L]
V
EV 8"
SOUND LEVEL
LOUDSPEAKER
METER
3
1FROM FLOOR
FIGURE 22
APPARATUSUS EDIN PRO PAGAT ION MEA SUR EME NTS
BAFFLE
FLUORESCENT
LIGHTING
FIGURE 23 SCHEMATIC Of CEILING LAYOUT
nn. "'99" 19
o
10
20
<..=:>z
0«
l.L.J 0::: -('t"\0
0 I-l.L.J>
I10
«
...J l.L.J 0:::«
セ 20
"0 Z Z 0I-«
セ0
z
UJI-«
10
20
f...-
f...-
a
I
I
I
I
I
ca
aNO BAFFLES
·BAFFLES
•
a
•
•
セ•
NO SCREEN
a
I I I I I I I I I I
a
セ•
e
•
•
SCREEN AT
3
1 セ I I I Ia
1 I 1 1•
a
a
•
•
a
•
•
•
0•
SCREEN AT
6
1a
•
I
II
I
I3
16
112
124
1 481DISTANCE FROM LOUDSPEAKER, FT
FIGURE 24
PROPAGATION MEASUREMENTS SHOWING BAFFLE
EFFECTS
...
0
I
0,.--10
0•
0 ...J 0 L..LJ>
•
L..LJ 0 ...J- 20
0-
•
C'f'\NO BAFFLES
a
0 I--w•
j«
>
I I--0NO SC REEN
...J•
SCREEN AT 3
1 L..LJ 06
1 0:::SCREEN AT
0
0«
0 co "'C 0z
-10
0 0z
•
0 0 0a
0 I--•
•
0«
0•
::J- 20
•
0z
•
0 L..LJI--«
0-30
•
BAFFLES INSTALLED
40
3'
6
112
I24
I48
IDI STANCE FROM LOU DSPEAKER, FT
FI GURE 25
PROPAGATION MEASUREMENTS SHOWING SCREEN
EFFECTS
-10
z
o
20 30 40o
BEFORE BAFFLE INSTALLATION 0 MEAN = 15.4 • AFTER BAFFLE INSTALLATION•
MEAN - 16.0 >-X>-
<J:: ...J c>::: Z ...J Z Z Vl :::J>
:::J 0 <J:: Vl 0 0 Vl <J::
Vl ....J c>::: 0 Z w ...J Z セ w c>::: c>::: I t w t Z t w Z <J:: L.LJ 0
...J
U t-<J:: Vl Vl セ :::J セ 0... 0 0 Vl Z t- <J:: u u Z 0 0 :::J 0 0 w 0 <J:: :::J 0 U 0... co 0... Vl 0... c>::: セ 0... セ <J:: <J::FIG UR
E 26
PROPAGATION MEASUREMENTS TO THE TEST POSITIONS
Resume of introductory talk given to the participants in the masking-noise evaluation te st.
"As you are no doubt aware, your new accommodation js pro-vided with a background sound system which is presently in 9f'>eration. It is believed that such a system, when properly tuned and used in an open office environment, will improve the speech privacy condition, and reduce annoyance from intelligible speech and machine noise, thus providing improved working conditions.
We propose to carry out a series of tests to establish the most desirable operating condition for the system. The tests will be in two parts.
For the fir st part of the te st, you will be expo sed each day to two different masking noise conditions, one in the morning and one in the afternoon, and you will be asked to mark your preference on a card which will be provided. These cards will be picked up and analysed each day. There is a space on the card where you can make comments if you feel like doing so. In so doing we hope to arrive at the most satisfactory operating condition for the system.
The second part of the test will not involve the people working in the area; a different test group will be used. Articulation tests, to measure the effectiveness of the masking system for improving
speach privacy will be held each day during the lunch hour. It is for this reason that you have been asked to vacate the office during lunchtime. "
l