HAL Id: hal-01349589
https://hal.archives-ouvertes.fr/hal-01349589
Submitted on 28 Jul 2016
HAL is a multi-disciplinary open access
archive for the deposit and dissemination of
sci-entific research documents, whether they are
pub-lished or not. The documents may come from
teaching and research institutions in France or
abroad, or from public or private research centers.
L’archive ouverte pluridisciplinaire HAL, est
destinée au dépôt et à la diffusion de documents
scientifiques de niveau recherche, publiés ou non,
émanant des établissements d’enseignement et de
recherche français ou étrangers, des laboratoires
publics ou privés.
Vegetation patch effects on flow resistance at channel
scale
Jean-Stéphane Bailly, Fabrice Vinatier, Gilles Belaud, David Combemale
To cite this version:
Jean-Stéphane Bailly, Fabrice Vinatier, Gilles Belaud, David Combemale. Vegetation patch effects on
flow resistance at channel scale. E-proceedings of the 36th IAHR World Congress, IAHR, Jun 2015,
The Hague, Netherlands. pp.1-5. �hal-01349589�
VEGETATION PATCH EFFECTS ON FLOW RESISTANCE AT CHANNEL SCALE
JEAN-STEPHANE BAILLY(1), FABRICE VINATIER(2), GILLES BELAUD (3) & DAVID COMBEMALE(2)
(1) AgroParisTech, UMR LISAH, Montpellier, F-34060 FRANCE
e-mail [email protected]
(2) INRA, UMR LISAH, Montpellier, F-34060 France,
e-mail [email protected], [email protected]
(3) Montpellier SupAgro, UMR GEAU, Montpellier, F-34093 France
e-mail [email protected]
ABSTRACT
Thanks to a specific experimental design in a controlled channel, this paper aimed at quantifying how patches of four different ditches plant species affect integrated flow resistance parameters, the Manning coefficient. These plants, frequently encountered in the farmland ditches and irrigation channels of the south of France, were selected according to a large range of hydrophilic requirements, flexibility and branching complexity related to the plant blockage factor. Eight different spatial patches (regular, random, lateral or central patches) of each plant with crescent or similar plant densities were implanted at the bottom of a controlled channel where the water levels and water velocities were measured for three different discharges in steady and unsteady flow conditions. Resistance parameters (Manning parameters) were then estimated from the total head-loss, or from flow propagation velocity in the channel thanks to inversion of an hydrodynamic model. These experiments allow us to test the significance effect of channel vegetation patches and densities on flow resistance parameters at the reach scale.
Keywords: Manning coefficient, vegetation cover, variance analysis, vegetation species, vegetation density, vegetation pattern
1. INTRODUCTION
Vegetation of open-channels in cultivated catchments (irrigation channels, ditches, etc) provides numerous ecosystem services (Dollinger et al., Revision) by increasing the flow resistance, removes and disperses nutrients (Nepf et al., 2007), favors water infiltration to groundwaters (Dages et al. 2009), etc. Many past studies already focused on the characterization of flow resistance that can be induced from vegetation characteristics (Freeman et al., 2000 ; Yang et al., 2007 ; Jarvela, 2005 ; Wilson et al., 2008, Nepf, 2012). Authors mainly investigated aquatic vegetation effect on flow velocity vertical profiles (Jarvela, 2002, Belcher et al., 2003; Jarvela, 2005, Guo and Julien, 2008 ; Cassan et al., 2012), from which flow resistance parameters, e.g. the Manning coefficient, can be computed. In these studies, explored vegetation characteristics were plant species, plant height with homogeneous spatial distribution of plants within channel. In these studies, vegetation was submerged and flow resistance at channel scale when water height is lower than vegetation height has been poorly investigated (Righetti and Armanini, 2002). In a recent review, Nepf (2012) noticed that vegetation characteristics providing spatial heterogeneity in the canopy-scale can produce complex flow patterns and the relationship between plant patterns morphology and flow resistance is still an open question.
In this paper, experiments in a equipped channel were conducted in order to identify the resistance factor at channel scale, i.e. the Manning parameter, resulting from various non-submerged vegetation patches located at the channel bottom: vegetation density, vegetation pattern and vegetation specie. Channel equipment, plant material and experimental design are first exposed as well as the hydraulic models used for the Manning parameter estimation. Results on the relationships between Manning parameters and vegetation patches are thus presented and discussed.
2. MATERIAL AND METHODS
2.1 Material
2.1.1 Experimental equipped channel
Experiments were conducted in a equipped channel with cement borders of about 13 meters length, 0.7 meters width and 0.4 meter depth. Experiments using both steady and unsteady flows were realized. The channel was chosen according to its dimensions closed to the mean agricultural ditch of the Languedoc vineyards area and the mean tertiary irrigation channel of the Provence area, avoiding scale effects. The flow of water circulating within the channel was fixed to 13.3, 25.3 and 51.4 l.s-1 thanks to baffle sluice gates (Fig. 1-b) located upstream of the channel. 9.6 meters of the downstream
part of the channel was covered with high-density 6 cm width polystyrene foam plates glued to the bottom. This artificial bottom provided a smooth bottom with holes at a density of 328 holes par m² arranged on a regular grid where plants can be push down and installed for any chosen density and pattern (Fig. 1-c, 1-d, 1-e). Leveling system were used to measure the water levels and slopes at different point along the channel during experiments. Vertical and adjustable weirs were placed downstream of the channel according to the required water height/ vegetation height ratio during
E-proceedings of the 36th IAHR World Congress, the
Netherlands 28 June – 3 July, 2015, The Hague, the
Netherlands
steady flow experiments. Due to its high sensitivity to water, a specific Near Infra Red (NIR) video installed at the nadir position above to the channel was also used to trap the water front position over time under vegetation for lower water heights at an unsteady regime (water release). A Terrestrial Laser Scanner (TLS) was also used to precisely estimate the channel geometry, especially the bottom slope.
Figure 1. Examples of materials on the controlled channel: a- IRC camera was fixed above the channel, b-Baffle sluice gates controlling the flow at permanent regime, c- patch M4 of vegetation , d- patch M5 of vegetation, e- patch M7 of vegetation (Lythrum portula).
2.1.2 Plant material and tested vegetation patches
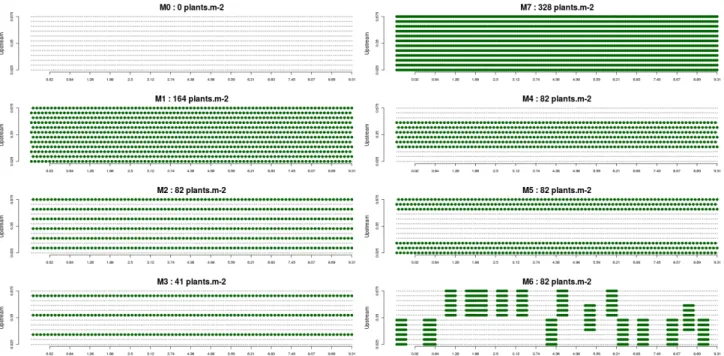
Four plant species were selected according to their abundance in ditches or canals of the Southern France landscapes. They were also selected according to their hydrophilic behaviour, their flexibility and their branching complexity: Asparagus acutifolius, Scirpoides holoschoenus, Elytrigia repens, and Lythrum portula. Two of them can be considered as herbaceous (Scirpoides holoschoenus and Elytrigia repens) while the two others can be considered as lignified (Asparagus acutifolius and Lythrum portula). Approximately 1600 plants of each species were daily collected in the Languedoc area (43,67N, 3.80W) in order to prevent plant desiccation and keep the initial roughness properties of plant material. Then, each plant was cut in order to get calibrated 40 cm-long replicates, and immediately installed at the channel bottom as shown with Lythrum portula on figure 1. Eight different vegetation patterns (Fig. 2), denoted M0 to M7 were settled at the channel bottom, with various plant densities for a regular pattern, varying respectively from 0 to 41, 82, and 164 plants.m-2 (patches M0, M1, M2, M3, M7). In addition, three different patterns at the 82 plants.m-2 density were settled: with vegetation concentrated around the central line of the channel (M4), ; at the opposite with vegetation concentrated along the two side walls of the channel (M5) ; and with 6*6 squared and aggregated vegetation patches randomly located along the channel (M6). These latter patterns were chosen according to actual patterns of vegetation observed on irrigation channel or agricultural ditches.
Figure 2. Vegetation patterns arranged along the channel bottom (abscissa axis). A vegetation plant is delineated by a round dark green point.
2.1.3 Experimental design
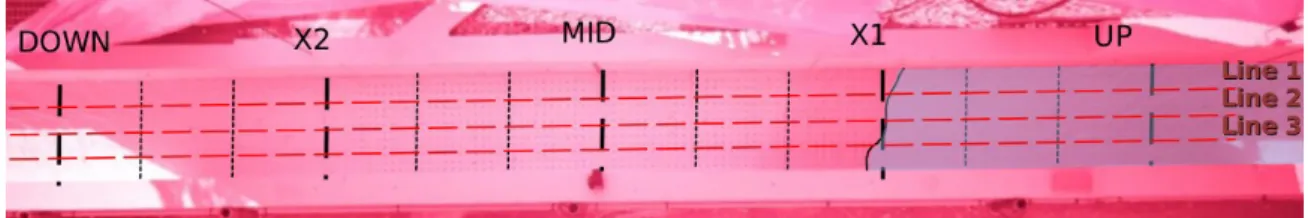
For each one of the eight vegetation patterns, experiments were proceeded with same order, corresponding to an increasing water height (Wh) to vegetation height (Vh) ratio. The flow front positions along three parallel lines of the channel was first monitored using the NIR video camera during a first water release of 13.3 l.s-1, when Wh/Vh was very low (Fig. 3). Secondly, once the steady flow was reached upstream a weir located dowtream, three water heights along the channel were measured in order to measure the slope of energy line. Then, the discharge was increased up to 25.3 l.s-1, and waiting for steady flow regime, three water heights along the channel were measured. For some plant patches, a last experiment with discharge increased up to 51.4 l.s-1 was tested, providing a configuration where water is just above the vegetation canopy. This process was reproduced for each one of the 4 plant species. We finally obtained 128 experiments, covering the following synaptic situations : Wh<<Vh, Wh<Vh, Wh=Vh, Wh>Vh. For each experiment, Manning roughness coefficient was estimated as described below.
Figure 3. NIR video camera image to monitor the water front position : example of an image extracted from a video from which the water front can be located at pixel resolution (a few mm) on three lines along the x channel axis (patch M0).
2.2 Manning parameter estimates at channel scale
Estimations of the Manning parameter (or its inverse Strickler parameter) were all proceeded using hydraulic simulation codes, dynamic water front location data or water height data and an unique optimization algorithm which is a combination of golden section search and successive parabolic interpolation. Instead of presenting absolute estimates of Manning parameters in results, we chose to present parameter value related to a base100 value equal to the estimated Manning for the M0 patch. The background behind this base100 choice is that actual Manning value in the different experiments situations incorporates other channel resistance factors (i.e. walls resistance for instance) or physical assumptions.
2.2.1 Manning parameter estimation during steady flow
Manning parameters during steady flow were estimated from the usual backwater curve that was obtained as followed:
In which Sb is the bed slope, n is the Manning parameter, Q is the discharge, B the canal width, R the hydraulic radius
and F the Froude number. The water level at the most downstream measurement section was considered as the downstream boundary condition, while Manning parameter was obtained by minimizing the error between measure water elevations and calculated ones with the Range-Kutta 4-th order approximation. Simulation codes and Manning estimation were all processed under the R environment (RDCT, 2005).
2.2.2 Manning parameter estimation during water release (unsteady flow)
For one experiment (one vegetation pattern, one vegetation specie, a fixed discharge), 12 to 21 water front locations during water release with associated instants were obtained from NIR video analysis (Fig. 3). To simulate the dynamic of these water front locations, we used the unidimensional Calhy model (Bader et al. 2010) initially developed to simulate a border irrigation along a uniform plot. Surface water flow propagation was simulated using the diffusive wave assumption with an added H0 parameter that takes account of a trapped volume of water by bottom micro-topography. To better fit the
observed water front dynamic, the initial Calhy simulation code was also modified with a dual resistance flow layers with a resistance factor (Manning) arbitrary fixed 4 times lower for the upper layer, when water height is higher than 5 cm. Simulation codes and Manning estimation were also processed under the R environment (RDCT, 2005).
3. RESULTS AND DISCUSSION
3.1 Vegetation species and density effect modeling
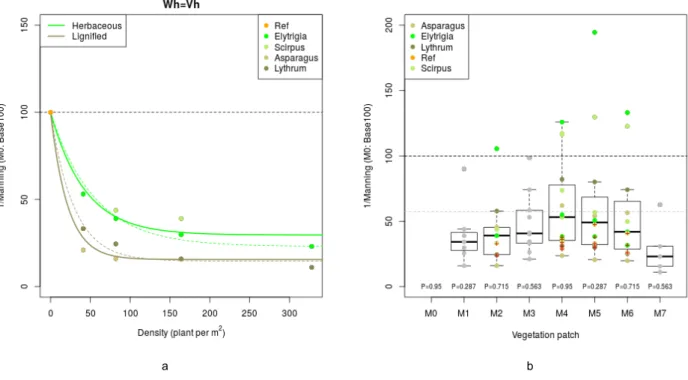
We first decided to model for each discharge, each regime, each specie the inverse Manning parameter (Strickler coefficient) to plant density relationship using a decreasing exponential function (Fig 4-a). This function (Eq. [1]) always starts from the point (0,100m1/3/s), corresponding to a very small roughness (smooth wall), and requires the fitting of two
E-proceedings of the 36th IAHR World Congress, the
Netherlands 28 June – 3 July, 2015, The Hague, the
Netherlands
[1]
where, - x, denotes the plant density (plants.m-2)
- K100, denotes the Strickler coefficient at channel scale, with
base100 corresponding to the M0 patch
- a denotes the attenuation coefficient on the exponential decreasing
- b denotes the asymptotic value of the Strickler coefficient, corresponding to very dense vegetation
As an example, figure 4-a shows Strickler coefficient’s estimates and fitted curve for Elytrigia repens, and Lythrum portula (dotted curve) and the aggregated curve when mixing herbaceous and lignified species (plain curves). As expected, results shows that the increase of Strickler coefficient is much more sensitive to the plant density of the tested lignified species that the herbaceous ones. This may be explained partly by branching complexity and blockage factor (Nepf 2012) which is higher in lignified species. a and b coefficients for aggregated herbaceous and lignified fitted curves are reported in table 1. However, to better explain these differences between curves, estimates of the overall blockage factor induced from plant architecture and branching complexity are necessary.
Table 1. Exponential decreasing coefficients of the the 1/Manning-plant density relationship
WH/VHRATIO DISCHARGE a b HERBACEOUS Wh<<Vh 13.3 l.s-1 173 77 LIGNIFIED Wh<<Vh 13.3 l.s-1 34 58 HERBACEOUS Wh<Vh 13.3 l.s-1 328 37 LIGNIFIED Wh<Vh 13.3 l.s-1 61 66 HERBACEOUS Wh<=Vh 25.3 l.s-1 43 70 LIGNIFIED Wh<=Vh 25.3 l.s-1 21 84 a b
Figure 4. a- Modeling of the plant density – Manning relationship: example of experiments in steady flow regime (25.3 l.s-1),
3.2 Testing the vegetation pattern effect
Figure 4.b shows the distribution of Strickler coefficients for each vegetation patch, including all Wh/Vh ratios, all estimation techniques (steady, unsteady), all plant species, all combined in an unique base100 scale. Estimates using water front position (Wh<<Vh) are delineated with a red cross within points. For each one of the eight patches, a significance test on the effect of patches on the mean values of Strickler coefficients was performed (t-test). Resulting probabilities under null hypothesis (down to figure 4.b) are all of high values. This ANOVA statistical non-significance of the patch effect is not surprising but has to be taken carefully since logical behavior of patch effect are exhibited. When scrutinizing the M4, M5, M6 distributions in comparison to the M2 distribution, having all same overall density at the channel scale, it appears that the regular pattern (M2) shows the highest overall resistance (lowest Strickler coefficient), while the M4 and M5 patterns show the lowest overall resistance. This is meaningful since M4 and M5 pattern favor preferential straight flows without obstacles. M4 pattern gives slightly higher overall resistance factors than the M5 pattern since the smooth cemented bank of the channel offers lower resistance than plant side borders. There is however no evidence of a clear resistance effect of the M6 random pattern. The slightly higher overall resistance factor from M6 compared to M2 may be explained by a preferential flow, with low resistance but sinuous flow that can run between vegetation patches.
4. CONCLUSIONS
In this paper, experiments were conducted in order to identify the resistance factor at channel scale resulting from various non-submerged vegetation patches located at the channel bottom, i.e. vegetation density, vegetation pattern and vegetation specie. Experiments using both steady and unsteady flows were realized, using a specific Near Infra Red (NIR) video for unsteady flow measurements. Roughness coefficients were extracted from backwater curve calibration and flow propagation modeling. Results show that for the herbaceous and lignified species tested, Strickler coefficient is exponentially decreasing with plant density at the channel bottom. Laws for the Manning-plant density relationship for the tested species and for regular patterns of vegetation were given. Despite being not significant statistically, the effect of vegetation patterns having same densities was also shown in this paper.
ACKNOWLEDGMENTS
Authors are grateful to the ONEMA and the INRA institutions who both funded the experimental work exposed in this paper within the 'Fossés Infiltrants et Pesticides' project (ONEMA) and the 'Pari-Scientifique: Hydro-écologie des fossés agricoles' project (INRA-EA department).
REFERENCES
Bader, J.-C., Saos J ;-L., and Charron F. (2010), 'Model of border irrigation runoff, advance and infiltration on a soil covering a very permeable subsoil' Hydrological Sciences Journal–Journal des Sciences Hydrologiques 55.2 (2010): 177-191.
Belcher, S.; Jerram, N. and Hunt, J. (2003), 'Adjustment of a turbulent boundary layer to a canopy of roughness elements.', J. Fluid Mech (488), 369-398.
Cassan, L.; Belaud, G.; Baume, J. & Dejean, C. (2012), Seasonal variation of velocity fields in lined channels: impact on flow measurement, in American Society of Civil Engineers, ed., World Environmental and Water Ressources Congress, 2188-2197.
Dages C, Voltz M, Bsaibes A, Prévot L, Huttel O, Louchart X, Garnier F, Negro (2009) Estimating the role of a ditch network in groundwater recharge in a Mediterranean catchment using a water balance approach. J. Hydrol. (375), 498–512.
Dollinger, J.; Dages, C.; Bailly, J.-S.; Lagacherie, P. & Voltz, M. (Revision), Can ditch management be used in agro-ecological engineering of agricultural landscapes?, Agronomy and sustainable developement.
Freeman, F.; Rahmeyer, W. & Copeland, R. (2000), 'Determination of resistance due to shrubs and woody vegetation', Technical report, U.S. Army Engineer Research and Development Center, Vicksbur, MS..
Guo, J. & Julien, P. Y. (2008), 'Application of the Modified Log-Wake Law in Open-Channels', Journal of Applied Fluid Mechanics 1(2), 17-23.
Jarvela, J. (2005), Effect of submerged flexible vegetation on flow structure and resistance, Journal of Hydrology 307, 233-241.
Jarvela, J. (2002), Flow resistance of flexible and stiff vegetation: a flume study with natural plants, Journal of Hydrology 269(1), 44-54.
Nepf, H. (2012), Hydrodynamics of vegetated channels, Journal of Hydraulic Research 50(3), 262-279.
Nepf, H.; Ghisalberti, M.; White, B. and Murphy, E. (2007), Retention time and dispersion associated with sub-merged aquatic canopies, Water Resour. Res. 43, 1-10.
R Development Core Team (2005). R: A language and environment for statistical computing. R Foundation for Statistical Computing, Vienna, Austria. ISBN 3-900051-07-0, URL: http://www.R-project.org.
Righetti, M. & Armanini, A. (2002), 'Flow resistance in open channel flows with sparsely distributed bushes', J. Hydrol. 269, 55-64.