HAL Id: hal-00710449
https://hal.archives-ouvertes.fr/hal-00710449
Submitted on 20 Jun 2012
HAL is a multi-disciplinary open access
archive for the deposit and dissemination of
sci-entific research documents, whether they are
pub-lished or not. The documents may come from
teaching and research institutions in France or
abroad, or from public or private research centers.
L’archive ouverte pluridisciplinaire HAL, est
destinée au dépôt et à la diffusion de documents
scientifiques de niveau recherche, publiés ou non,
émanant des établissements d’enseignement et de
recherche français ou étrangers, des laboratoires
publics ou privés.
How To Build a Better Testbed: Lessons From a Decade
of Network Experiments on Emulab
Fabien Hermenier, Ricci Robert
To cite this version:
Fabien Hermenier, Ricci Robert. How To Build a Better Testbed: Lessons From a Decade of Network
Experiments on Emulab. TridentCom, Jun 2012, Thessalonique, France. pp.1–17. �hal-00710449�
of Network Experiments on Emulab
Fabien Hermenier1,2and Robert Ricci1
1
University of Utah School of Computing
2
OASIS Team, INRIA - CNRS - I3S, Univ. Sophia-Antipolis fabien.hermenier@inria.fr, ricci@cs.utah.edu
Summary. The Emulab network testbed provides an environment in which re-searchers and educators can evaluate networked systems. Available to the public since 2000, Emulab is used by thousands of experimenters at hundreds of insti-tutions around the world, and the research conducted on it has lead to hundreds of publications. The original Emulab facility at the University of Utah has been replicated at dozens of other sites.
The physical design of the Emulab facility, and many other testbeds like it, has been based on the facility operators’ expectations regarding user needs and be-havior. If operators’ assumptions are incorrect, the resulting facility can exhibit inefficient use patterns and sub-optimal resource allocation. Our study, the first of its kind, gains insight into the needs and behaviors of networking researchers by analyzing more than 500,000 topologies from 13,000 experiments submitted to Emulab. Using this dataset, we re-visit the assumptions that went into the physical design of the Emulab facility and consider improvements to it. Through extensive simulations with real workloads, we evaluate alternative testbeds designs for their ability to improve testbed utilization and reduce hardware costs.
1 Introduction
Network emulation testbeds [2, 3, 11, 15, 14] have become environments of choice for evaluating network research. Their ability to provide highly customizable network topologies make them suitable for hosting a wide variety of experiments, including security, networking, and distributed systems research. One of the oldest and largest, the Utah Emulab facility [5, 8, 15], is currently built from more than 600 nodes having more than 3,000 network interfaces. It gives experimenters full administrator access to their allotted physical nodes and the ability to shape characteristics of dedicated network links. We estimate that worldwide, at least ten thousand experimenters, a substantial fraction of the network research community, use testbeds that are derived from, or similar to, the Utah Emulab facility, and are thus affected by the decisions that have gone into its design. In this paper, we examine user requests submitted to Emulab to gain insight into experimenters’ behavior, and we use this information to inform the physical design of future testbed facilities.
The goals of network testbeds differ from general-purpose clusters, and thus tradi-tional cluster and data center designs cannot be applied directly to this domain. Clusters typically concentrate on maximizing host-based metrics (such as compute power or
I/O operations) with the network playing only a supporting role. In a network testbed, these priorities are reversed: the network is the main object of study, and the physical infrastructure of the testbed must support embedding of a wide variety of experimenters’ requested topologies. It is important to enable embeddings that avoid artifacts due to under-provisioned network links or devices. In most clusters, communications patterns on the network are not explicit; that is, any node may wish to communicate with any other node, and the existence and bandwidths of particular communication paths are not defined a priori. As a result, cluster networks must be provisioned based on measured load or built with full bisection bandwidth. In contrast, the networks in emulation testbeds are explicit, and it is possible to directly study whether the network substrate is capable of meeting the demands that are placed on it. Testbeds also have relaxed requirements for high-availability—downtime due to failure of non-redundant components represents an inconvenience, rather than a large loss of revenue.
Thus, while datacenter networks have received extensive study [1, 7, 9], a different approach is needed for testbed networks. Facilities such as the Utah Emulab [15], DETER [2], and StarBed [11] have independently designed their physical network topologies subject to budgetary constraints and assumptions regarding experimenters’ needs. Such decisions impact the effectiveness of the testbed. Budgetary constraints necessitate tradeoffs between factors such as the number of nodes in a testbed (affecting the number and size of experiments that can be supported) and the degree of connectivity between them (affecting the types of topologies that can be instantiated). If the decisions made during testbed design are mismatched with user behavior, the result is a testbed that either does not meet user needs or is unnecessarily expensive.
Emulation testbeds are now mature enough to provide us with a large dataset showing how experimenters use them in practice; by studying this dataset, we can learn how to build better testbeds. To this end, we have analyzed the network topologies submitted to the Utah Emulab site, the largest and most widely-used emulation testbed, over a period of eight years: from 2003 to 2011.1This dataset consists of over 500,000 network topologies submitted by 500 projects as they ran 13,000 experiments. From our analysis, we form several hypotheses about the most effective ways to build future testbeds, and test these hypotheses with simulations using real workloads.
We begin in Section 2 with a description of the Emulab testbed and the dataset used for our study. In Section 3, we analyze the properties of experimenters’ submitted topologies, including their size and edge-connectivity. Section 4 considers key decisions in the physical design of a network emulation testbed, taking into account the cost implications of these choices. Section 5 evaluates the effectiveness of different testbed designs through extensive simulation using real user-submitted topologies. Finally, Section 6 presents the high-level conclusions that we draw from the study.
2 The Emulab Testbed
To run an experiment on Emulab, a user submits a description written in a variant of the ns-2simulator language [6]. Included in this description is a virtual topology defining
1
the nodes, links, and LANs2on which the experiment is to be run. Emulab realizes this virtual topology on top of the hosts and switches in its physical topology by loading operating systems, configuring software, and creating VLANs.3
One of Emulab’s primary goals is scientific fidelity: it only “accepts” experiments for which it has sufficient capacity. Bottlenecks in the physical topology (such as links between switches) should not lead to artifacts in experiments. Because Emulab is a multi-user facility, this means that interference between simultaneous experiments must be minimized and resources already allocated to other users must be taken into account. Emulab uses assign [12], a randomized solver, to find mappings from experimenters’ virtual topologies onto the testbed’s physical infrastructure. assign ensures that the mappings it produces do not violate constraints such as bandwidth on bottleneck links, and attempts to maximize the potential for future mappings by avoiding scarce resources when possible. Most experiments run on Emulab use “bare hardware” with a one-to-one mapping between nodes in the virtual topology and physical hosts. For the purposes of this paper, we refer to these as “isolated experiments.” Emulab also supports “multiplexed experiments,” in which multiple virtual machines can be placed on each physical host. Multiplexed experiments are less popular than isolated ones because Emulab users typically want high fidelity and low-level access to hardware. The primary use of multiplexing is to run experiments that are too large to be instantiated one-to-one on the testbed’s limited physical resources.
Emulab’s physical topology has two networks: each node connects to both. The first is a “control” network, over which testbed control tasks such a disk loading and network filesystem mounts occur. This network connects to the Internet, and is used for remote access to the nodes. The second is the “experimental” network: this network is isolated from the outside and is re-configured as needed to create the experimenter’s virtual topology. In this paper, we focus on the experimental network, as it is the one in which the experimenter’s topology is embedded, and which must be sufficiently provisioned to ensure scientific fidelity. Emulab supports “delay” nodes for traffic shaping on the experimental network: when an experiment requests a link with non-zero latency or with a bandwidth value not natively supported by Ethernet, Emulab inserts a node acting as a transparent bridge. These nodes bridge two interfaces together using FreeBSD’s dummynet [13] to delay packets or limit their bandwidth. Because delaying a single link requires only two interfaces, physical nodes having an even number of interfaces can delay multiple links.
The Emulab facility at Utah has grown organically over the past twelve years: from an initial set of 10 nodes, it has now grown to approximately 600, connected by thirteen Ethernet switches. Nodes have been added over time in large, homogeneous batches, and old nodes are rarely removed from service. Most nodes have four connections to the experimental network. The rationale behind the use of homogeneous node groups is to achieve a high degree of flexibility: the more interchangeable nodes are, the more freedom there is in resource assignment. Old nodes are kept under the assumption that
2
For Emulab’s purposes, a LAN is defined as a clique of nodes with full bisection bandwidth.
3
In this paper, we concentrate on Emulab’s most heavily used resource: a “cluster” testbed made up of PCs and Ethernet switches. Emulab also supports a wide range of other physical devices, including wireless links, network processors, wide-area hosts and links, and Layer 1 switches.
since network researchers are interested primarily in the network, most can tolerate older, low-powered hosts. Emulab’s physical topology is tree-like: because there is no need for redundancy, there is only a single path between any pair of switches. It is built primarily with large modular switches (supporting up to 384 ports per chassis), because full bisection bandwidth can be provided for modest cost within one switch. Emulab does not attempt to provide full bisection bandwidth across its entire physical topology due to the high cost of doing so. Instead, it relies on assign to map experiments in such a way as to minimize the use of inter-switch links, and rejects experiments that cannot fit within these limits. Switch interconnects are generally built from interfaces one order of magnitude faster than the node interfaces. For example, switches providing 100 Mbps Ethernet to nodes are interconnected using four to eight 1 Gbps ports, and gigabit switches are interconnected using four 10 Gbps ports. Older Emulab nodes have all interfaces connected to a single switch, while newer ones are “striped” across multiple switches as described in Section 4.
The Utah Emulab is one of the oldest and largest facilities of its kind, and its design has influenced many other facilities. Other testbeds built using the Emulab software [14], including DETER [2], use a similar physical topology. Unrelated testbeds, such as StarBed [11] and Grid’500 [3], also use fundamentally similar physical topologies.
2.1 Description of the dataset
Each time a user creates, deletes, or modifies an experiment, Emulab records the action in a database and puts the resulting topology in an archive file. We extract from these records a raw dataset containing 619,504 topologies submitted by experimenters since 2003. These topologies are grouped into 22,266 different experiments: in Emulab, a single experiment may be instantiated on the testbed many times, because users typically release resources when not in active use. The experiments belong to 522 projects. A project is a group of experimenters collaborating on the same research topic, from the same lab, or in the same class.
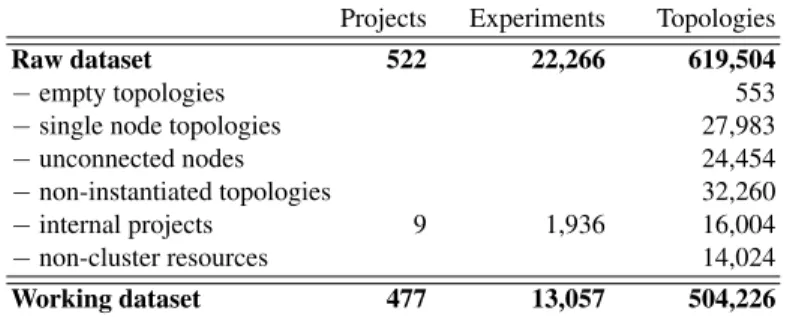
Not every topology is relevant to our study, so we reduced the raw dataset in several ways. First, some topologies request only a single node or no network links. Such topologies are used by experimenters who are not studying the network, or to test the deployment of specific applications or operating system images in preparation for larger experiments. They are not relevant to the design of the testbed’s physical network, so we ignore them for this study. Second, Emulab provides users with the ability to create or modify experiments without instantiating them on the physical hardware, and we excluded such topologies. Third, the operators of the testbed have several internal projects. As such projects are not representative of general research needs, we have excluded them. Finally, some experiments use resources that are not part of the main cluster testbed, such as wireless nodes or wide-area hosts embedded in campus or backbone networks [4]. While important, these types of experiments have little effect on the design of the cluster network, so we removed them from our study. Table 1 details the filtering performed to produce a working dataset composed of 477 projects, 13,057 experiments, and 504,226 topologies.
Table 1. Refinement performed on the raw dataset to form the working dataset Projects Experiments Topologies Raw dataset 522 22,266 619,504 − empty topologies 553 − single node topologies 27,983 − unconnected nodes 24,454 − non-instantiated topologies 32,260 − internal projects 9 1,936 16,004 − non-cluster resources 14,024 Working dataset 477 13,057 504,226
3 Properties of experimenters’ topologies
We begin our study by analyzing the topologies submitted by experimenters, concentrat-ing on the properties that directly affect testbed design: the topologies’ sizes, the types of nodes they request, and their connectivity.
3.1 Most experiments are small
Figure 1 shows the distribution of experiment sizes in the dataset. The first fact evident from this figure is that most experiments are small: 80% of the isolated experiments use fewer than 20 nodes. There is a small, but significant, tail of large experiments: 4% (more than 20,000 topologies) requested 100 nodes or more. The large topologies belonged to 514 different experiments in 68 different projects, so while large experiments represent a small fraction of all experiments, 14% of projects run at least one. We believe this is because many projects conduct many small experiments in preparation for a few large ones. For example, they may run several experiments to develop and debug a distributed system before evaluating it at scale. Only 5% of experiments are multiplexed, but these tend to be large: 20% have 200 nodes or more. As a result, multiplexed nodes actually represent a sizable fraction (31%) of all node requests.
2 10 100 0 20 40 60 80 100
Topology size (log scale)
% of e
xper
iments
Isolated topologies Multiplexable topologies
Fig. 1. Distribution of the number of nodes in experiments (note log-scale X axis)
0 100 200 300 400 500 600 0 20 40 60 80 100 Topology size Acceptance r ate Isolated topologies Multiplexable topologies
Fig. 2. Percentage of experiments accepted by experiment size
When a user submits an experiment to Emulab, it is “accepted” if there are enough nodes and network resources free to instantiate it. Otherwise, it is “rejected.” Figure 2
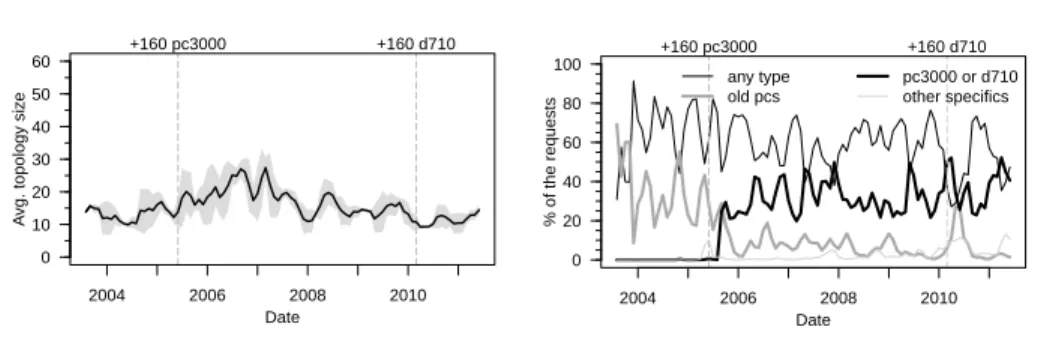
0 10 20 30 40 50 60 2004 2006 2008 2010 +160 pc3000 +160 d710 Date A vg. topology siz e
Fig. 3. Average isolated topology size; shaded region is the 95% confidence interval
+160 pc3000 +160 d710 2004 2006 2008 2010 0 20 40 60 80 100 Date % of the requests any type old pcs pc3000 or d710 other specifics
Fig. 4. Types of nodes requested by experi-menters over time
shows the percentage of experiments that were accepted as a function of the experiment’s size. We first observe the acceptance rate for isolated topologies is fairly low, even for small topologies: only 50% of submissions with 20 nodes are accepted, despite the fact that such a topology only uses 3% of the testbed. This shows that the testbed is used heavily, and frequently does not provide sufficient free resources to admit even small experiments. In order to cope with resource scarcity, some users turn to multiplexed experiments, deploying many VMs on the same physical node. Because they use fewer physical nodes, these experiments have a much higher acceptance rate, and even allow experiments larger than the physical testbed. Other users reduce the sizes of their experiments to increase the chance they will be accepted.
3.2 Attractive physical nodes are the bottleneck resource
The Utah Emulab facility has gone through several major hardware expansions over its lifetime. Two such expansions occurred during the time covered by our dataset: in June 2005, 160 pc3000 nodes were added, approximately doubling the size of the testbed and bringing the first Gigabit Ethernet to Emulab. In early 2010, 160 d710 nodes were added, giving Emulab its first multi-core processors and greatly expanding its number of Gigabit network interfaces.
One objective of the expansions was to support the deployment of larger experiments. As we can see in Figure 3, the expansion in 2005 was somewhat successful in meeting this goal: for nearly two years, the average experiment size grew slowly and reached almost double the pre-expansion size. Eventually, however, the modern nodes attracted more users, forcing experiment sizes back down. The expansion in 2010 was less successful in this regard for three reasons. First, this expansion increased the testbed size by only 50%, in contrast with the doubling in 2005. Second, the rollout of the new nodes was gradual, with a period of limited release before they were made available to all users. Third, Emulab had long ago reached a saturation point, with utilization of over 90% being common, so the new nodes did little to alleviate this pressure: they simply allowed more experiments to be accepted.
Emulab allows users to request specific node types (such as pc3000 or d710), or to simply request nodes of any available type. Figure 4 shows how these requests have evolved over time. The Utah Emulab facility has kept all old nodes in service after expansions, with two goals in mind: to keep the testbed as large as possible, and to
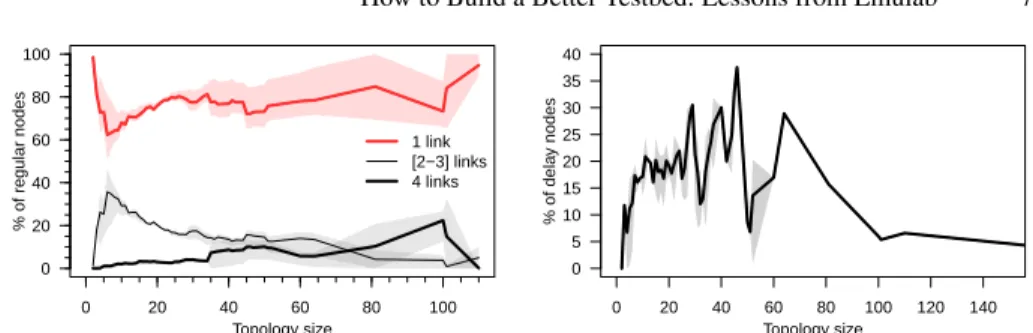
0 20 40 60 80 100 0 20 40 60 80 100 Topology size % of regular nodes 1 link [2−3] links 4 links
Fig. 5. Network interfaces per node
0 20 40 60 80 100 120 140 0 5 10 15 20 25 30 35 40 Topology size % of dela y nodes
Fig. 6. Percent of delay nodes per experiment
support reproduction of results published using these nodes [5]. However, can be seen in the graph, specific requests for old nodes types have dropped near zero. Requests for “any” node type have declined slowly but steadily, presumably because users do not wish to be allocated the oldest nodes, which are now over a decade old. We conclude that the cause of the high rejection rates seen in Section 3.1 is not simply lack of available nodes, but more specifically a lack of attractive nodes.
3.3 Most requests use few interfaces
Emulab was built with fairly homogeneous node connectivity: with the exception of some d710s, most nodes have four interfaces available for experiments. The rationale behind this design was maximum flexibility: large blocks of identical nodes greatly simplify resource allocation. However, as we can see in Figure 5, requests using many interfaces are uncommon—the majority of requested nodes have only a single interface. This is in keeping with typical networks containing many edge hosts, which are typically not multihomed. The result, however, is that most interfaces in Emulab go unused most of the time. It is interesting to note that the popularity of 4-interface nodes grows up to experiments of size 100, then drops off sharply. Topologies at or right under 100 tend to be large trees, while topologies larger than 100 nodes are dominated by LANs, which require only one interface per node. It is also worth noting that users have clearly adapted to the physical constraints of the testbed: nearly all user requests have four or fewer interfaces. While some topologies requested five or more interfaces, the number was negligible, and is not shown in the figure. Anecdotal evidence suggests that if higher-degree nodes were available, some users would take advantage of them, but this effect cannot be measured from our dataset.
Figure 6 shows that delay nodes represent a significant proportion of the requests: up to 50 nodes, delay nodes represent 10% to 40% of the total. This not only shows that experimenters are interested in traffic shaping, but also the necessity of having numerous physical nodes with at least two network interfaces to act as delay nodes. We also observe that use of delay nodes decreases for large experiments. We believe this to be caused by two factors. First, as seen in Section 3.1, larger experiments are harder to instantiate, and removing delay nodes is one way of keeping the experiment size down. Second, multiplexed experiments are more common at large sizes, and these experiments perform traffic shaping on the hosts rather than using delay nodes.
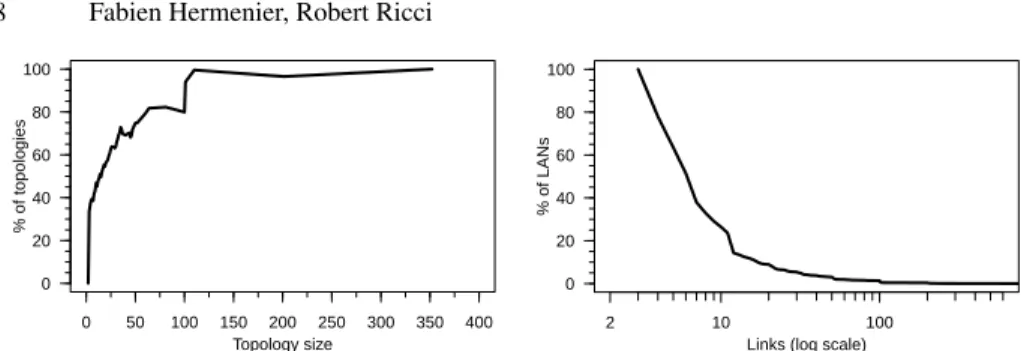
0 50 100 150 200 250 300 350 400 0 20 40 60 80 100 Topology size % of topologies
Fig. 7. Percentage of topologies having LANs
2 10 100 0 20 40 60 80 100
Links (log scale)
% of LANs
Fig. 8. Distribution of LAN size
3.4 LANs are common, but most are small
LANs are of particular interest to testbed design: because they require full bisection bandwidth, they are much more difficult to instantiate than topologies comprised of links alone. Figure 7 shows the percentage of experiments that include at least one LAN. Figure 8 depicts the distribution of the sizes of those LANs. The most striking feature of Figure 7 is the fact that LANs dominate large experiments. Even at smaller sizes, they are quite common: 40% of 8-node experiments use at least one LAN. LANs are indeed primary components in many real networks, and experimenters who want representative topologies must consider these components when designing their experiments. While some experiments consist solely of a single LAN containing all nodes, this is not the dominant use case for LANs: only 20% of the experiments that contain them take this form. Finally, we observe from Figure 8 that a majority of LANs are small in practice: only 10% of LANs interconnect 20 or more nodes. This is explained by the small average experiment size.
4 Key considerations for network testbed design
Having seen the types of topologies that users submit to Emulab, we now turn our attention to the design of the physical facility: a well-designed facility should be matched to the types of experiments that are submitted to it.
4.1 A cost model for physical nodes
We begin with a model for the cost of a testbed’s hardware. Of course, minimizing cost may not be the only factor influencing a testbed’s design. It may be desirable, for example, to support certain rare but important types of experiments, even if the monetary cost of doing so is high. Nevertheless, it is important to understand the effect of design decisions on facility cost so that these decisions can be made with full awareness of their effect on the testbed’s budget. In addition, spending limited money to support certain types of experiments may limit the type or quantity of other experiments that the testbed can support.
Our cost model takes into account all factors involved in the purchase of new nodes, including not only the nodes themselves, but also network interfaces, switches, inter-switch connectivity, infrastructure servers, racks, cabling, and power distribution. Prices
0 50 100 150 200 250 300 350 0 1 2 3 4 5 6 7 8 Physical nodes Unit cost ($1,000) 8 links / node 4 links / node 2 links / node 1 link / node
(a)Average node cost
0 50 100 150 200 250 0 1 2 3 4 5 6 Physical nodes Unit cost ($1,000) 264−port switches 48−port switches
(b) Impact of switch size on 4-link nodes Fig. 9. Cost per node to build a testbed using a budget of up to $1M
for these items were determined from current market rates. An important consideration is that while nodes can be purchased individually, most supporting hardware must be purchased in larger units: for example, one rack may hold 20 servers, and a modular switch requires the purchase of a chassis plus some number of line cards. The result is that the average cost per node is not a simple linear function of the number of nodes, but instead exhibits a “sawtooth” pattern as seen in Figure 9(a). This figure also shows the effect of varying the number of interfaces per node: adding more interfaces both increases the cost (due to the expense of switch ports) and shortens the period of the sawtooth (as additional switches must be purchased more often).
Clear “sweet spots” are present in the graph, though their effects become less pronounced as the number of nodes increases. On a small scale, connectivity is not a large factor in average node cost: when purchasing 10 nodes, a node with four links costs only 14% more than a node with one link. At this scale, a strongly-connected testbed is warranted. At larger scales, the amortization of infrastructure costs results in a price more strongly influenced by connectivity: when purchasing 100 nodes, the difference between these two configurations widens to 30%. With a $1M budget, choosing one link rather than four allows the purchase of 100 additional nodes. As a result, large testbeds must plan their connectivity carefully to avoid spending money on unneeded interfaces. A critical parameter to the cost model is the type and size of switches. Figure 9(b) compares two types of switches: a modular switch supporting up to 284 ports with 24-port modules, and a fixed-configuration switch supporting 48 ports. All switch ports that connect to nodes are 1 Gbps, and ports used for interconnects to other switches are 10 Gbps. The large switches have four 10 Gbps interfaces (leaving 264 ports available for the nodes), and the small switches have two.4 Using smaller switches results in significant cost savings: 30% on average, and for a budget of $1M, a testbed built with small switches can acquire 70 additional nodes. The penalty is that the “islands” of full bisection bandwidth are much smaller, putting more demand on the interconnects between switches. As a result, a small-switch testbed will be unable to host large LANs and some strongly-connected topologies.
4
1 2 3 4 5 6 7 8 [1−4] links / node [1−6] links / node [1−8] links / node 0 20 40 60 80 100
k−links physical nodes
Usage %
(a) Distribution of links on three heterogeneous testbeds; error bars show standard deviation
250 500 750 1000 4 links / node [1−4] links / node [1−6] links / node [1−8] links / node 0 50 150 250 350 Budget ($1,000) Ph ysical nodes
(b) Size of the testbed with respect to node con-nectivity.
Fig. 10. Impact of nodes’ connectivity on testbed size
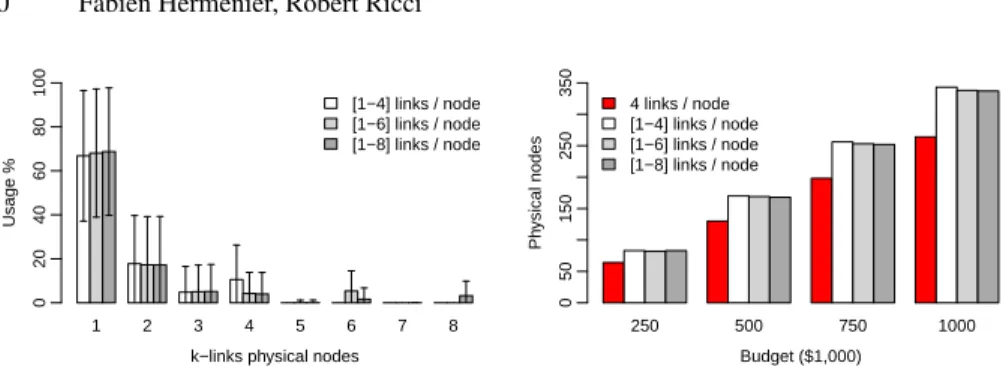
4.2 Heterogeneous node connectivity enables larger testbeds
We now expand our model to consider configurations in which nodes have heterogeneous connectivity: some nodes have more interfaces than others. To do so, we ran a series of simulations. In each simulation, a set of experimenters’ virtual topologies are mapped onto a physical testbed of infinite size. Nodes in testbed have differing numbers of physical interfaces, and each virtual node is mapped to a physical node having the minimum number of interfaces needed to satisfy it. We look at the resulting distribution of physical interfaces used by the mapping; this gives us a rough guideline of how many nodes of each type to include in a heterogeneous testbed. Figure 10(a) shows these distributions for three different testbeds: one having one to four interfaces per node, another having one to six, and a third having one to eight. On average, 67% of the physical nodes used have one interface, 20% have two interfaces, and very few nodes with more interfaces are needed. This correlates with our earlier statistics in Section 3.3, showing that nodes with few interfaces dominate testbed use.
We then construct testbeds using our previous cost model with different nodes having different numbers of interfaces. We use the distribution from Figure 10(a) to select the proportion of the physical nodes having each number of interfaces. Within a fixed budget, more nodes can be acquired, as the majority will only have a few links. Figure 10(b) compares the size of a homogeneous testbed with testbeds built using the heterogeneous distributions from Figure 10(a). The heterogeneous testbeds enable us to acquire 25% more nodes using the same budget. The gain is slightly reduced when the testbed is composed of nodes having more than four links. However, the loss is not significant as the number of high-interface nodes is small. Nodes with six or eight experimental links may be still useful in Emulab to support future users’ needs.
4.3 Alternatives for switch connectivity
Because providing full bisection bandwidth across the entire network is prohibitively expensive, bandwidth between switches (interswitch bandwidth) becomes a critical resource in distributed infrastructure [1, 7]. In a network testbed, it is important to avoid oversubscription of these bottleneck links, which can lead to capacity artifacts and harm
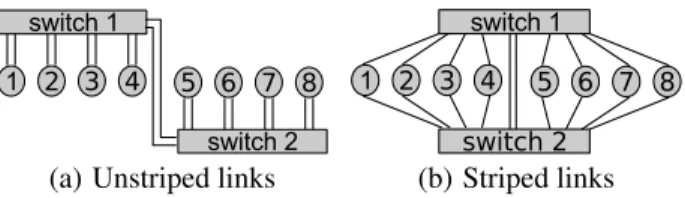
(a) Unstriped links (b) Striped links
Fig. 11. Two network topologies connecting eight nodes, each with two gigabit interfaces
the scientific fidelity of the facility. Interswitch bandwidth imposes limits on the size of experiments that the testbed can host, and on LAN sizes in particular.
A traditional way to increase interswitch bandwidth is to purchase faster interconnects between the switches. This strategy, however, quickly becomes expensive. Because of their large number of network interfaces and explicit communications channels, an alternative strategy is available to network testbeds. This strategy is to stripe nodes’ links across multiple switches; rather than connecting all of a node’s interfaces to the same switch (as shown in Figure 11(a)), a node’s interfaces are distributed across different switches, as shown in Figure 11(b). In a traditional datacenter network, a node may be connected to two switches for redundancy. Interface striping in a network testbed involves more interfaces per node and has a different purpose: it serves to align the switch connectivity with communication patterns. Intuitively, the motivation for connecting two interfaces to the same switch, rather than different switches, is to take advantage of the high bisection bandwidth within the switch. Two interfaces on the same node, however, rarely have a need to exchange traffic among themselves. It is much more likely that they will be connected to interfaces on other nodes, and striping ensures that, for any pair of nodes, there exists at least one switch on which both nodes have an interface. The result is a greatly decreased dependence on interswitch links and the ability to create large LANs, potentially connecting every node in the testbed. A disadvantage of striping is that it limits the number of nodes in the testbed to the maximum available switch size. Another disadvantage is that heterogeneous interface counts become more complicated to support, as they disrupt the symmetry of the striping.
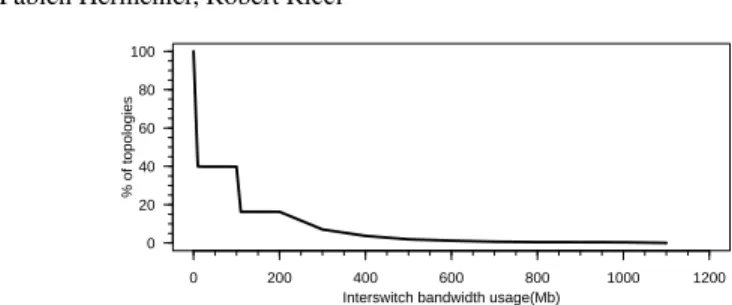
We ran a simulation to discover how much interswitch bandwidth is used in practice on Emulab. We used the physical topology of Emulab’s 160 pc3000 nodes, which are connected in an unstriped manner to two large switches connected by an 8 Gbps trunk. Our simulation re-played the user requests for the pc3000 nodes: after mapping each user topology to the testbed using Emulab’s assign program, we examined the amount of bandwidth allocated on the interswitch trunks. The original submission time for each experiment was preserved, and we assumed that each experiment stayed instantiated on the testbed for 24 hours.
Figure 12 shows the distribution of allocated interswitch bandwidth after each experiment is instantiated. We observe the usage is significantly below the maximum capacity of 8 Gbps: the maximum usage is 1.1 Gbps, and only 3% of instantiations result in consumption of more than 1 Gbps. The domain features of network testbeds explain this surprising result. Emulab relies on large switches with hundreds of ports to connect physical nodes. With 80% of submitted topologies being composed of fewer than 20 nodes, the probability of being able to fit a requested topology within a single switch are
0 200 400 600 800 1000 1200 0 20 40 60 80 100
Interswitch bandwidth usage(Mb)
% of topologies
Fig. 12. Interswitch bandwidth between the switches connecting the pc3000 nodes
high. Furthermore, assign optimizes each topology mapping to keep the interswitch bandwidth usage as low as possible. This result suggests that it is worth investigating testbeds built with smaller switches. While such testbeds would rely more heavily on interswitch links, and possibly be unable to support some large experiments, the large switch topology is clearly over-provisioned in this respect. Since small switches typically cost much less than large ones, the savings would allow the testbed to add more nodes.
5 Evaluating testbed designs
We now combine the lessons of the two previous sections to evaluate new testbed designs: using information about users’ requests and the costs of alternative topologies, we run simulations to find the topologies that are most effective on real workloads. The workload used for these simulations is a subset of the entire Emulab dataset: we use the 14,873 topologies that specifically requested Emulab’s pc3000 nodes. We chose this subset to limit the runtime of the simulation, and to capture what could be considered a “sub testbed” of the full Emulab topology. This workload is processed through a FIFO batch queue and resource mappings are produced by Emulab’s assign program. If resources are available, the experiment in the front of the queue is instantiated on the testbed, and those resources are marked as unavailable; otherwise, the queue blocks until sufficient resources are available. After instantiation, each experiment stays on the testbed for 24 hours of simulated time before terminating. We submit all experiments simultaneously at beginning of the simulation, and measure the total amount of simulated time until all experiments have been completed. We also measure the rejection rate: that is, the number of virtual topologies that cannot be mapped to the physical testbed under any conditions. This occurs when the physical topology being evaluated does not contain enough physical nodes, a sufficient distribution of interfaces, or satisfactory inter-switch bandwidth. This measure is important, since rejecting a large number of topologies would keep the completion time low, but indicate that the testbed does not meet the needs of at least some experimenters.
5.1 Heterogeneous node connectivity
As discussed in Section 3.3, most nodes in virtual topologies have few network interfaces, and the cost model in Section 4.1 shows us that it is possible to trade off fewer physical interfaces for more physical nodes. Choosing a distribution for network interfaces is
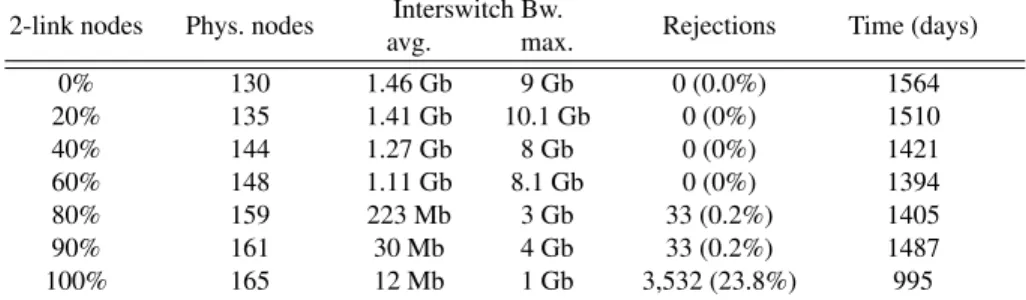
Table 2. Simulation results for seven generated testbeds that differ in the proportion of two-interface and four-two-interface nodes. The “0%” case is similar to the topology of the Utah facility
2-link nodes Phys. nodes Interswitch Bw. Rejections Time (days) avg. max. 0% 130 1.46 Gb 9 Gb 0 (0.0%) 1564 20% 135 1.41 Gb 10.1 Gb 0 (0%) 1510 40% 144 1.27 Gb 8 Gb 0 (0%) 1421 60% 148 1.11 Gb 8.1 Gb 0 (0%) 1394 80% 159 223 Mb 3 Gb 33 (0.2%) 1405 90% 161 30 Mb 4 Gb 33 (0.2%) 1487 100% 165 12 Mb 1 Gb 3,532 (23.8%) 995
a critical decision for improving the testbed’s hosting capacity, but it is important to balance cost against variability in the workload. We evaluated the suitability of seven simulated testbeds which differ in the number of interfaces on each physical node. Each testbed was generated from the cost model using a $500,000 budget. Each has a different proportion of nodes having either two or four Gigabit Ethernet links on the experiment network. Interfaces are not striped across switches, and the inter-switch bandwidth capacity is set to 40 Gb (modeling four trunked 10 Gb ports). The configuration having only 4-link nodes is similar to that used on the Emulab facility at Utah.
Table 2 details the results. As expected, the number of physical nodes in the testbed increases with the proportion of nodes that have two links. For example, with 20% of nodes having two links, the testbed is 5 nodes larger than when all nodes are 4-link nodes. Around a proportion of 80%, 4-link nodes become scarce resources and experiments start to be rejected for requesting too many nodes with more than two links. When we increase the percentage of 2-link nodes to 90%, no additional topologies are rejected, but the completion time is increased by 5.8%. The small number of 4-link nodes is sufficient to map the same set of topologies, but because these nodes are scarcer, some topologies must wait a long time for them to become free, blocking the queue. In the extreme case, a testbed comprised of only 2-link nodes rejects nearly one quarter of all experiments.
We also observe that increasing the number of nodes with two interfaces reduces the average interswitch bandwidth usage. This is explained by the increasing number of physical nodes attached to the same switch. When all nodes have four links, a 264-port switch connects 66 nodes; when all nodes have two links, 132 nodes fit onto each switch. Thus, the probability that a topology is able to fit within a single switch increases with the percentage of 2-link nodes.
In this experiment, the testbed with a 60%/40% split between two- and four- link nodes is the most efficient: the 18 additional nodes afforded by this configuration reduces the completion time by 10.8% while still being able to host every topology in the workload.
5.2 Switch connectivity
We now evaluate the alternate switch topologies from Section 4.3: striping the interfaces of each node across more than one switch, and building a testbed out of small 48-port
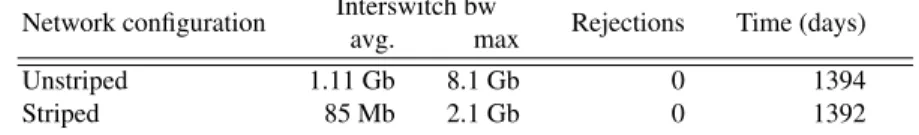
Table 3. Simulation results for two generated testbed topologies, with and without interfaces striped across the switches
Network configuration Interswitch bw Rejections Time (days) avg. max
Unstriped 1.11 Gb 8.1 Gb 0 1394 Striped 85 Mb 2.1 Gb 0 1392
switches. We compare to the best design from the previous evaluation, a heterogeneous testbed with a 60%/40% split. As before, all testbeds are built with a budget of $500,000. Table 3 shows the impact of a striped physical topology using two switches, with each node having two interfaces on each switch. Neither configuration rejects any experiments, and the difference in total completion time is negligible. The striped configuration uses much less interswtich bandwidth, giving it a clear advantage—only 7.7% as much on average, and 26% at the maximum. However, both configurations result in interswitch bandwidth comfortably below even a single 10 Gb link, meaning that from a practical perspective, either is capable of handing the workload in our simulation. Striping still has the potential to be advantageous if the submitted topologies are more strongly connected than those typically seen on Emulab. It can also provide a benefit if the cost of interconnects is high, as is the case when using the latest, and therefore most expensive, generation of Ethernet technology. Finally, striped connectivity is also meaningful when the ratio of node ports to interswitch ports is high. This can occur when when using large, high-density switches or small fixed-configuration switches with a limited number of “uplink” ports.
It can be difficult in practice to map virtual topologies to striped physical facilities. We repeated our previous simulation with five interfaces per node, necessitating an asymmetric striping pattern—each node had two interfaces on one switch and three on the other. The result of this experiment was a marked increase in the interswitch bandwidth used, to 800Mb. This can be explained by the fact that the irregularity introduced by asymmetric striping makes the mapping problem harder, and Emulab’s solver, assign has not been tuned for this case. Making effective use of an asymmetric striped topology would require a new mapping algorithm.
We next turn our attention to the size of the switches used to build the testbed. As we have seen in Section 4.3, connectivity in Emulab experiments tends to be sparse, so small, cheap, switches may be an economical alternative to the large switches used in the Utah Emulab facility. The first two rows of Table 4 show simulations for two testbeds using 264-port and 48-port switches, respectively. As expected, the cheaper 48-port switches allows us to acquire more physical nodes, and the resulting testbed is 27% larger. However, we observe that 138 topologies (1%) were rejected as being unable to be fit on this testbed. An analysis of the rejected topologies confirms they were composed of LANs with more than 30 virtual nodes; these LANs fit on a single switch in the large-switch configuration. 85 of the rejections (60% of the total) were due to actual capacity limitations, while the remaining 57 are due to the fact that assign sometimes misses valid solutions due to its randomized, heuristic nature.
The greater number of nodes in the small-switch testbed allows the workload to complete 28.5% faster. The cost of providing a network capable of hosting sizeable LANs
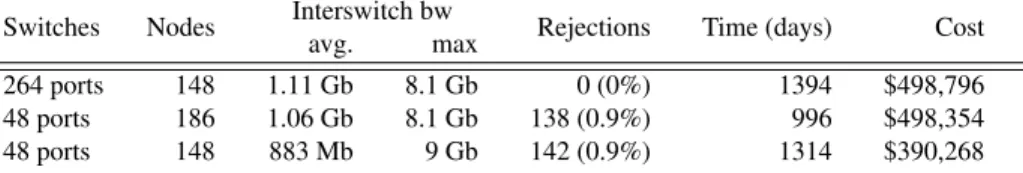
Table 4. Simulation results for testbeds using an 60%/40% split of two- and four-link nodes. 264-port switches and 48-264-port switches are connected through 40 GB and 20 GB uplinks, respectively
Switches Nodes Interswitch bw Rejections Time (days) Cost avg. max
264 ports 148 1.11 Gb 8.1 Gb 0 (0%) 1394 $498,796 48 ports 186 1.06 Gb 8.1 Gb 138 (0.9%) 996 $498,354 48 ports 148 883 Mb 9 Gb 142 (0.9%) 1314 $390,268
is an increase in the completion time. Viewed from this perspective, when spending $500,000, the use of large switches allows us to host 1% more topologies, but at the cost of increasing the completion time of the whole workload by 40%.
In order to estimate the monetary cost of supporting this 1% of experiments, we ran another simulation, shown in the third row of Table 4. This time, we used small switches, but limited the number of nodes to 148, the number in the large-switch testbed. The result was a cheaper testbed, costing only $390,000. As with the previous simulation, the use of 48-port switches restricts the testbed’s hosting capacity, and 142 topologies were rejected.5Comparing this configuration to the large-switch testbed, we see that the
completion times are similar.6 As both testbeds have the same number of nodes, this
confirms that the network is the bottleneck that causes some experiments to be rejected. The usage of small switches reduces the testbed cost by $108,000. Thus, we can estimate that supporting these 142 experiments (0.95% of the total) raises the testbed cost by 28%. Put another way, the “easiest” 99% of experiments cost on average $33.5 each, while the “hardest” 1% cost $760.7 each. Note that these experiment costs should be interpreted as illustrative, rather than true costs: since our simulations only cover 6 years (less than the useful life of a node) and use a simple model for experiment duration, they should not be considered definitive costs.
The conclusion we draw from these simulations is that testbed design should take into consideration the relative costs of supporting certain types of experiments, and the research value of such experiments (in particular, large LANs) should be weighed against their increased infrastructure costs.
6 Conclusions
From our analysis of user topologies and simulations of alternative physical topologies, we draw the following conclusions:
While experiments requiring few nodes dominate testbed usage, there is also a significant contingent of users who want to deploy experiments that are quite large. The latter class of experimenters are likely limited by the number of nodes available on a shared-use testbed. The fraction of projects using at least one large experiment is greater than the fraction of experiments that are large, suggesting that projects use many small experiments to prepare for a relatively small number of large trials.
5
The difference with the previous experiment is explained by the nondeterminism of assign.
6The slightly higher time for the large-switch testbed is explained by the fact that it runs more
A physical testbed topology need not have full bisection bandwidth; on the contrary, a testbed is able to meet its users’ needs with a surprisingly small amount of bandwidth between switches. This makes building testbeds out of small, cheap, switches more attractive than expected. The exception to the low edge-connectivity rule is large LANs, which are employed by some experimenters. This implies that a testbed built from small switches may find value in one large switch to support these LANs.
Striped topologies reduce the need for inter-switch connectivity.Though it is possible to build a testbed with modest bisection bandwidth even without striping, a striped configuration aligns the physical topology with common communication patterns, and can reduce the need for inter-switch bandwidth even further. The tradeoff is a more diffi-cult mapping problem, requiring further work to use this configuration with maximum efficiency.
Nodes with few links are prevalent in users’ requests.The result is that a homoge-neous testbed, with an equal number of physical interfaces per node, makes inefficient use of resources. By varying the number of interfaces per host, it is possible to build a larger testbed, a cheaper testbed, or one with a significant number of high-degree nodes. The savings from heterogeneous node connectivity vary with the scale of the testbed. For large testbeds, many costs amortize, and the cost of network ports becomes a dominant factor. Giving some nodes fewer interfaces results in substantial cost benefits. For small testbeds, this effect is much less pronounced, and a homogeneous testbed is preferable for its flexibility.
Some experiments require a more expensive testbed than others,so care should be taken when planning a testbed to decide how valuable these experiments are. In our simulations, we found that if Emulab were to intentionally exclude the 1% most “difficult” experiments, it could save 25% of hardware costs or could build a 32% larger testbed.
While users know what topologies they want, they also quickly learn the limitations of the testbed, and tend to adapt their expectations to what is realistic to instantiate on it. For example, experimenters rarely request more network interfaces than Emulab nodes have. This is in keeping with earlier studies finding similar effects on the Internet infrastructure: the degree of connectivity of Internet routers is heavily influenced by available commercial offerings [10]. Experimenters also decrease the sizes of their experiments when nodes are scarce.
Multiplexed experiments are used primarily to support very large topologies.Though multiplexed experiments represent only 5% of submitted topologies, their large average size means that they account for 31% of all nodes allocated by Emulab, making them an important resource. The implication is that most users prefer “bare hardware,” but are willing to tolerate virtualization in order to run large experiments. Testbeds aiming to appeal to the widest possible userbase should support non-virtualized experimenta-tion, those aiming to support large experiments should support virtualizaexperimenta-tion, and for maximum flexibility, it is desirable to support both.
In the Utah Emulab facility, demand always exceeds capacity, and expansions to the testbed hardware are met with increased usage. As a result of Emulab’s “first come, first serve” policy, users tend towards small experiments. In order to support larger experiments, a testbed would need to be either significantly over-provisioned (and
thus expensive and inefficient), or to implement allocation policies (such as advance scheduling) that favor large experiments.
References
1. M. Al-Fares, A. Loukissas, and A. Vahdat. A scalable, commodity data center network architecture. In Proceedings ACM SIGCOMM, 2008.
2. T. Benzel, R. Braden, D. Kim, C. Neuman, A. Joseph, K. Sklower, R. Ostrenga, and S. Schwab. Experience with DETER: a testbed for security research. In Proceedings of Tridentcom, 2006. 3. R. Bolze, F. Cappello, E. Caron, M. Daydé, F. Desprez, E. Jeannot, Y. Jégou, S. Lanteri, J. Leduc, N. Melab, G. Mornet, R. Namyst, P. Primet, B. Quetier, O. Richard, E.-G. Talbi, and I. Touche. Grid’5000: A large scale and highly reconfigurable experimental grid testbed. Int. J. High Perform. Comput. Appl., 20:481–494, Nov. 2006.
4. J. Duerig, R. Ricci, L. Stoller, G. Wong, S. Chikkulapelly, and W. Seok. Designing a federated testbed as a distributed system. In Proceedings of Tridentcom, June 2012.
5. E. Eide, L. Stoller, and J. Lepreau. An experimentation workbench for replayable networking research. In Proceedings of NSDI, 2007.
6. K. Fall and K. Varadhan, editors. The ns Manual. Nov. 2011.
7. C. Guo, G. Lu, D. Li, H. Wu, X. Zhang, Y. Shi, C. Tian, Y. Zhang, and S. Lu. BCube: a high performance, server-centric network architecture for modular data centers. ACM SIGCOMM Computuer Communication Review, 39:63–74, Aug. 2009.
8. M. Hibler, R. Ricci, L. Stoller, J. Duerig, S. Guruprasad, T. Stack, K. Webb, and J. Lepreau. Large-scale virtualization in the emulab network testbed. In USENIX 2008 Annual Technical Conference, pages 113–128, 2008.
9. C. E. Leiserson. Fat-trees: Universal networks for hardware-efficient supercomputing. IEEE Trans. Comput., 34:892–901, Oct. 1985.
10. L. Li, D. Alderson, W. Willinger, and J. Doyle. A first-principles approach to understanding the Internet’s router-level topology. In Proceedings of ACM SIGCOMM 2004, 2004. 11. T. Miyachi, K.-i. Chinen, and Y. Shinoda. StarBED and SpringOS: Large-scale general
purpose network testbed and supporting software. In Proceedings of VALUETOOLS, 2006. 12. R. Ricci, C. Alfeld, and J. Lepreau. A solver for the network testbed mapping problem. ACM
SIGCOMM Computer Communications Review, 33:65–81, Apr. 2003.
13. L. Rizzo. Dummynet: a simple approach to the evaluation of network protocols. SIGCOMM Comput. Commun. Rev., 27:31–41, Jan. 1997.
14. The University of Utah. Other Emulab testbeds. http://users.emulab.net/trac/ emulab/wiki/OtherEmulabs.
15. B. White, J. Lepreau, L. Stoller, R. Ricci, S. Guruprasad, M. Newbold, M. Hibler, C. Barb, and A. Joglekar. An integrated experimental environment for distributed systems and networks. In Proceedings of SOSP, Dec. 2002.