HAL Id: hal-00330710
https://hal.archives-ouvertes.fr/hal-00330710
Submitted on 15 Oct 2008
HAL is a multi-disciplinary open access
archive for the deposit and dissemination of
sci-entific research documents, whether they are
pub-lished or not. The documents may come from
teaching and research institutions in France or
abroad, or from public or private research centers.
L’archive ouverte pluridisciplinaire HAL, est
destinée au dépôt et à la diffusion de documents
scientifiques de niveau recherche, publiés ou non,
émanant des établissements d’enseignement et de
recherche français ou étrangers, des laboratoires
publics ou privés.
the southern Pacific Ocean
France van Wambeke, Sophie Bonnet, T. Moutin, Patrick Raimbault, G.
Alarcón, C. Guieu
To cite this version:
France van Wambeke, Sophie Bonnet, T. Moutin, Patrick Raimbault, G. Alarcón, et al.. Factors
limiting heterotrophic bacterial production in the southern Pacific Ocean. Biogeosciences, European
Geosciences Union, 2008, 5 (3), pp.833-845. �hal-00330710�
© Author(s) 2008. This work is distributed under the Creative Commons Attribution 3.0 License.
Factors limiting heterotrophic bacterial production in the southern
Pacific Ocean
F. Van Wambeke1, S. Bonnet2, T. Moutin3, P. Raimbault3, G. Alarc´on4, and C. Guieu2
1Laboratoire de Microbiologie, G´eochimie et Ecologie Marines (LMGEM), CNRS, UMR 6117, Universit´e de la M´editerran´ee, Campus de Luminy – Case 901, 13 288 Marseille cedex 9, France
2CNRS, Laboratoire d’oc´eanographie de Villefranche, 06 230 Villefranche-sur-Mer, France; Universit´e Pierre et Marie Curie - Paris6, Laboratoire d’oc´eanographie de Villefranche, 06 230 Villefranche-sur-Mer, France
3Laboratoire d’Oc´eanographie et de Biog´eochimie (LOB), CNRS, UMR 6535, Universit´e de la M´editerran´ee, Campus de Luminy – Case 901, 13 288 Marseille cedex 9, France
4Department of Oceanography & Center for Oceanographic Research in the eastern South Pacific, University of Concepcion, Casilia 160-C, Concepcion, Chile
Received: 26 September 2007 – Published in Biogeosciences Discuss.: 16 October 2007 Revised: 21 February 2008 – Accepted: 8 May 2008 – Published: 19 May 2008
Abstract. The role of potential factors limiting bacterial
growth was investigated along vertical and longitudinal gra-dients across the South Eastern Pacific Gyre. The effects of glucose, nitrate, ammonium and phosphate additions on heterotrophic bacterial production (using leucine technique) were studied in parallel in unfiltered seawater samples in-cubated under natural daily irradiance. The enrichments re-alized on the subsurface showed three types of responses. From 141◦W (Marquesas plateau) to approx 125◦W, bacte-ria were not bottom-up controlled, as confirmed by the huge potential of growth in non-enriched seawater (median of en-hancement factor×39 in 24 h). Within the Gyre (125◦W– 95◦W), nitrogen alone stimulated leucine incorporation rates (median×4.2), but rapidly labile carbon (glucose) became a second limiting factor (median×37) when the two ele-ments were added. Finally from the border of the gyre to the Chilean upwelling (95◦W–73◦W), labile carbon was the only factor stimulating heterotrophic bacterial production. Interaction between phytoplankton and heterotrophic bacte-rial communities and the direct versus indirect effect of iron and macronutrients on bacterial production were also inves-tigated in four selected sites: two sites on the vicinity of the Marquesas plateau, the centre of the gyre and the Eastern border of the gyre. Both phytoplankton and heterotrophic bacteria were limited by availability of nitrogen within the gyre, but not by iron. Iron limited phytoplankton at Marque-sas plateau and at the eastern border of the gyre. However
Correspondence to: F. Van Wambeke
48 h enrichment experiments were not sufficient to show any clear limitation of heterotrophic bacteria within Marquesas plateau and showed a limitation of these organisms by labile carbon in the eastern border of the Gyre.
1 Introduction
Heterotrophic bacteria generally meet their energy and ele-mental needs from utilisation of organic matter, which in-cludes essential elements like C, N, P and Fe. However, in oligotrophic environments, elemental needs are sometimes not satisfied only by utilization of organic matter and het-erotrophic bacteria can compete with phytoplankton for min-eral nutrients like N, P or Fe (Kirchman, 1994; Tortell et al., 1999; Thingstad, 2000). To examine factors limiting heterotrophic bacterial growth, seawater samples are gener-ally amended with various components (organic molecules, macro nutrients, iron), alone or in combination. After 24– 48 h, some bacterial parameters are examined, the main one primarily being bacterial production (either with thymidine or leucine technique). Different elements have been shown to stimulate bacterial production : phosphorus in the Atlantic Ocean (Sargasso Sea: Cotner et al., 1997, Gulf of Mexico: Pomeroy et al., 1995) and in the Mediterranean Sea (East-ern: Zohary and Robarts, 1998; Thingstad et al., 2005; West-ern: Van Wambeke et al., 2002), nitrogen in the South West Pacific Ocean (French Polynesia: Torr´eton et al., 2000), la-bile organic carbon in the Equatorial and Subarctic Pacific (Kirchman, 1990; Kirchman and Rich, 1997), iron in the Southern ocean (Pakulski et al., 1996, Tortell et al., 1996).
From a punctual observation, it is difficult to generalize be-cause within a given area, temporal and vertical variability have been shown (Sala et al., 2002; Van Wambeke et al., 2002). In addition, the simple point of view of “one sin-gle” resource limiting factor has evolved: i) co-limitation often occurs: carbon – iron (Tortell et al., 1999; Church et al., 2000; Kirchman et al., 2000), carbon – phosphorus (Sala et al., 2002, Van Wambeke et al., 2002), carbon – nitro-gen (Torr´eton et al., 2000) ii) among heterotrophs, organic molecules might acts as nutrients for building biomass but also as energy resources; this observation is at the origin of the concept of energy limitation (Kirchman, 1990, Donachie et al., 2001) and iii) direct versus cascade effects: are bacteria directly stimulated, or do they benefit from a surplus phyto-plankton production also affected by the relieving of one key nutrient? (Palkuski et al., 1996; Church et al., 2000; Cochlan, 2001; Oliver et al., 2004; Obernosterer et al., 2008b).
In the South Pacific Gyre, extreme isolation from terres-trial influence results in a permanent situation of hyperolig-otrophy (Claustre et al., 2008). Picoplanktonic organisms, both heterotrophic and photoautotrophic, dominate commu-nity metabolism in this area (Grob et al., 2007). Bacte-rial production is very low in the centre of the gyre and re-lies upon autochthonous, photosynthetically derived organic matter as well as on changes in solar radiations as shown by the diel variability of bacterial production (Van Wambeke et al., 2008a; b). Photo-autotrophic production is limited by nitrogen availability within the centre of the Gyre and is par-ticularly adapted to the very low amounts of dissolved iron present (Bonnet et al., 2008). In contrast, iron limits phy-toplanktonic production within the Marquesas plateau. In addition, bulk DOC stock is particularly important in the south Pacific Gyre (Raimbault et al., 2008). One might ex-pect dynamics of bacterial production to be also affected by the lack of inorganic nutrients or iron and the limiting fac-tors to change across this vast, unexplored region of the east-ern south Pacific. The purpose of this study was thus to de-termine which factors limited heterotrophic bacterial growth across a broad survey along longitudinal and vertical gradi-ents from Marquesas Plateau to the Chilean upwelling.
2 Materials and methods
To follow bottom-up factors controlling heterotrophic bacte-ria, prefiltration of samples should be ideal. However, par-ticularly in oligotrophic environments, organic material de-voted to bacterial growth is provided continuously through regenerating processes by higher size-class organisms, so that bottom up control is influenced by preying organisms. This is particularly evidenced within the center of the south Pacific Gyre site where the Redfield f ratio is close to zero, but becomes slightly positive only when considering atmo-spheric di-nitrogen fixation (Raimbault and Garcia, 2008). In this case, the response of all members of the community
is needed to fully appreciate the complexity of changes in trophic regulations and nutrient transfers resulting from addi-tion of nutrients. Another problem is the representativeness of the activity associated to a pre-filtered bacterial fraction (within the gyre, on average 36% of the bacterial production was associated to the >0.6 µm fraction, unpub. results). Fi-nally, we chose to maintain whole seawater samples to keep the possibility to study simultaneously effect of amendments on both autotrophic and heterotrophic compartment and to explore potentially direct versus indirect effects.
In order to identify the factors limiting heterotrophic bac-terial production, two different sets of experiments were per-formed, one under trace metal clean condition (TMC), and the other under non trace metal clean conditions (non TMC).
2.1 TMC
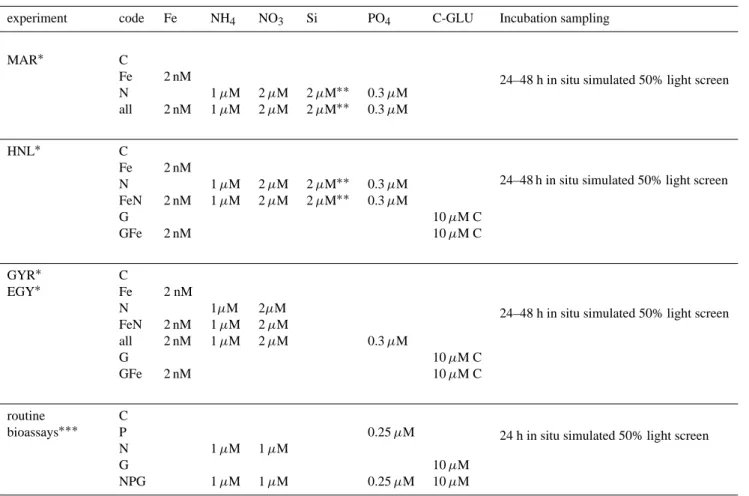
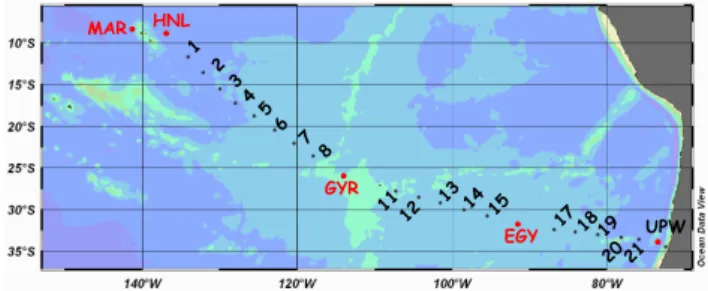
These experiments were performed at four experimental sites. These stations represented different trophic regimes (Table 1): the mesotrophic area associated to the plume of the Marquesas Island (141.14◦W, 8.19◦S) (MAR), the ad-jacent medium nitrate, low chlorophyll waters (136.97◦W, 9.04◦S) (HNL), the hyperoligotrophic waters associated with the central part of the South Pacific gyre (114.02◦W, 26.04◦S) (GYR) and the oligotrophic eastern side of the gyre (91.39◦W, 31.89◦S) (EGY). The GYR site has been selected from ocean color images as having the lowest sur-face chlorophyll concentration in the world ocean. Details of these on-deck incubations are fully described in Bonnet et al. (2008). All experimental setups were performed us-ing strict trace metal clean techniques (Bruland et al., 1979) inside a clean container. Briefly, seawater was collected at 30-meter depth using a Teflon pump system and dispensed into acid-washed (Suprapur Merck HCL) transparent poly-carbonate bottles. Under a laminar flow hood, nutrients were added alone and in combination to final concentrations of 1 µM NH+4 (from ammoniac reagent) +2 µM NaNO3, 0.3 µM NaH2PO4, 2 nM FeCl3, 10 µM C-glucose (Table 2). The bottles were incubated in an on-deck incubator with cir-culating surface seawater at appropriated irradiance (50% ambient light level). The difference between circulated sur-face water temperature and 30 m depth temperature was neg-ligible at the three sites investigated (no more than 1◦C). Three bottles for each treatment were randomly selected and sampled destructively at 24 h and 48 h. A large set of pa-rameters were measured to follow nutrient concentrations, phytoplankton response (cytometric counts, variable fluores-cence, chlorophyll, particulate primary production, Bonnet el al., 2008), bacterial abundance and heterotrophic bacterial production.
2.2 Non TMC
We also investigated more systematically factors in-fluencing leucine incorporation rates using non TMC
Table 1. Initial conditions of “trace metal clean” experiments.
BN: bacterial abundances. PP: primary production.
T◦C NO3 NH4 PO4 SiOH4 Fe DOC∗ Chl-a PP BN leu inc rate µM µM µM µM nM µM mg m−3 mgC m−3d−1 ×10⁵ml−1 pmol L−1h−1 MAR 27.7 1.97 0.32 0.37 0.97 0.13 70 0.18 nd 9.6 26 HNL 27.7 1.82 0.04 0.31 0.91 0.14 70 0.11 9.1 8.9 27 GYR 22.1 bdl bdl 0.11 0.55 0.1 118 0.03 1.8 4.1 18 EGY 18.0 0.04 0.008 0.17 1.02 0.1 98 0.07 6.5 7.5 15 nd: not determined,
bdl: below detection limits, T◦C: temperature
∗DOC concentrations come from the analysis of sea water sample collected at the nearest (in time) CTD cast.
Table 2. Summary of enrichment conditions.
Fe: iron, NH4: ammonium, NO3: nitrate, Si: orthosilicic acid, PO4: phosphate, GLU: glucose.
experiment code Fe NH4 NO3 Si PO4 C-GLU Incubation sampling
24–48 h in situ simulated 50% light screen
MAR∗ C
Fe 2 nM
N 1 µM 2 µM 2 µM∗∗ 0.3 µM all 2 nM 1 µM 2 µM 2 µM∗∗ 0.3 µM
24–48 h in situ simulated 50% light screen
HNL∗ C Fe 2 nM N 1 µM 2 µM 2 µM∗∗ 0.3 µM FeN 2 nM 1 µM 2 µM 2 µM∗∗ 0.3 µM G 10 µM C GFe 2 nM 10 µM C
24–48 h in situ simulated 50% light screen
GYR∗ C EGY∗ Fe 2 nM N 1µM 2µM FeN 2 nM 1 µM 2 µM all 2 nM 1 µM 2 µM 0.3 µM G 10 µM C GFe 2 nM 10 µM C
24 h in situ simulated 50% light screen routine C bioassays∗∗∗ P 0.25 µM N 1 µM 1 µM G 10 µM NPG 1 µM 1 µM 0.25 µM 10 µM ∗
“trace metal clean” conditions of manipulation.
∗∗Si addition resulted in a slight contamination in Fe of about 0.1 nM. ∗∗∗non “trace metal clean” conditions of manipulation.
MAR HNL UPW GYR 1 2 13 3 4 5 8 14 11 12 7 6 15 1718 19 2021 EGY
Fig. 1. Transect of the BIOSOPE cruise from the Marquesas Islands
to Chile. In red, stations where “trace metal clean” enrichment ex-periments were processed, in black, stations used for “non metal clean” bioassays. Numbers indicate short-term stations, for which only numbers have been indicated to simplify presentation, not the complete code as in Table 3. For instance 1 is STB1 and 21 is STA21.
experiments, i.e. incubated water sampled from Niskin bot-tles and manipulated in a classical laboratory. Nutrients were added in order to obtain a final concentration of 1 µM NH4Cl+1 µM NaNO3, 0.25 µM Na2HPO4, 10 µM C-glucose (Table 2). Transparent polycarbonate flasks of 60 ml were used and incubated on average 24 h in simulated in situ conditions (on deck incubator, neutral screens). For the lon-gitudinal trend (141◦W to 72◦W, Fig. 1), seawater was sam-pled at one single depth varying from 5 to 30 m according the CTD profile. The depths chosen were always within the mixed layer, and corresponded to 50% incident light. We also investigated factors limiting BP along vertical profiles at sites GYR, EGY and UPW. The latter site corresponded to the upwelling area off the Chilean Coast (73.2◦W, 33.5◦S, Fig. 1). For those experiments, for each depth sampled, five 60 ml polycarbonate flasks (C, P, N, G, NPG) were incubated in a running seawater bath covered with a neutral screen cor-responding to the incident light level. The deeper depth sam-pled was below the euphotic zone and was incubated in the dark in the incubator at in situ temperature. In situ light con-ditions were then correctly reproduced (excluding UV ef-fects), whereas a slight difference could be obtained with temperature: up to 3◦C difference at GYR (for the 185 m sample corresponding to 1% incident light: 19◦C in situ, 22◦ during incubation), 2◦C at EGY and 2.2◦at UPW.
Samples for bacterial abundances were fixed with paraformaldehyde at 1% and quick frozen in liquid nitrogen. Within 2 months after the cruise, they were analyzed with SYBR Green I and run on a FACSCalibur flow cytometer as described in Grob et al. (2007). Bacterial production was de-termined using3H leucine technique coupled with the cen-trifuge method with full methodological description in Van Wambeke et al. (2008a). Briefly, 1.5 ml seawater samples or sub-samples from incubated flasks were incubated in the dark for 1 to 2 h after addition of 20 nM leucine. The terms “heterotrophic bacteria” and “heterotrophic bacterial produc-tion” are used in the whole text by simplicity but sensus
stricto refers to heterotrophic prokaryotes and heterotrophic prokaryotic production, respectively. Indeed, prokaryotes in-clude Bacteria and Archaea; and it has been shown that some organisms in both groups are able to incorporate leucine (Kirchman et al., 2007).
Nutrients were analyzed following standard colorimetric methods on board (Raimbault et al., 2008). Chlorophyll-a (Chl-Chlorophyll-a) concentrChlorophyll-ations given for the enrichment experi-ments were analyzed fluorimetrically as described in Bonnet et al. (2008) whereas pigment concentrations were measured systematically at each station during the transect using HPLC method (Ras et al., 2008). Particulate primary production was measured on board in running seawater baths covered with a 50% neutral screen. Incubations periods lasted on av-erage 5 h during morning time hours. Detailed methodology and assumption used to convert hourly to daily rates are fully described in Duhamel et al. (2007).
We used a non parametric test, the Mann-Whitney test in TMC experiments. Because this test lacks statistical power with small samples, we used it only when triplicate data where available in order to maintain comparison purpose. When comparing the effect of one enrichment to the con-trol on a given variable, untransformed data were compared. When comparing the degree of stimulation reached for one given enrichment between 2 variables, the enrichment factor (i.e., ratio of rate (or stock) in enriched batch to the rate (or stock) in control unamended) were compared. The Wilcoxon signed-rank test was used in non TMC experiments.
3 Results
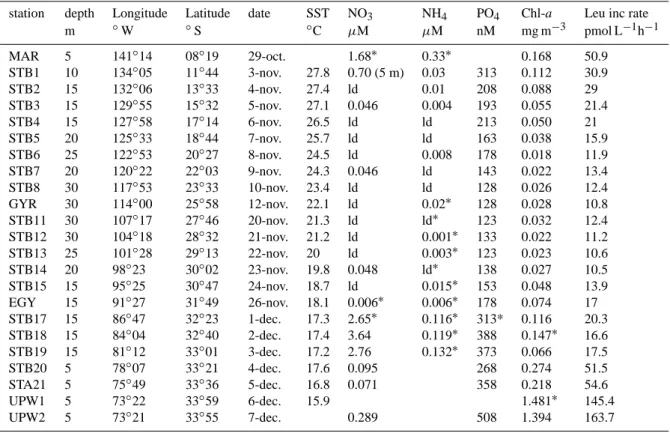
3.1 Initial conditions prior to enrichment experiments A large gradient of nutrient concentrations and chlorophyll a was observed along the transect (Table 3). Nitrate concen-trations ranged from undetectable values to 3.6 µM (station STB 18), whereas soluble reactive phosphorus was always detectable and above 120 nM (Moutin et al., 2008). Chl-avaried almost by 2 orders of magnitude (0.02 mg m−3 in the centre of the gyre to 14.8 mg m−3 in the Chilean up-welling system). Leucine incorporation rates ranged from 10 to 164 pmol L−1h−1. Higher values of nutrients, Chl-a and leucine incorporation rates were obtained at the east-ern part of the transect, within the Chilean upwelling (sta-tions STB20, STA21, site UPW). Sta(sta-tions between STB6 and STB15 displayed lower Chl-a stocks and leucine in-corporation rates (means ±sd 0.027±0.009 mg Chl-a m−3, 11.9±1.2 pmol L−1h−1, respectively). Vertical profiles of dissolved iron indicated low (0.13±0.03 nM) and constant concentrations from the surface to 80 m throughout most of the transect (site STB4 to STB14, including GYR), and in-creased notably from station STA21 to the Chilean coast, to reach 0.4 to 1.2 nM in surface waters (also see Blain et al., 2008).
Table 3. Initial conditions prevailing in sea water samples used for routine bioassays. SST: sea surface temperature (used in running sea
water baths during incubations), Chl a: Chlorophyll a, Leu inc rate: incorporation rates of leucine into proteins, ld: below detection limits. station depth Longitude Latitude date SST NO3 NH4 PO4 Chl-a Leu inc rate
m ◦W ◦S ◦C µM µM nM mg m−3 pmol L−1h−1 MAR 5 141◦14 08◦19 29-oct. 1.68∗ 0.33∗ 0.168 50.9 STB1 10 134◦05 11◦44 3-nov. 27.8 0.70 (5 m) 0.03 313 0.112 30.9 STB2 15 132◦06 13◦33 4-nov. 27.4 ld 0.01 208 0.088 29 STB3 15 129◦55 15◦32 5-nov. 27.1 0.046 0.004 193 0.055 21.4 STB4 15 127◦58 17◦14 6-nov. 26.5 ld ld 213 0.050 21 STB5 20 125◦33 18◦44 7-nov. 25.7 ld ld 163 0.038 15.9 STB6 25 122◦53 20◦27 8-nov. 24.5 ld 0.008 178 0.018 11.9 STB7 20 120◦22 22◦03 9-nov. 24.3 0.046 ld 143 0.022 13.4 STB8 30 117◦53 23◦33 10-nov. 23.4 ld ld 128 0.026 12.4 GYR 30 114◦00 25◦58 12-nov. 22.1 ld 0.02∗ 128 0.028 10.8 STB11 30 107◦17 27◦46 20-nov. 21.3 ld ld∗ 123 0.032 12.4 STB12 30 104◦18 28◦32 21-nov. 21.2 ld 0.001∗ 133 0.022 11.2 STB13 25 101◦28 29◦13 22-nov. 20 ld 0.003∗ 123 0.023 10.6 STB14 20 98◦23 30◦02 23-nov. 19.8 0.048 ld∗ 138 0.027 10.5 STB15 15 95◦25 30◦47 24-nov. 18.7 ld 0.015∗ 153 0.048 13.9 EGY 15 91◦27 31◦49 26-nov. 18.1 0.006∗ 0.006∗ 178 0.074 17 STB17 15 86◦47 32◦23 1-dec. 17.3 2.65∗ 0.116∗ 313* 0.116 20.3 STB18 15 84◦04 32◦40 2-dec. 17.4 3.64 0.119∗ 388 0.147∗ 16.6 STB19 15 81◦12 33◦01 3-dec. 17.2 2.76 0.132∗ 373 0.066 17.5 STB20 5 78◦07 33◦21 4-dec. 17.6 0.095 268 0.274 51.5 STA21 5 75◦49 33◦36 5-dec. 16.8 0.071 358 0.218 54.6 UPW1 5 73◦22 33◦59 6-dec. 15.9 1.481∗ 145.4 UPW2 5 73◦21 33◦55 7-dec. 0.289 508 1.394 163.7
∗refers to data acquired on another CTD cast sampled in an interval of few hours on the same site.
3.2 TMC experiments
3.2.1 Heterotrophic versus autotrophic response.
The extent of stimulation of phytoplankton and bacterial biomasses and productions following various amendments varied according to the station and the element tested. Roughly, phytoplankton was significantly stimulated by Fe addition alone but also N addition alone at the MAR and HNL sites, by N at the GYR site, and responded mostly to Fe+N (FeN, all) additions at the EGY site (Table 4). Leucine incorporation rate was particularly stimulated by glucose at the HNL site and by N at the GYR site. Stimulations were less significant at MAR and EGY sites: Fe alone, but also N alone stimulated leucine activity at the MAR site, whereas it was glucose at the EGY site (Fig. 2, Table 4).
Besides the information concerning the limiting factor(s), we obtained the following general features: bacterial num-bers did not increase or, when increasing, always increased less than leucine incorporation rates (HNL site in G and GFe, p<0.05 for all comparisons of enrichment factors). Chloro-phyll stocks either increased in the same proportion as the primary production (GYR 24 h in N, FeN and all for in-stance), or increased in less proportion than primary
produc-MAR 0 500 1000 1500 O C F N all C F N all HNL 0 1000 2000 3000 O C F N FN G GF C F N FN G GF GYR 0 100 200 300 400 500 O C F N FN all G GF C F N FN all G GF EGY 0 100 200 300 O C F N FN all G GF C F N FN all G GF 24 h 48 h 24 h 48 h 24 h 48 h 24 h 48 h L e u i n c ra te (p mo l l -1h -1) * * ** * * * * * * * * * * * * * * * * * * ** * * * * * * * *
Fig. 2. Evolution of leucine incorporation rates on bioassay
exper-iments made under “trace metal clean” conditions. Means±sd of triplicate bottles sampled after 24 and 48 h of incubations. For MAR and HNL enrichments were O: initial conditions, C: control non enriched, F:+iron, N:+ nitrates+ammonium+phosphates+silicates, all: nitrates+phosphates+silicates+iron, G:+glucose, GF:glucose+iron. For GYR and EGY N was only ni-trate+ammonium, FN was nitrate+ammonium+iron and all nitrates+ammonium+phosphates+iron . ∗: response significantly different from the control at the same time, Mann Whitney test, p<0.05.
Table 4. Summary of the factors of increase obtained after 24 and 48h incubations in “trace metal clean” experiments. Results are expressed
as the ratio of the mean value obtained divided by the mean value obtained in the non-amended control at the same time. For the lines corresponding to non-amended controls (C), the italic values indicate the factor of increase relative to the control at time zero. Enrichment codes correspond to Table 2. The parameters and their units before comparison are: chlorophyll-a (Chl-a, mg m−3), bacterial abundance (BN, cells ml−1), heterotrophic nanoflagellate abundances (HNAN, cells ml−1), 14C-primary production (PP, mg C m−3d−1), leucine incorporation rates (Leu pmol L−1h−1), primary production per unit Chl-a (spec PP, mgC mg Chl a−1d−1)and leucine incorporation rate per cell (spec Leu, ×10−21mol cell−1h−1). Empty places: parameter not sampled.
24 h 48 h
Chl-A BN HNAN PP Leu sp PP sp Leu Chl-A BN HNAN PP Leu sp PP sp Leu
MAR C 1.5 1.1 20.1 17.6 2 17.4 Fe 1.6∗∗ 1.1∗∗ 1.8∗∗ 1.7∗∗ 3.0∗∗ 2.1∗∗ N 1.7∗∗ 1.1∗∗ 2.1∗∗ 1.8∗∗ 1.7∗∗ 1.5∗∗ all 2.2∗∗ 1.2∗∗ 2.2∗∗ 2.0∗∗ 8.7∗∗ 2.3∗∗ HNL C 1.4∗∗ 1.1∗∗ 1.2 1.1 4.2∗∗ 0.8∗∗ 3.8∗∗ 1.3∗∗ 1.2∗∗ 1.3 0.8∗∗ 2.6∗∗ 0.6∗∗ 2.2 Fe 1.4∗∗ 1 1.1 2.8∗∗ 3.1∗∗ 2.0∗∗ 3.3∗∗ 3.6∗∗ 0.9 1.2 5.5∗∗ 4.6∗∗ 1.5∗∗ 5∗∗ N 1.9∗∗ 1 1.8 3.9∗∗ 2.3∗∗ 2.1∗∗ 2.2∗∗ 4.5 1 2.1 5.7∗∗ 2.7∗∗ 1.1 2.7∗∗ FeN 1.9∗∗ 0.9 1.7 4.3∗∗ 2.9∗∗ 2.3∗∗ 3.1∗∗ 6.1 1 2 9.5∗∗ 8.7∗∗ 1.4 9.1∗∗ G 1.1∗∗ 1.4 11.9∗∗ 10.5∗∗ 1.1∗∗ 1.4 6.3∗∗ 5.5∗∗ Gfe 1.2∗∗ 1.2 21.7∗∗ 18.8∗∗ 1.1∗∗ 1.4 19.1∗∗ 16.3∗∗ GYR C 1.1 0.9 1.1 0.4∗∗ 0.8 0.4 0.9 0.7 1.1 0.5∗∗ 1 0.7 Fe 1.5 1 1 1.1 1.4 0.6 1.4 1 1 0.7∗∗ 0.5 0.7 N 2.2∗∗ 1 1.1 2.1∗∗ 4.6∗∗ 0.9 4.7∗∗ 3.1 1.4 4.2∗∗ 8.9∗∗ 1.4 FeN 2.3∗∗ 1 1.1 2.4∗∗ 11.0∗∗ 1.1 11.0∗∗ 4 1.6 5.4∗∗ 16.9∗∗ 1.4 all 2.1∗∗ 1 2 2.0∗∗ 16.0∗∗ 0.9 15.9∗∗ 3.3 1.8 4.5∗∗ 23.4∗∗ 1.4 G 1 1.1 3∗∗ 3.1 1.4 3.5∗∗ GFe 1 1 3.4∗∗ 3.5∗∗ 1.5 4.9∗∗ EGY C 1.9∗∗ 1.1 1.1 0.7∗∗ 3.1∗∗ 0.4∗∗ 2.7 1.8∗∗ 1.1 1.1 0.8∗∗ 3.5∗∗ 0.4∗∗ 3.1 Fe 0.9 1 1.2 1 1.4 1.1 1.4 1.4 1.1 1.6 1.3∗∗ 1.5 1.3 1.3 N 1.2∗∗ 1 1.3 1.1∗∗ 1.3 0.9 1.3 1.6∗∗ 1 1.9 1.9∗∗ 1.2∗∗ 1.2∗∗ 1.2∗∗ FeN 1.2∗∗ 1 1.2 1.5∗∗ 1.1 1 1.1 2.6∗∗ 1 2 3.8∗∗ 1.9∗∗ 1.5∗∗ 1.8∗∗ all 1.3∗∗ 1 1.6 1.8∗∗ 0.9 1.4∗∗ 1 3.0∗∗ 1.2 2.4 4.5∗∗ 2∗∗ 1.5∗∗ 1.7∗∗ G 1 1.2 1.4 1.4 1 1.4 3.5∗∗ 3.4∗∗ GFe – 1 1.1 1.8∗∗ 1.7∗∗ 1 1.7 – 2.3 2.4
∗∗Indicates a response significantly different at p<0.05 after Mann Whitney test. This test was made only when triplicate data were available
for both pairs of data set compared (bold characters).
tion (HNL 24 h in Fe, N, FeN; HNL 48 h in Fe; GYR 48 h in N, FeN; EGY 48 h in N, FeN, all, p<0.05 for all these comparisons of enrichment factors). In addition, chloro-phyll stocks increased after 48 h up to a factor of 6 (FeN at the HNL site), whereas bacterial abundances never increased more than a factor of 1.2 (“all” at the EGY site, GFe at the HNL site and “all” at the MAR site). Factors of increase of leucine specific activities were consequently very close to those of the fluxes, whereas primary production per unit of chlorophyll, when increasing, increased, on average of×1.6 less than photosynthesis rates (Table 4).
Out of these general trends, the intensity of the het-erotrophic response differed from the intensity of autotrophic response. For instance, at the GYR site, both photosynthesis and heterotrophic production were stimulated after N addi-tions (alone and combined: N, FeN, “all”), but leucine in-corporation rates increased up to 8 times more than primary
production (GYR “all”, after 24 h, ×16 and ×2, respectively, Table 4, all these differences at 24h and 48h between en-richment factors on leucine activity vs PP were significant at p<0.05). On the opposite, in the treatments N (24, 48 h) and FeN (24 h) at the HNL site, and FeN (24, 48 h) and “all”(24, 48 h) in the treatments at the EGY site, primary production increased on average 1.6 times more than leucine incorpo-ration rates (differences of enrichment factors significant at p<0.05). It must be noticed that these latter cases corre-sponded to situations where phytoplankton and heterotrophic bacteria were not stimulated primarily by the same factor (i.e. N or Fe for phytoplankton and glucose for bacteria). 3.2.2 Iron control on Heterotrophic Bacteria
At the MAR site, the most significant increase was obtained in the non-amended control (×20 in 24 h), whereas Fe alone,
macronutrients N+P+Si (“N”) or a combination of all the nu-trients Fe+N+P+Si (“all”) lead to similar significant but low response (1.8 to 2.2 times higher than the control at the same time). There was no other additional effect after 48 h. At the HNL site, only the glucose and glucose+Fe additions resulted in a drastic increase of leucine incorporation rates (×11 and ×21), visible 24 h after enrichment, although significant, but lower stimulations were obtained after Fe, N, and FeN en-richments. At the GYR site, Fe+N (FeN), and a combination of all the nutrients Fe+N+P (all) resulted in a significantly higher leucine incorporation rates after 24 h (×11, ×16, re-spectively) and 48 h (×16, ×23, rere-spectively). The leucine incorporation rate was also enhanced after N addition alone, but on a lower extent, and not by Fe alone. Glucose (alone or in combination with Fe) results in a significant, but low increase of leucine incorporation rate, even after 48h. At the EGY site, however, only glucose additions stimulated signif-icantly leucine incorporation rates at 24 h (×1.8 in GFe at 24 h). Significant increases of leucine activity were seen also after 48 h in N, FeN and “all” (×1.2 to ×1.9) but to a lesser extent than after glucose addition (×3.5, Table 4, Fig. 2).
The results obtained in the framework of these trace metal clean experiments allowed us to draw some conclusions: i) iron was never a single factor limiting bacterial production, ii) when stimulation by iron occurred, response in the un-amended control (MAR site), in glucose un-amended samples (HNL) was greater, suggesting that the stimulation of bacte-rial production after iron addition was a cascade effect. Con-sequently, we assumed that effects of N, P and glucose addi-tions could be studied more systematically along the transect by using “non TMC” technique, and 24 h incubations should be long enough to detect some stimulation, if occurring. 3.3 Non TMC experiments
3.3.1 Longitudinal variability of nutrient control on Het-erotrophic Bacteria
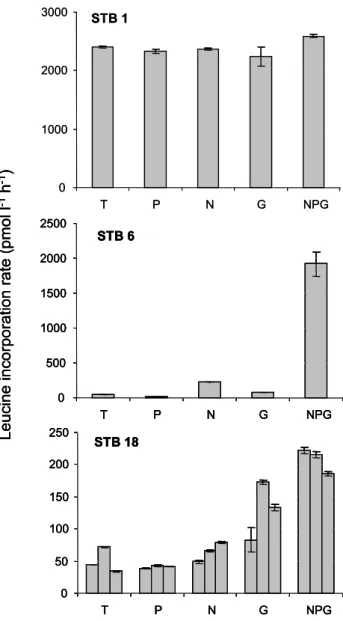
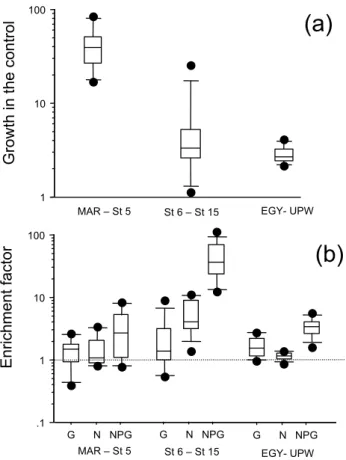
Along the horizontal transect in the mixed layer, P alone stimulated leucine incorporation rates only in 1 case over 23 tested (station STB4, ×2.2 higher than the control). How-ever, in that bioassay the addition of N (×3.4) and G alone (×2.6) also resulted in an increase of leucine incorporation rates. We thus discarded phosphorus as a potentially limiting factor everywhere on the transect. At the opposite, effects of N, glucose and NPG additions on leucine incorporation rates showed three groups of responses. In the western part, from the MAR site to station STB5, the leucine incorporation rate was greatly stimulated simply by confinement during 24 h in a polycarbonate bottle (see example of STB1, Fig. 3). On av-erage, the median factor of increase of leucine incorporation rates was 39 (Fig. 4a). This is in agreement with the TMC experiments conducted at the MAR site (Fig. 2). The median values of stimulation factors were ×1.4, ×1.1 and ×2.6 for glucose, N and NPG addition, respectively (Fig 4b). In this
STB 1 0 1000 2000 3000 T P N G NPG STB 18 0 50 100 150 200 250 T P N G NPG STB 6 0 500 1000 1500 2000 2500 T P N G NPG L e u c in e i n c o rp o ra ti o n r a te ( p m o l l -1 h -1) STB 1 0 1000 2000 3000 T P N G NPG STB 18 0 50 100 150 200 250 T P N G NPG STB 6 0 500 1000 1500 2000 2500 T P N G NPG L e u c in e i n c o rp o ra ti o n r a te ( p m o l l -1 h -1) STB 18 0 50 100 150 200 250 T P N G NPG STB 18 0 50 100 150 200 250 T P N G NPG STB 6 0 500 1000 1500 2000 2500 T P N G NPG STB 6 0 500 1000 1500 2000 2500 T P N G NPG L e u c in e i n c o rp o ra ti o n r a te ( p m o l l -1 h -1)
Fig. 3. Typical results obtained from “non metal clean” bioassays.
C: control, P:+phosphates, N:+nitrites+nitrates, G:+glucose, NPG: all 4 elements. Error bar represents variability within duplicate leucine measurements in a single flask. At station STB18, triplicate flasks were incubated. Station STB1: no stimulation, STB6: slight stimulation with N, big stimulation with NPG, STB18: stimulation with glucose.
group of stations, the leucine incorporation rates increased significantly only in the control (Wilcoxon signed-rank test, p<0.05). In the second group of stations (STB6 to STB15, including the GYR site, see example of STB6, Fig. 3), the leucine incorporation rates increased less (×1.1 to ×5.3) in the non-amended control (Fig. 4a). The median values of stimulation factors for glucose, N and NPG additions were ×1.4, ×4.2 and ×37.2, respectively (Fig. 4b). In this group of stations, the leucine incorporation rates increased signif-icantly in the control, in N and NPG –amended samples (Wilcoxon signed-rank test, p<0.01). For the last group of
St 6 – St 15 G N NPG .1 1 10 100 EGY- UPW MAR – St 5 G N NPG G N NPG 1 10 100 G ro w th in t h e c o n tr o l En ri ch me n t fa ct o r
(a)
(b)
St 6 – St 15 EGY- UPW MAR – St 5Fig. 4. Mean results on bioassays realized in sub surface waters,
varying from 5 m (MAR, UPW areas) to 30 m (GYR area). (a) Box-plot distribution of the factor of enrichment in the non enriched control after 24h incubation under in situ-simulated conditions. (b) Box-plot distribution of enrichment factors obtained after 24 h in-cubation in presence of nitrate+ammonium (N), glucose (G) and phosphates+nitrates+ammonium+glucose (NPG). Enrichment fac-tor is the leucine incorporation rate after 24‘h amendments com-pared to the leucine incorporation rate in the non-amended con-trol at the same time. MAR – St 5 group (site MAR and stations STB1 to STB5, n=6), St 6-St 15 group (stations STB6 to STB8, site GYR, stations STB11 to STB15, n=9), EGY-UPW (site EGY, stations STB17 to STA21, UPW1, UPW2, n=8). The middle line in the box is the median value. Limits of the box: upper 75th per-centile, lower 25th percentile; limits of the error bar: 90th and 10th percentiles; dots: outliers.
stations (EGY to UPW2), the leucine incorporation rates also increased slightly in the non-amended control (×2.1 to ×2.7 in 24 h between station EGY and STA21, but ×4.1 and ×3.5 at stations UPW1 and UPW2). The median values of stimu-lation factors for glucose, N and NPG additions were ×1.6, ×1.1 and ×3.4, respectively (Fig. 4b, see example of STB18, Fig. 3). In this last group of stations, the leucine incorpora-tion rates increased significantly in the control, in G and NPG – amended samples (Wilcoxon signed-rank test, p<0.05).
3.3.2 Vertical variability of nutrient control on Het-erotrophic Bacteria
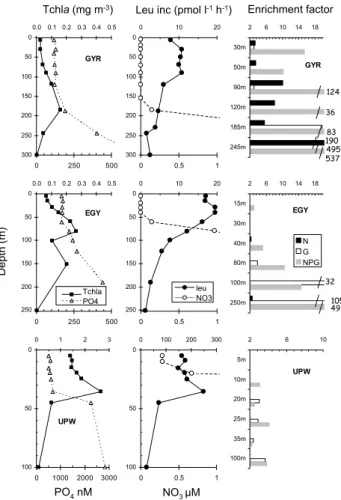
There were also varying stimulation factors of leucine in-corporation rates along vertical profiles. At the GYR site, leucine incorporation rates increased after N addition at all depths tested, even if nitrate was significantly detected be-low 150 m (0.15 µM at 185 m, 3.6 µM at 245 m, Fig. 5). Glucose, however, has a higher effect than N at 185 m (×83 versus ×4) and 245 m (×495 versus ×190, respectively). At the EGY site, the stimulation factor of leucine incorporation rates after 24 h addition of glucose progressively increased between 80 m and 250 m (×4 up to ×105). Stimulation by N alone was non existent or low (×2.2 at 40 m, ×2.6 at 250 m), although nitrogen was still undetectable above 40 m. Stimu-lation by NPG also increased from the surface layer (×1.1– ×2.9 above 30 m) to 250 m (×49). At the UPW site, only effects of G and NPG were visible, being more or less con-stant and with poor increases (factors <4) below 10 m. At 5 m depth, none of the nutrients (alone or in combination) stimulated leucine incorporation rates.
4 Discussion
4.1 Abundance or production to track limitation?
Because both abundance and leucine incorporation rates have been followed, one question is arising: What is the best in-dicator for tracking factors limiting heterotrophic bacterial growth? The increase in leucine incorporation rates, when present, is either due to stimulation of a greater percentage of active population, or the stimulation of the specific growth rate of individual cells, or some combination of these two processes, whereas bacterial abundance is also regulated by grazing when intact sea water is manipulated, and should in-crease more rapidly in pre-filtered samples. Indeed, bacterial abundance responds generally less than production to enrich-ments in unfiltered samples (Kirchman, 1990; Pomeroy et al., 1995 ; Graneli et al., 2004). In our experiments, bacterial abundances showed a response up to ×1.2 after enrichments, whereas leucine incorporation rates increased up to 23 times (Table 4), confirming these previous results. Within surface water at the GYR site, only 25% of the “DAPI-labelled bacte-ria” showed distinct silver grains after microautoradiography coupled to hybridization in situ (Obernosterer et al., 2008a) suggesting inexistent or very low protein synthesis rate by a majority of the cells before enrichments. When adding the limiting factor, bacteria recovered stoichiometric equi-librium and/or energy capacity which gave them the capac-ity to assimilate leucine again. Such unbalanced growth is often the explanation for the strong changes generally ob-served with the thymidine or the leucine technique, com-pared to that of abundances (Carlson and Ducklow, 1996). Thus the increase of leucine incorporation rate does not mean
immediately a change in population. However, rapid growth of gamma-proteobacteria after FeN and “all” additions (Van Wambeke, unpub. results) was observed at the GYR site af-ter 48 h of enrichments. A shift in bacaf-terial population is generally an obligatory consequence of long term confine-ment and enrichconfine-ments (Pinhassi et al., 2006). The number of heterotrophic flagellates increased, suggesting that bacte-rial predation was also enhanced after some stimulation of heterotrophic bacteria (GYR site, N enrichments, Table 4), and consequently regulated bacterial abundances. In conclu-sion, the leucine incorporation rates were thus better indica-tors than abundances for tracking facindica-tors limiting bacterial growth. Nevertheless, responses could have been different in terms of intensity or delay with other tracers of heterotrophic activity or using pre-filtered samples (Carlson and Ducklow, 1996; Donachie et al., 2001).
4.2 Direct versus indirect limitation
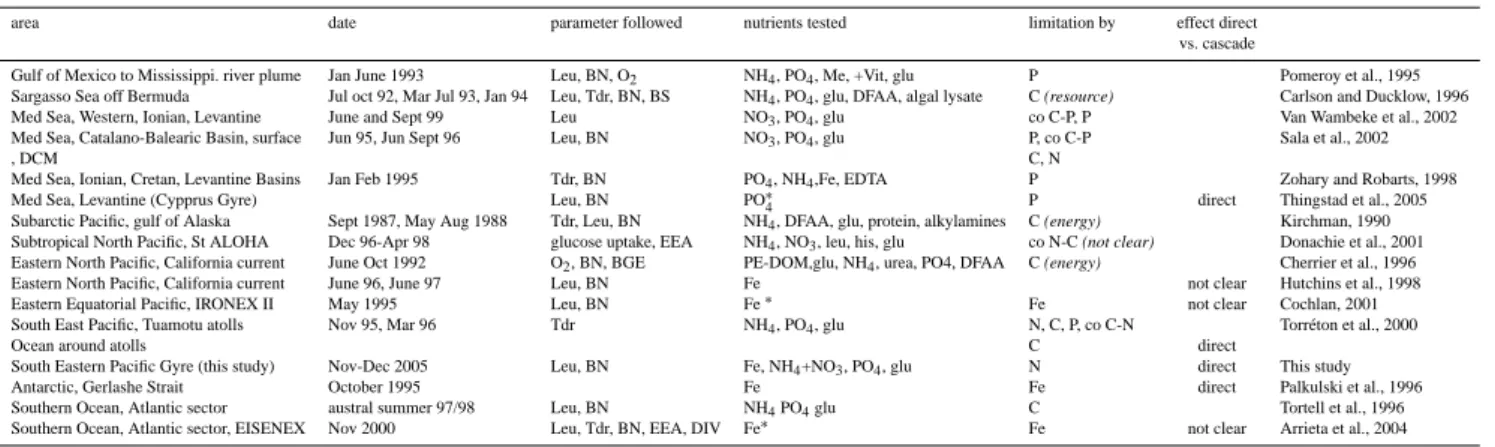
There has been much debate about direct (suppression of a real limiting factor) or indirect (stimulation of phytoplankton by the added component which induces a surplus of DOM production fuelling heterotrophic bacteria) effects of iron and other macronutrients limitation on heterotrophic bacte-ria (Table 5).
The timing and magnitude of responses of phytoplank-tonic parameters (primary production, chlorophyll biomass) compared to that of heterotrophic bacteria in the experiment performed under TMC have helped to argue for possible di-rect or indidi-rect effect of nutrient additions. If iron alone in-duced a positive stimulation of leucine activity within the Marquesas plateau (MAR site), addition of other nutrients N+P+Si (“all”) without Fe stimulated leucine activity at the same level (factor 2 compared to the control at the same time, Fig. 2). In addition, chlorophyll biomass increased compared to the control, by a factor equivalent to that of leucine activ-ity in 24 h, and even more after 48h (factor 3, Table 4). It is thus probable that the effect of Fe on leucine activity was indirect. The major effect obtained at the MAR site is how-ever obtained in the non-amended control (×20 at the MAR site in the “trace metal clean” conditions, Fig. 2), although chlorophyll biomass increased only by ×1.5 in this control (Table 4). It is possible that sufficient amounts of labile DOC were present, allowing a rapid bacterial growth with-out any enrichment, which implies that heterotrophic bacte-ria were not limited at all after a 24 h confinement at the MAR site. The capacity of bacteria to grow on bulk DOC was also seen in the vicinity of MAR site, up to 125◦W, as a strong growth in the non-amended controls was observed up to station STB5 (Fig. 4a). Interpretation of growth in a non-amended control is difficult because the use of batch experiments last for a few days. This implies to take into account bottle effect: underestimation of the levels of the trophic web, and possible destruction of fragile cells during handling that fuels labile organic resources for heterotrophic
EGY 2 6 10 14 18 15m 30m 40m 80m 100m 250m N G NPG UPW 2 6 10 5m 10m 20m 25m 35m 100m GYR 2 6 10 14 18 30m 50m 90m 120m 185m 245m UPW 0 50 100 0 1 2 3 0 1000 2000 3000 0 50 100 0 100 200 300 0 0.5 1 GYR 0 50 100 150 200 250 300 0.0 0.1 0.2 0.3 0.4 0.5 0 250 500 0 50 100 150 200 250 300 0 10 20 0 0.5 1 EGY 0 50 100 150 200 250 0.0 0.1 0.2 0.3 0.4 0.5 0 250 500 0 50 100 150 200 250 0 10 20 0 0.5 1 D e p th (m )
Tchla (mg m-3) Leu inc (pmol l-1h-1) Enrichment factor
PO4nM NO3 µM 124 36 83 190 495 537 32 105 49 N G NPG Tchla PO4 leu NO3
Fig. 5. Distribution of in situ chlorophyll a, leucine incorporation
rates, nitrate and phosphate concentrations along vertical profiles, at sites GYR, EGY and UPW and responses to bioassays. Bioassays are expressed in terms of stimulation factor after N, G and NPG additions (leucine activity divided by leucine activity in the control at the same time). Only stimulation factors greater than 2 were plotted.
bacteria. However, all the other experiments have been per-formed in the same conditions, and the non-amended con-trol did not increase that much. Possible other explanations are the change in the top-down control of bacteria or non steady state of bacterial growth at the time of the sampling at these stations. Day-to-day changes in in situ primary pro-duction, as well as in situ specific leucine incorporation rates have been observed during occupation of the MAR site (Van Wambeke et al., 2008a) and argue for this second hypothesis. At the GYR site, the addition of iron did not result in any significant increase of photosynthesis rates (Table 4). Al-though dissolved iron was low and constant along most of the transect (∼0.1 nM in surface), it was shown that phy-toplankton was acclimated to iron deprivation in the cen-tre of the gyre (Bonnet el al., 2008). N addition alone (ni-trate+ammonium) or in combinations (FeN, “all”) have all stimulated chlorophyll and primary production (24 and 48 h).
Table 5. Review of factors enhancing some bacterial variables among different oceanic environments (Leu, Tdr: production based on Leucine
and Thymidine technique, BN: bacterial numbers, BS: bacterial size, EEA: ectoenzymatic activities, O2: respiration, BGE: bacterial growth
efficiencies, DIV: diversity). DCM deep chlorophyll maximum, PE-DOM : filtrate of heat killed plankton extract (>335 µm), Me+Vit: trace metals+vitamins, glu: glucose, DFAA: dissolved free amino acids, NH4: ammonium, NO3: nitrate, Fe: iron. Co refers to colimitation.∗in
situ fertilization experiments. When carbon is limiting, and when the information was available, the terms in italic (resource, not clear and
energy) refer to the authors’ conclusions about energy versus resource limitation.
area date parameter followed nutrients tested limitation by effect direct
vs. cascade
Gulf of Mexico to Mississippi. river plume Jan June 1993 Leu, BN, O2 NH4, PO4, Me, +Vit, glu P Pomeroy et al., 1995 Sargasso Sea off Bermuda Jul oct 92, Mar Jul 93, Jan 94 Leu, Tdr, BN, BS NH4, PO4, glu, DFAA, algal lysate C (resource) Carlson and Ducklow, 1996 Med Sea, Western, Ionian, Levantine June and Sept 99 Leu NO3, PO4, glu co C-P, P Van Wambeke et al., 2002 Med Sea, Catalano-Balearic Basin, surface Jun 95, Jun Sept 96 Leu, BN NO3, PO4, glu P, co C-P Sala et al., 2002
, DCM C, N
Med Sea, Ionian, Cretan, Levantine Basins Jan Feb 1995 Tdr, BN PO4, NH4,Fe, EDTA P Zohary and Robarts, 1998
Med Sea, Levantine (Cypprus Gyre) Leu, BN PO∗4 P direct Thingstad et al., 2005
Subarctic Pacific, gulf of Alaska Sept 1987, May Aug 1988 Tdr, Leu, BN NH4, DFAA, glu, protein, alkylamines C (energy) Kirchman, 1990 Subtropical North Pacific, St ALOHA Dec 96-Apr 98 glucose uptake, EEA NH4, NO3, leu, his, glu co N-C (not clear) Donachie et al., 2001 Eastern North Pacific, California current June Oct 1992 O2, BN, BGE PE-DOM,glu, NH4, urea, PO4, DFAA C (energy) Cherrier et al., 1996 Eastern North Pacific, California current June 96, June 97 Leu, BN Fe not clear Hutchins et al., 1998
Eastern Equatorial Pacific, IRONEX II May 1995 Leu, BN Fe∗ Fe not clear Cochlan, 2001
South East Pacific, Tuamotu atolls Nov 95, Mar 96 Tdr NH4, PO4, glu N, C, P, co C-N Torr´eton et al., 2000
Ocean around atolls C direct
South Eastern Pacific Gyre (this study) Nov-Dec 2005 Leu, BN Fe, NH4+NO3, PO4, glu N direct This study
Antarctic, Gerlashe Strait October 1995 Fe Fe direct Palkulski et al., 1996
Southern Ocean, Atlantic sector austral summer 97/98 Leu, BN NH4PO4glu C Tortell et al., 1996 Southern Ocean, Atlantic sector, EISENEX Nov 2000 Leu, Tdr, BN, EEA, DIV Fe∗
Fe not clear Arrieta et al., 2004
The leucine incorporation rate in the GYR site is statistically higher in N and G enriched sample than in the control (×4.6 and ×3 enrichment factor at 24 h, ×8.9 and ×3.5 at 48 h, respectively, p<0.05, Table 4). The growth after N addi-tion is not higher than that after G addiaddi-tion at 24 h, but it is at 48 h (p<0.05). Thus, based on a 48 h response, it seems that N addition provides better possibility to grow to heterotrophic bacteria than addition of glucose alone. This trend is confirmed from non TMC experiments made along different stations inside the gyre (STB6-STB15). In these experiments, the increase of leucine incorporation rates after glucose addition is lower that that obtained after N addition (Wilcoxon signed-rank test, p=0.038, n=9 pairs of compari-son, box plots Fig. 4b). These results suggests that the limi-tation by N of bacterial production within the gyre is direct.
But other observations suggest that labile carbon acts se-quentially as a second limiting factor. Indeed, within the surface waters of stations STB6-STB15, addition of glucose alone did not stimulate leucine incorporation rates (Wilcoxon signed-rank test between C and G enriched samples, n=9 pairs of comparison, p=0.07), but addition of N alone did (comparison C-N, p<0.01). However, leucine incorpora-tion rates increased statistically much more in NPG amended samples than in N amended samples (Fig. 4, median of increasing factor switched from ×4.2 to ×37, Wilcoxon signed-rank test between N and NPG enriched samples, n=9 pairs of comparison, p<0.01). Considering further that P never stimulated bacteria, we infer that in the area between 122◦W and 95◦W, labile organic carbon rapidly becomes a limiting factor after N addition.
Within the deep chlorophyll maximum (DCM), however, glucose is the first limiting nutrient, not N (Fig. 5). A similar switch from a mineral nutrient within surface layer to organic
C limitation within DCM has been evidenced in the Mediter-ranean Sea (Sala et al., 2002; Van Wambeke et al., 2002).
The rapidity of the response of heterotrophs versus au-totrophs after relieving the N limiting nutrient in the South Pacific gyre could have consequences on the metabolic bal-ance of this environment. Recently, it has been shown that 5–10% of deep sea water mixed with water from the nutrient-limited mixed layer of the North Pacific Gyre provided a set of nutrient enrichment sufficient to significantly enhance the net community production after 5 days (Mc Andrew et al., 2007). Thus, the question arises here if, in our nitrogen en-richment experiments made at the GYR site, photosynthesis was also notably favoured compared to respiration. Oxygen budgets were not measured in our experiments, but as our stimulation factors were much greater with leucine incorpo-ration rates than particulate primary production, our results would suggest the opposite (i.e. enrichment would favour net heterotrophy at the GYR site). Nevertheless, the leucine in-corporation rate is not respiration, and possible changes in leucine conversion factors, as well as in bacterial growth ef-ficiencies with time could not be ruled out. Indeed, the reliev-ing of a factor limitreliev-ing heterotrophic bacteria enhances bac-terial growth efficiency (Carlson and Ducklow, 1996). Also, our experiments lasted only 48 h, whereas significant chloro-phyll biomass and net community production occurred only after 4–5 days in the Mc Andrew et al. (2007) experiments. Finally, the rates at which autotrophic and heterotrophic cells developed in our experiment might have been influenced by enzymatic properties of uptake systems for ammonium and nitrate which differs inside these two groups, heterotrophic bacteria being favoured by ammonium addition, whereas only nitrate were provided by deep sea water enrichments in Mc Andrew et al. (2007) approach.
4.3 Carbon versus energy limitation of heterotrophic bac-teria
Because the organic molecule tested is also often an energy-rich molecule easily entering catabolic pathways (e.g. glu-cose), one could wonder if this carbon source is tracking carbon resource limitation or energy limitation (Table 4). Free glucose (not combined) is rare in this area (Semp´er´e et al., 2008), suggesting that this molecule plays an impor-tant role in energy restoration once added. DOC is probably highly refractory, due to strong UV radiation effects (Tedetti et al., 2007). Indeed, it has been shown that growth of het-erotrophic bacteria at the GYR site after a one day UV ex-posure of DOM is partly inhibited (Semp´er´e et al., 2008). It is probable that the limitation in N and energy prevents the synthesis of enzymes able to degrade the bulk accumu-lated DOC present in this area (118 µM at GYR, Table 1, Raimbault et al., 2008). Indeed, in addition to changes in populations (Pinhassi et al., 2006), induction of some genes after the relieving of some limiting nutrients has been ob-served (Arietta et al., 2004). Bacteria were described as en-ergy limited in the South Pacific (Kirchman, 1990), and in the Eastern North Pacific (Cherrier et al., 1996), but resource limited in the Sargasso Sea (Carlson and Ducklow, 1996). In addition, conflicting interpretation are sometimes given to the same observation, for instance when comparing enhance-ment of bacterial activity after amino acids addition or with glucose+ammonium addition (Kirchman, 1990; Carlson and Ducklow, 1996; Donachie et al., 2001). It is probably im-possible to dissociate notions of energy versus resource lim-itation in nature and varying conclusions given probably rely on the quality of organic matter present and the parameter tracking heterotrophic activity.
In the centre of the South Pacific Gyre, nitrogen was a common primarily factor limiting phytoplankton and bacte-ria. Competitive advantages for N between bacteria and phy-toplankton might thus exist and vary with irradiance levels, which had not been considered in this study. Indeed, it has also been suggested that the factors limiting bacteria could change at a daily scale (Shiah, 1999; Kuipers et al., 2000). DOC produced by phytoplankton release could be a major source of carbon and energy for bacteria. The huge needs of nitrogen and energy source for heterotrophic bacteria, as well as their strong plasticity to grow again once limitation is relieved, are probably the key factors explaining the strong coupling between phytoplankton and bacteria as seen on diel cycles (Van Wambeke et al., 2008b).
5 Conclusions
A large set of enrichment experiments was performed here along a 8000 km transect, sometimes along vertical profiles, allowing a broad generalization of the observed trends over a large spatial scale of the South Pacific Ocean in an
aus-tral summer situation. Our enrichment experiments have shown that iron was never the single nutrient limiting bac-terial production. From the vicinity of the Marquesas Is-lands to approx 125◦W, the high response in the control sug-gests no limitation. Nitrogen was the first factor limiting het-erotrophic bacterioplankton within the surface layers in the centre of the south Pacific Gyre, with labile carbon acting sequentially as a second limiting factor. Overall the surface layers around the eastern border of the South Pacific Gyre (91◦W to the upwelling off Chile), labile carbon was the pri-marily factor limiting heterotrophic bacterial production.
Because the weak horizontal advection in the centre of the South Pacific Gyre and because intense seasonal convective mixing is excluded (Raimbault et al., 2008), this suggests that the situation of nitrogen limitation could be permanent throughout the entire year. However, nitrogen was a common primarily factor limiting both phytoplankton and bacteria, which probably had consequences on their relationships at short time scales. The heterotrophic bacterioplankton of the South Pacific Gyre lives in a very dynamic situation which is difficult to determine adequately, and current methods and tools for detecting limiting factors on short incubation time are urgently needed.
Acknowledgements. This work was supported by French program
PROOF (Processus biologiques dans l’oc´ean et flux), Centre Na-tional de la Recherche Scientifique (CNRS). This is a contribution of the BIOSOPE project of the LEFE-CYBER program. We also thank St´ephane Blain and Flavienne Bruyant for help in sample processing of trace metal clean experiments, Carolina Grob for collecting bacterial abundance samples on board, Herv´e Claustre for leadership of this program, and 2 anonymous reviewers who helped to improve this ms.
Edited by: M. Dai
References
Arrieta, J., Weinbauer, M., Lute, C., and Herndl, G.: Response of bacterioplankton to iron fertilization in the southern Ocean, Lim-nol. Oceanogr., 49, 799–808, 2004.
Blain, S., Bonnet, S., and Guieu, C.: Dissolved iron distribution in the tropical and sub tropical South Eastern Pacific, Biogeo-sciences, 5, 269–280, 2008,
http://www.biogeosciences.net/5/269/2008/.
Bonnet, S., Guieu, C., Bruyant, F., Pr´aˇsil, O., Van Wambeke, F., Raimbault, P., Moutin, T., Grob, C., Gorbunov, M., Zehr, J. P., Masquelier, S., Garczarek, L., and Claustre, H.: Nutrient limita-tion of primary productivity in the Southeast Pacific (BIOSOPE cruise), Biogeosciences, 5, 215–2225, 2008,
http://www.biogeosciences.net/5/215/2008/.
Bruland, K. W., Franks, R. P., Knauer, G. A. and Martin, J. H: Sam-pling and analytical methods for the determination of Cu, Cd. Zn, and Ni at the nanogram per liter level in sea water, Anal. Chim. Acta, 105, 234–245, 1979.
Carlson, C. A. and Ducklow, H. W.: Growth of bacterioplankton and consumption of dissolved organic carbon in the Sargasso Sea, Aquat. Microb. Ecol., 10, 69–85, 1996.
Cherrier, J., Bauer, J. E., and Druffel, E. R. M.: Utilization and turnover of labile dissolved organic matter by bacterial het-erotrophs in eastern North Pacific surface waters, Mar. Ecol. Prog. Ser., 139, 267–279, 1996.
Church, M., Hutchins, D., and Ducklow, H. W.: Limitation of bacte-rial growth by dissolved organic matter and iron in the Southern Ocean, Appl. Environ. Microbiol., 66, 455–466, 2000.
Claustre, H., Sciandra, A., and Vaulot, D.: Introduction to the spe-cial section Bio-optical and biogeochemical conditions in the South East Pacific in late 2004: the BIOSOPE program, Bio-geosciences, 5, 679–691, 2008,
http://www.biogeosciences.net/5/679/2008/.
Cochlan, W. P.: The heterotrophic bacterial response during a mesoscale iron enrichment experiment (IronEx II) in the East-ern equatorial Pacific Ocean, Limnol. Oceanogr., 46, 428–435, 2001.
Cotner, J., Ammermann, J., Peele, E., and Bentzen, E.: Phosphorus-limited bacterioplankton growth in the Sargasso Sea, Aquat. Mi-crob. Ecol., 13, 141–149, 1997.
Duhamel, S., Moutin, T., Van Wambeke, F., Van Mooy, B., Rim-melin, P., Raimbault, P., and Claustre, H.: Growth and specific P-uptake rates of bacterial and phytoplanktonic communities in the Southeast Pacific (BIOSOPE cruise), Biogeosciences, 4, 941– 956, 2007,
http://www.biogeosciences.net/4/941/2007/.
Donachie, S. P., Christian, J. R., and Karl, D. M.: Nutrient regula-tion of bacterial producregula-tion and ectoenzyme activities in the sub-tropical North Pacific Ocean, Deep-Sea Res. II, 48, 1719–1732, 2001.
Gran´eli, W., Carlsson, P., and Bertilsson, S.: Bacterial abundance, production and organic carbon limitation in the Southern Ocean (39–62◦S, 4–14◦E) during the austral summer 1997/1998, Deep-Sea Res. II, 51, 2569–2582, 2004.
Grob, C., Ulloa, O., Claustre, H., Huot, Y., Alarc´on, G., and Marie, D.: Contribution of picoplankton to the total particulate organic carbon concentration in the eastern South Pacific, Bio-geosciences, 4, 837–852, 2007,
http://www.biogeosciences.net/4/837/2007/.
Hutchins, D. A., DiTullio, G. R., Zhang, Y., and Bruland, K. W.: An Iron limitation mosaic in the California upwelling regime, Limnol. Oceanogr., 43, 1037–1054, 1998.
Kirchman, D. L.: The uptake of inorganic nutrients by heterotrophic bacteria, Microb. Ecol., 28, 255–271, 1994.
Kirchman, D. L.: Limitation of bacterial growth by dissolved or-ganic matter in the subarctic Pacific, Mar. Ecol. Prog. Ser., 62, 47–54, 1990.
Kirchman, D. L. and Rich, J.: Regulation of bacterial growth rates by dissolved organic carbon and temperature in the Equatorial Pacific Ocean, Microb. Ecol., 33, 11–20, 1997.
Kirchman, D. L., Meon, M., Cottrell, M. T., Hutchins, D. A., Weeks, D., and Bruland, K. W.: Carbon versus iron limitation of bacterial growth in the California upwelling regime, Limnol. Oceanogr., 45, 1681–1688, 2000.
Kirchman, D. L., Elifantz, H., Dittel, A., Malmstrom, R., and Cot-trell, M.: Standing stocks and activity of Archaea and Bacteria in the western Arctic Ocean, Limnol. Oceanogr., 52, 495–507,
2007.
Kuipers, B.: Diel periodicity of bacterioplankton in the euphotic zone of the subtropical Atlantic Ocean, Mar. Ecol. Prog. Ser., 201, 13–25, 2000.
McAndrew, P., Bjorkman, K., Church, M., Morris, P., Jachowski, N., Williams, P. J. le. B., and Karl, D.: Metabolic response of oligotrophic plankton communities to deep water nutrient enrich-ment, Mar. Ecol. Prog. Ser., 332, 63–75, 2007.
Moutin, T., Karl, D. M., Duhamel, S., Rimmelin, P., Raimbault, P., Van Mooy, B. A. S., and Claustre, H.: Phosphate availability and the ultimate control of new nitrogen input by nitrogen fixation in the tropical Pacific Ocean, Biogeosciences, 5, 95–109, 2008, http://www.biogeosciences.net/5/95/2008/.
Obernosterer, I., Catala, P., Lami, R., Caparros, J., Ras, J., Bricaud, A., Dupuy, C., Van Wambeke, F. and Lebaron, P.: Biochemical characteristics and bacterial community structure of the sea sur-face microlayer in the South Pacific Ocean, Biogeosciences, 5: 693–705, 2008a.
Obernosterer, I., Christaki, U., Lef`evre, D., Catala, P., Van Wambeke, F., and Lebaron, P.: Rapid bacterial mineralization of organic carbon produced during a phytoplankton bloom in-duced by natural iron fertilization in the Southern Ocean, Deep-Sea Res. II, 55, 777–789, 2008b.
Olivier, J. L., Barber, R. T., Smith, W. O., and Ducklow, H. W.: The heterotrophic bacterial response during the southern Ocean Iron Experiment (SOFeX), Limnol. Oceanogr., 49, 2129–2140, 2004. Pakulski, J. D., Coffin, R. B., Kelley, C. A., Holder, S. L., Downer, R., Aas, P., Lyons, M. M., and Jeffrey, W. H.: Iron stimulation of Antarctic bacteria. Nature, 383, 133–134, 1996.
Pinhassi, J., G´omez-Consarnau, L., Alonso-S´aez, L., Sala, M., Vi-dal, M., Pedr´os-Ali´o, C., and Gasol, J.: Seasonal changes in bacterioplankton nutrient limitation and their effects on bacterial community composition in the NW Mediterranean Sea, Aquat. Microb. Ecol., 44, 241–252, 2006.
Pomeroy, L. R., Sheldon, J. E., Sheldon, W. M., and Peters, F.: Limits to growth and respiration of bacterioplankton in the Gulf of Mexico, Mar. Ecol. Prog. Ser., 117, 259–268, 1995.
Raimbault, P., Garcia, N.: Evidence for efficient regenerated pro-duction and dinitrogen fixation in nitrogen-deficient waters of the South Pacific Ocean: impact on new and export production esti-mates, Biogeosciences, 5, 323–338, 2008
Raimbault, P., Garcia, N., and Cerutti, F.: Distribution of inorganic and organic nutrients in the South Pacific Ocean - Evidence for long-term accumulation of organic matter in nitrogen-depleted waters, Biogeosciences, 5, 281–298, 2008,
http://www.biogeosciences.net/5/281/2008/.
Ras, J., Claustre, H., and Uitz. J.: Spatial variability of phytoplank-ton pigment distributions in the Subtropical South Pacific Ocean: comparison between in situ and predicted data, Biogeosciences, 5, 353–369, 2008,
http://www.biogeosciences.net/5/353/2008/.
Sala, M. M., Peters, F., Gasol, J. M., Pedr´os-Ali´o, C., Marrass´e, C., and Vaqu´e, D.: Seasonal and spatial variations in the nu-trient limitation of bacterioplankton growth in the northwestern Mediterranean, Aquat. Microb. Ecol., 27, 47–56, 2002. Shiah, F. K.: Diel cycles of heterotrophic bacterioplankton
abun-dance and production in the ocean surface waters, Aquat. Microb. Ecol., 17, 239–246, 1999.
Van Wambeke, F.: Molecular distribution and bacterial availabil-ity of dissolved sugars in the south East Pacific, Biogeosciences Discuss., 5, 725–750, 2008,
http://www.biogeosciences-discuss.net/5/725/2008/.
Tedetti, M., Semp´er´e, R., Vasilkov, A., Charri`ere, B., N´erini, D., Miller, W. L., Kawamura, K., and Raimbault, P.: High pene-tration of ultraviolet radiation in the south east Pacific waters, Geophys. Res. Lett., 34, L12610, doi:10.1029/2007GL029823, 2007.
Thingstad, T.: Control of bacterial growth in idealized food webs, in: Microbial Ecology of the Oceans, edited by: Kirchman, D. L., Wiley-Liss, New York, 239–260, 2000.
Thingstad, T., Krom, M., Mantoura, F., Flaten, G., Groom, S., Herut, B., Kress, N., Law, C., Pasternak, A., Pitta, P., Psarra, S., Rassoulzadegan, F., Tanaka, T., Tselepides, A., Wassmann, P., Woodward, M., Riser, C., Zodiatis, G., and Zohary, T.: Nature of phosphorus limitation in the ultraoligotrophic eastern Mediter-ranean, Science, 309, 1068–1071, 2005.
Tortell, P. D., Maldonaldo, M. T., Granger, J., and Price, N. M.: Ma-rine bacteria and biogeochemical cycling of iron in the oceans, FEMS Microb. Ecol., 29, 1–11, 1999.
Tortell, P. D., Maldonado, M. T., and Price, N. M.: The role of heterotrophic bacteria in iron-limited ecosystems. Nature, 383, 330–332, 1996.
Torr´eton, J.-P., Talbot, V., and Garcia, N.: Nutrient stimulation of bacterioplankton growth in Tuamotu atoll lagoons, Aquat. Mi-crob. Ecol., 21, 125–137, 2000.
Van Wambeke, F., Christaki, U., Giannakourou, A., Moutin, T., and Souvemerzoglou, K.: Longitudinal and vertical trends of bacte-rial limitation by phosphorus and carbon in the Mediterranean Sea, Microb. Ecol., 43, 119–133, 2002.
Van Wambeke, F., Obernosterer, I., Moutin, T., Duhamel, S., Ulloa, O., and Claustre, H.: Heterotrophic bacterial production in the South East Pacific: Longitudinal trends and coupling with pri-mary production, Biogeosciences, 5, 157–169, 2008a,
http://www.biogeosciences.net/5/157/2008/.
Van Wambeke, F., Tedetti, M., Duhamel, S., and Semp´er´e, R.: Diel variability of heterotrophic bacterial production and UV doses in the South East Pacific, Biogeosciences Discuss., 5, 435–462, 2008b,
http://www.biogeosciences-discuss.net/5/435/2008/.
Zohary, T., and Robarts, R. D.: Experimental study of microbial P limitation in the eastern Mediterranean, Limnol. Oceanogr., 43, 387–395, 1998.