HAL Id: hal-02302451
https://hal.archives-ouvertes.fr/hal-02302451
Submitted on 12 Nov 2019HAL is a multi-disciplinary open access archive for the deposit and dissemination of sci-entific research documents, whether they are pub-lished or not. The documents may come from teaching and research institutions in France or abroad, or from public or private research centers.
L’archive ouverte pluridisciplinaire HAL, est destinée au dépôt et à la diffusion de documents scientifiques de niveau recherche, publiés ou non, émanant des établissements d’enseignement et de recherche français ou étrangers, des laboratoires publics ou privés.
Competitive adsorption of PAM and HPAM on siliceous
material
H. Bessaies-Bey, J. Fusier, M. Hanafi, S. Zhang, Mathias Destarac, S. Jouenne,
N. Passade-Boupat, F. Lequeux, J.-B. D’espinose de Lacaillerie, N. Sanson
To cite this version:
H. Bessaies-Bey, J. Fusier, M. Hanafi, S. Zhang, Mathias Destarac, et al.. Competitive adsorption of PAM and HPAM on siliceous material. Colloids and Surfaces A: Physicochemical and Engineering Aspects, Elsevier, 2019, 579, pp.123673. �10.1016/j.colsurfa.2019.123673�. �hal-02302451�
1
Competitive adsorption of PAM and HPAM on
1Siliceous Material
2H. Bessaies-Beya,b,c,d,†
, J. Fusiera,b,c,d,†, M. Hanafia, S. Zhanga, M. Destarace, S. Jouenneb,c,d, N.
3
Passade-Boupatb,c,d, F. Lequeuxa,b, J.-B. d'Espinose de Lacailleriea,b, N. Sansona,b *
4
aLaboratoire Sciences et Ingénierie de la Matière Molle, ESPCI Paris, PSL 5
University, Sorbonne Université, CNRS, F-75005 Paris. 6
b
Laboratoire Physico-chimie des Interfaces Complexes, ESPCI Paris, 10 rue Vauquelin, F-75231 7
Paris, France. 8
cTOTAL CSTJF, Avenue Larribau, Pau, France. 9
dBâtiment CHEMSTARTUP, Route Départementale 817, 64170 Lacq, France. 10
e
Université Paul Sabatier, Laboratoire des Interactions Moléculaires et de la Réactivité Chimique et 11
Photochimique, UMR-CNRS 5623, Bât 2R1, 118 route de Narbonne, 31062 Toulouse, France. 12
13
* Corresponding author. 14
E-mail address: nicolas.sanson@espci.fr (N. Sanson) 15
Present address: Soft Matter Science and Engineering laboratory, CNRS UMR 7615, ESPCI Paris, 16
PSL University, Sorbonne Université, F-75005 Paris. Phone: +33 140 794 417 17
18 †
H. B. and J. F. contributed equally to this work
19 20 Keywords: 21 Silica 22 Polyacrylamide (PAM/HPAM) 23 Competitive adsorption 24
Size exclusion chromatography (SEC) 25
Enhanced oil recovery (EOR) 26
27 28
2
ABSTRACT
29
The present work aims at studying the outcome and kinetics of competitive adsorption
30
between low and high molar mass chains of neutral polyacrylamide (PAM) or partially
31
hydrolyzed polyacrylamide (HPAM) in aqueous solution at the surface of siliceous material.
32
Monodisperse neutral and charged polymers, PAM and HPAM, were synthesized by
33
RAFT/MADIX polymerization and their adsorption alone or in competitive process was
34
studied. The analysis of adsorption measurements were carried out quantitatively by size
35
exclusion chromatography which allows for distinguishing the relative adsorption of the
36
chains depending on their molar masses. The effect of the average molar mass, dispersity as
37
well as the kinetics of the displacement of pre-adsorbed polymer chains onto the surface by
38
longer chains was investigated. We evidenced that both PAM and HPAM exhibit the same
39
trend. Close to surface saturation, the high molar mass chains desorb polymer chains of lower
40
molar mass. Moreover, by mixing different monodisperse polymer we were able to model the
41
behavior of the polydisperse systems usually encountered in practical applications. By
42
following adsorption over time, our results show that while low molar mass polymers diffuse
43
rapidly and adsorb first, they are displaced by high molar mass ones once they reach the
44
surface. This result remains unchanged even if the low molar mass chains are added several
45
hours before the higher ones showing that there is no kinetic limitation to the displacement of
46
low molar mass PAM and HPAM by higher molar mass ones. The understanding and
47
prediction of this complex competitive adsorption behavior over time is of utter importance
48
for the control of the mechanism of action of these polymers notably in industrial processes.
49
50
51
INTRODUCTION
52
The competitive adsorption of polymers, i.e. the exchange of macromolecules onto
53
solid surfaces, a phenomenon occurring in numerous application where polymer adsorption is
54
involved, has been widely studied since the 1970s. Understanding and controlling the
55
competitive adsorption between polymer chains of different average molar mass is of great
56
interest in lots of industrial processes.
57
Indeed, polymers, and in particular neutral (PAM) or partially hydrolyzed (HPAM)
58
polyacrylamides are used in a wide range of industrial applications, such as water treatment
59
by flocculation of particles1, soil stabilization,2, 3
agriculture,4 cement flow control,5-7 and last
3
but not least, in the field of enhancement oil recovery (EOR) where acrylamide based
61
polymers are massively used mainly to increase the viscosity of the injected fluid.8 The study
62
of competitive adsorption is of particular interest in this last case where PAM or HPAM of
63
very high average molar mass with broad molar mass distributions are involved. Indeed,
64
during oil recovery, injection of such polymers in the injection well leads to a rapid injectivity
65
loss which negatively impacts the process. Despite its tremendous effect on the ability or not
66
to effectively recover the oil from the field, the origins of this injectivity loss such as
67
hydrodynamic retention, mechanical entrapment or adsorption are still a matter of debate.
68
Recently, Bessaies-Bey et al. showed that polymer adsorption is the leading cause for the loss
69
of injectivity sometimes suffered by the oil industry as it can lead to permeability reductions
70
by orders of magnitudes.9Thus, the characterization of the adsorption of PAM or HPAM onto
71
siliceous materials and particularly the competition between polydisperse species is a key
72
point to reduce those perturbing effects. Although, polymer adsorption in general has been
73
extensively studied in the literature both at the experimental and theoretical level, to the best
74
of our knowledge, the competitive adsorption of PAM or HPAM of different lengths on
75
siliceous materials has been never investigated which is surprising considering their intensive
76
use in various industrial contexts.
77
Concerning the competitive adsorption of polymers having different average molar
78
masses, three main cases emerge from the literature: uncharged macromolecules10-15 and
79
polyelectrolytes in high16and low16, 17 salt content medium. Even if it is globally admitted that
80
in the first two cases longer polymer chains preferentially adsorb to the substrate following
81
entropic considerations18 while in the third case it is the shorter polymer chains that are
82
preferred because the system is then driven by the electrostatic energy balance, some
83
questions remain:
84
(i) Firstly, regarding the experimental works cited above, the kinetics of
85
desorption/adsorption depends on several parameters such as the average molar mass and the
86
mass dispersity, the structure of the polymer chain, its chemical nature and the mechanism of
87
adsorption. Reported experiments on the adsorption of polyacrylamide on natural quartz
88
revealed that polymer adsorption is due to the formation of multiple hydrogen bonding
89
between the polymer chains and both silanol and aluminol groups present on the natural
90
quartz surface.9, 19 Then the repartition and proportion of anchoring sites at the surface of
91
substrate may play a major role on the competition between species. In this particular case,
92
does the adsorption of larger macromolecules still prevail?
4
(ii) Moreover in EOR applications, most of the so-called polyacrylamides are in fact
94
partially hydrolyzed and weakly negatively charged. In this intermediate case between the
95
neutral polymer and polyelectrolyte case, what is the impact of the average molar mass of the
96
polymer on adsorption keeping the density of anionic groups constant?
97
(iii) Most of the experimental studies concerning competitive adsorption cited above
98
have been performed in organic solvent with specific conditions which are far from the
99
industrial reality. For instance, in applications concerning PAM/HPAM adsorption to natural
100
quartz, water is the reference solvent which can complicate the system because it interacts
101
both with the polymer and the oxide.
102
The present work aims at addressing carefully the issue of PAM/HPAM adsorption on
103
silicates by studying the outcome and kinetics of competitive adsorption between low and
104
high molar mass PAM or HPAM in aqueous solution at the surface of model siliceous
105
material. We first present a method of analysis of adsorption experiments based on Size
106
Exclusion Chromatography (SEC) which allows for a quantitative determination of the
107
relative amount of adsorbed polymer chains of different molar masses. Adsorption
108
experiments were performed using monodisperse PAM and HPAM in a broad range of molar
109
masses from 10 to 1000 kg/mol. These polymers, synthesized by RAFT/MADIX
110
polymerization,20 allowed us not only to investigate the adsorption behavior of the polymer
111
alone in solution but also to model the behavior of industrial polymers (high dispersity) by
112
mixing several monodisperse polymers. Finally, we focused on the kinetics of displacement
113
of polymer chains pre-adsorbed onto the surface as a function of the pre-adsorption time.
114 115
MATERIALS AND METHODS
116
Materials. Siliceous materials. Crystallized natural quartz (99.5 % SiO2, 0.5 % Al2O3),
117
named Sikaisol was acquired from Sika (Specific area S=0.56 m2/g, determined by BET
118
Nitrogen adsorption; bulk density =2650 kg/m3; mean particle diameter D=50 µm),
119
Polymers. Acrylamide (AM) (40 % aqueous solution) and acrylic acid (AA) (99 %) were
120
purchased from Sigma-Aldrich. Well-defined PAMs and P(AM-st-AA)s with different
121
average molar masses and anionicity were synthesized by Reversible Addition Fragmentation
122
chain Transfer / Macromolecular design by interchange of xanthates (RAFT/MADIX)
123
polymerization according to a modified version of the protocol we previously reported.20
124
Using a low molar mass (DPn ~ 7) polyacrylamide macro-RAFT/MADIX agent, the
125
polymerization of Am or Am/AA mixtures was performed at 25 °C at 20 wt% in water for 2h,
5
using the ammonium persulfate (APS) / sodium formaldehyde sulfoxylate dihydrate redox
127
initiator. The pH of the reaction mixture was adjusted to 6 prior to polymerization. The
128
resulting polymer was freeze-dried before storage in order to remove water and traces of
129
residual monomer. The characteristics of the polymers such as average molar mass, dispersity
130
and the degree of anionicity are gathered in Table 1. The synthesized statistical polymers
131
P(AM-st-AA) will be assimilated to hydrolyzed polyacrylamide and noted HPAM-X where X
132
indicates the average molar mass (Table 1).
133
Adsorption experiments. 4 g of quartz particles were first mixed in a bottle with 10 mL of
134
polymer solutions with concentrations ranging from 10 ppm to 200 ppm. Experiments were
135
conducted at the pH of pure water in presence or absence of CaCl2. Adsorption experiments
136
were conducted at a solid/liquid ratio of 0.4. The bottles were left rolling at constant
137
temperature (23 °C) during 2 hours. The quartz particles were then removed by centrifugation
138
at 6000 g for 15 min to extract the interstitial solution. The supernatant was analyzed with one
139
of the methods described below, namely Total Organic Carbon (TOC) and/or Size Exclusion
140
Chromatography (SEC).
141
Total Organic Carbon (TOC). Total Organic Carbon experiments were performed on a
TOC-142
VCSH (Shimadzu). The TOC analyzer was first calibrated with reference polymer solutions
143
of known concentrations and by analyzing the liquid phase of the quartz suspension without
144
any polymer. By comparison between this reference value and the measured organic carbon
145
amount in the water extracted from polymer adsorption experiments, the amount of polymer
146
adsorbed on natural quartz was computed. This technique assumes that the difference between
147
polymer concentration before and after contact with quartz particles is only owed to
148
adsorption at the surface of particles.
149
Size Exclusion Chromatography (SEC) and data treatment. Size exclusion chromatography
150
was performed on a Malvern Viscotek TDA 302 system triple detector equipped with three
151
OH-pak SB-806M HQ columns in series and a guard column. The mobile phase is an aqueous
152
solution at 0.2 M NaNO3 and the flow-rate is 0.7 mL/min. 100 µL of each sample is passed
153
once in the set of columns before detection. The number- and weight average molar masses
154
(respectively Mn and Mw) and dispersity (Ð=Mw/Mn) were derived from a universal calibration
155
curve based on poly(ethylene oxide) standards from Malvern. Compared to TOC analysis,
156
SEC experiments allows both to distinguish and quantify the polymers depending on their
157
average molar mass.
6
The chromatograms obtained from the measured refractive index as a function of the retention
159
volume are fitted with log normal distribution in order to extract the area under the
160
chromatograms which was further used to estimate the concentration of a given polymer in a
161
solution containing polyacrylamide with different average molar mass.21 As an example, a
162
SEC chromatogram of a polymer solution containing PAM-10K and PAM-1000K is shown in
163
Figure S1 in Supporting Information. The area under each peak can be correlated to its
164
concentration through pre-determined calibration curves.
165
166
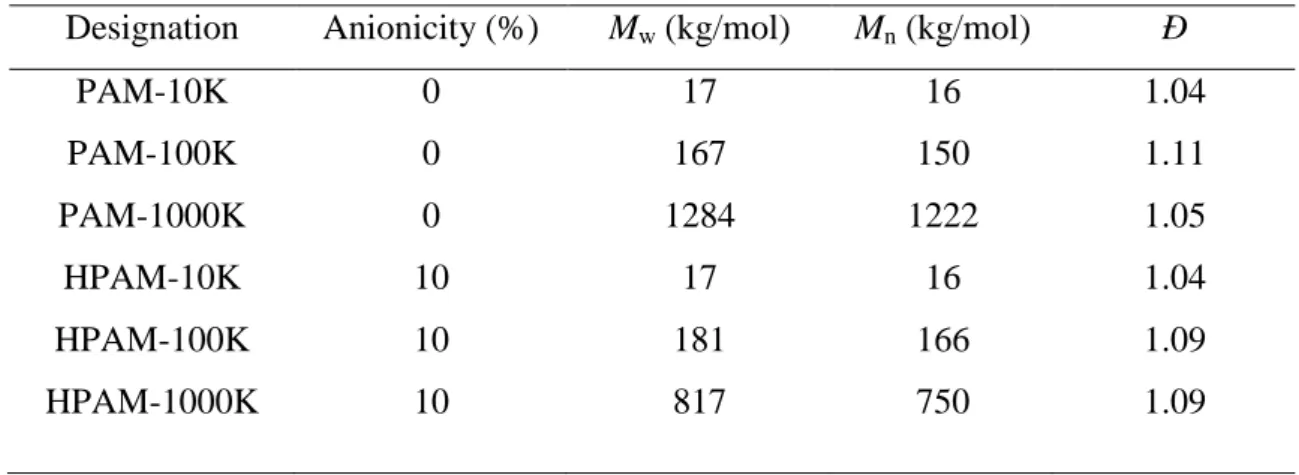
Table 1: Main characteristics of PAM and HPAM used in this study
167
Designation Anionicity (%) Mw (kg/mol) Mn (kg/mol) Ð
PAM-10K PAM-100K PAM-1000K HPAM-10K HPAM-100K HPAM-1000K 0 0 0 10 10 10 17 167 1284 17 181 817 16 150 1222 16 166 750 1.04 1.11 1.05 1.04 1.09 1.09 168 169 170 171
RESULTS AND DISCUSSION
172
Adsorption of PAM/HPAM on natural quartz
173
We first quantified the amount of adsorbed polymer on natural quartz of PAM in pure
174
water and anionic HPAM in CaCl2 solution with TOC experiments. As shown in Figure 1,
175
the amount of adsorbed polymer steeply increased with the polymer concentration with values
176
of the initial slope varying from 40 to 300 ml/m2 characteristic of a high affinity between the
177
polymer and the particle surface.22, 23 This increase was immediately followed by an
178
adsorption plateau at high polymer concentration, which corresponds to full surface coverage.
179
It is now well established that the driving force of the adsorption of acrylamide-based
180
polymers on siliceous materials is the formation of multiple hydrogen bonds between the
181
amide groups of the polymers and hydroxyl groups on the silica surface,24 and this adsorption
182
is exacerbated by the presence of aluminol groups.9 The amount of adsorbed polymer can also
7
be impacted by the physicochemical parameters of the polymer/particle system (pH,
184
temperature, ...) and notably the presence of electrolyte in solution which can decrease the
185
solubility of the polymer chains in solution and consequently increase the adsorbed amount.
186
In our two systems, PAM/H2O and HPAM/H2O/CaCl2, both polymer chains are in good
187
solvent as reported in the literature and in Figure S2 (Supporting information) respectively.
188
At the pH of the suspensions (pH=6), both the HPAM and the silica surface groups are
189
negatively charged. However, during the adsorption of HPAM on natural quartz, the presence
190
of CaCl2 screens the electrostatic repulsions between the HPAM and the silica surface. Hence,
191
HPAM in CaCl2 solution behaved, as expected, similarly to PAM in pure water.
192
We moreover note that the maximum adsorption plateau, max, increases when the average
193
molar mass of the polymer increases as shown in Figure 1c. Indeed, for both PAM/H2O and
194
HPAM/H2O/CaCl2 systems, the maximum adsorption value varies as a function of molar
195
mass following a power law with a power exponent of 0.14. This value is consistent with the
196
reported values for uncharged macromolecules adsorbed on silica.14, 22, 25
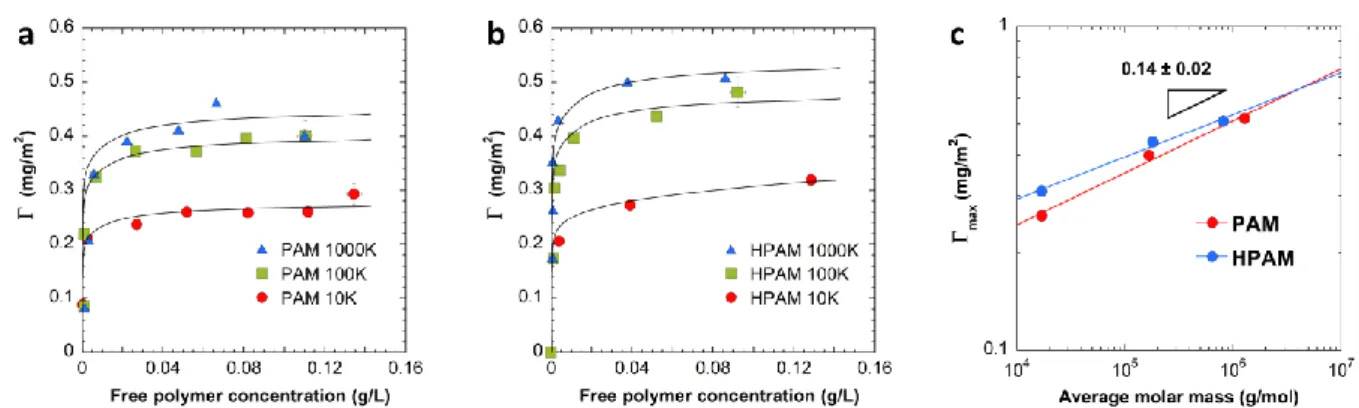
197 198 199
Figure 1: Adsorption isotherms on natural quartz for (a) PAM in pure water and (b) HPAM in CaCl2 solution (I=0.035 M). The lines are guides for the eyes (c) Maximum adsorption amount, max, as a function of the average molar mass of acrylamide-based polymers.
200
Mixing monodisperse PAM or HPAM of different average molar masses: Towards a better
201
understanding of competitive adsorption of industrial polymers
202
This part aims at understanding the effect of the dispersity of industrial PAMs or
203
HPAMs on adsorption by modelling them with a well-controlled distribution of molar masses
204
reconstructed from highly monodisperse batches (see Table 1). Experiments were conducted
205
with either a mixture of PAM-10K, PAM-100K and PAM-1000K or 10K,
8
100K and HPAM-1000K, with the same weight fraction for each component. We chose to
207
study the competitive adsorption of the three polymers by mass and not by number of chains
208
for reasons of SEC sensitivity and viscosity of solution. Indeed conducting the study in terms
209
of number of chains would result in a difference of two orders of magnitude between the mass
210
concentrations between polymers having the lowest and the highest average molar mass.
211
Knowing both Mn and Mw of each polymer, it is possible to compute the dispersity, Ð, of the
212
polymer mixtures. Dispersities of 11.4 and 7.9 were targeted, for PAM and HPAM mixture
213
respectively, which is fairly representative of what can be used in industrial applications. The
214
same adsorption protocol as for the individual polymer adsorption experiments was followed.
215
Natural quartz particles are mixed with a solution of polymers mixture of varying
216
concentrations for 24 hours at a solid to liquid ratio of 30 wt%. After centrifugation, the
217
supernatant was then characterized with SEC. Figure S3 in Supporting information shows the
218
chromatogram of supernatant (i.e. non adsorbed polymer solution) obtained with a refractive
219
index detector for different initial concentrations of PAM-10K, PAM-100K and PAM-1000K
220
mixtures. The fitting of these chromatograms allows to determine the quantities of each mass
221
distribution remaining in solution and consequently the quantities adsorbed onto the surface.
222
Thereby the competitive adsorption of each polymer solutions containing three monodisperse
223
polymers onto natural quartz particles can be plotted. For both polymer mixtures, PAM
224
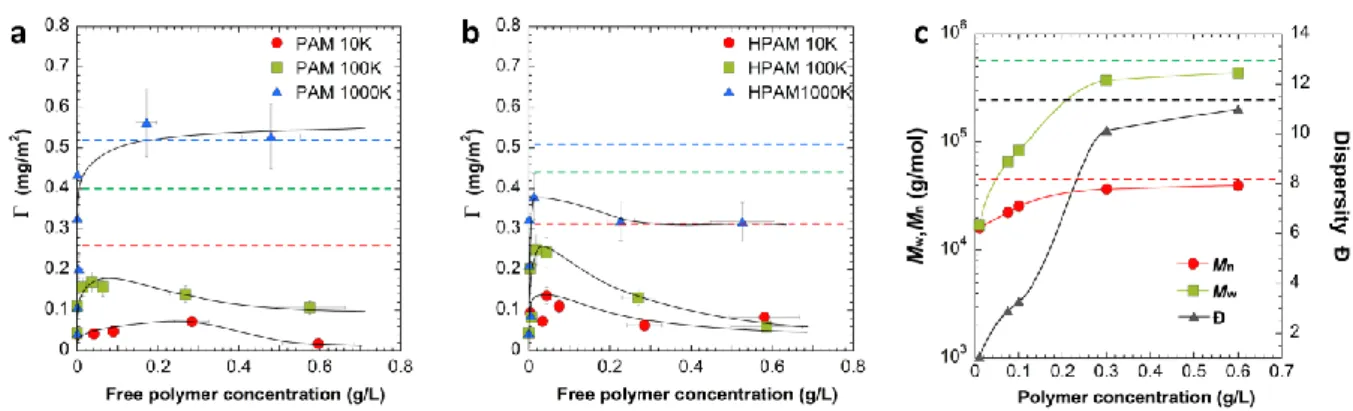
(Figure 2a) and HPAM (Figure 2b), the adsorption isotherm could be divided in two parts.
225
First, at low concentrations of polymers, i.e. lower than 0.05 g/L, all species present in
226
solution adsorbed on particles because there is enough space at the particles surface. This
227
interpretation was supported by the chromatograms of the supernatant (Figure S3 in
228
Supporting information) where no polymers are detected in regards to the detection limits of
229
the SEC technique. As illustrated in Figure 2a and 2b, when increasing the polymer
230
concentration, the adsorbed amount for the two polymers having the lowest average molar
231
masses progressively decreased and tended toward zero while the polymer with the higher
232
molar mass continued to adsorb onto particles until the saturation of the particles surface
233
made it impossible to absorb more polymer chains onto it. In the case of the PAM mixture, we
234
observed that the adsorption of the PAM-1000K reached the same adsorption value, max
235
0.5 mg/m2 as the one obtained by TOC for the polymer alone (Figure 1a). However, for the
236
HPAM mixture it is worth noting that the adsorption of HPAM-1000K was significantly
237
lower (0.3 mg/m2) than the one of the polymer alone, max 0.5 mg/m². A possible
238
explanation would be that the ionic strength was too low to fully screen the particles surface
239
charges as previously reported.9 Then, electrostatic repulsion occurred either between the
9
particle surface groups and the HPAM polymer or between HPAM adsorbed on the particle
241
surface and free HPAM chains thus reducing its adsorption. In any case, the adsorption of
242
polydisperse PAM and partially screened HPAM led to the same behavior, i.e. the adsorption
243
of the polymer chains having the higher molar mass prevailed considerably over the shorter
244
polymer chains present in solution. Nevertheless, as shown the Figure 2a and 2b, for both
245
PAM and HPAM systems some polymer chains with lower molar masses still remained on
246
the surface.
247
Furthermore, it is also possible to calculate from these data the Mn, Mw and Ð values of the
248
supernatant composition for each concentration of polymer mixtures. To a certain extent,
249
these mixtures model the properties of a polymer with large dispersity during competitive
250
adsorption. The respective evolutions of each parameter are highlighted in Figure 2c. At low
251
surface coverage, the supernatant composition was very close from a pure solution of
PAM-252
10K in terms of Mn and Mw, with a dispersity close to 1. Then the dispersity and both the
253
number- and weight-average molar mass of the polymer mixture present in the supernatant
254
increased with concentration meaning that polymer chains having the highest molar mass start
255
to be present in the supernatant. This is due to the fact that the polymer chains with the
256
highest molar mass preferentially impact the weight-average molar mass of the polymer
257
mixture. Finally at higher dosage the macromolecular parameters (Mn, Mw and Ð) tended
258
toward the properties of the initial mixtures (PAM-10K, PAM-100K and PAM-1000K equal
259
in weight proportions) illustrated by dashed lines in Figure 2c. This meant that the surface
260
was saturated and the polymer chains with different molar mass were present in the
261
supernatant. These observations were consistent with reported studies showing a modification
262
of the chromatogram of the supernatant after adsorption of polydisperse polymers on silica
263
particles.14, 26
264 265
10
solution (I=0.035 M) with 24h contact time. The solid lines are guides for the eyes. The dashed lines represent the maximum adsorption value, max, when the polymer is alone in solution. (c) Evolution of the average molar masses, Mw and Mn, and dispersity Ð of the supernatant during competitive adsorption on natural quartz of a mixture of PAM-10K, PAM-100K and PAM-1000K as a function of the initial concentration of polymers mixture. The solid lines are guides for the eyes. The dashed lines correspond to the Mw, Mn and Ð of the initial polymer mixture.
266 267
Adsorption-desorption kinetic aspects
268
As observed in the previous section, the longer polymer chains, PAM-1000K or
269
HPAM-1000K in electrolyte solution, adsorb preferentially on natural quartz to the detriment
270
of polymer chains of molar masses lower by one or two orders magnitude. However, it should
271
be kept in mind that literature results suggest that regardless of differences in molar masses,
272
kinetics of adsorption/desorption can vary over orders of magnitude depending on the
273
polymer structure, the substrate properties (chemical nature, porosity...) and the resulting
274
adsorption driving force as well as the equilibrium time of the preadsorbed polymer chains.
275
Indeed, Kawaguchi et al. studied by ellipsometry the competitive adsorption onto platinum
276
plate between on the one hand 102 and 775 kg/mol, and on the other hand 422 and 775
277
kg/mol polystyrene in theta conditions.27 The authors reported that the kinetics of
278
displacement by 775 kg/mol polymer chains of 442 kg/mol polystyrene is slower than for 102
279
kg/mol. Then, they noted that the displacement of shorter polymer chains is complete after
280
20h. The same observations have been made by Fu et al. for the competitive adsorption of
281
poly(ethylene oxide) chains having different molar masses on glass.12, 28 However, they
282
noticed that short PEO chains become more difficult to displace from the surface when their
283
contact time with the interface or the relative molar mass of the preadsorbed polymer chains is
284
increased.29 Conversely, rapid and total displacement, on the order of several hours, have been
285
also observed in the literature for polystyrene/silica system.14, 30 In summary, we can conclude
286
from the literature that the kinetics of displacement of adsorbed polymer chains is highly
287
system dependent.
288
In this section, we thus report the kinetic aspects of competitive adsorption using SEC
289
experiments either by sequential (i.e. by contacting the surface with the shorter polymer
290
chains during a certain period of time prior to injection of the polymer chains with the higher
291
molar mass) or simultaneous coadsorption of two PAM polymers. By this set of experiments,
292
we tried to answer two questions: How fast does the desorption occurs? And how long does it
11
take to reach equilibrium? For that purpose, two competitive adsorption experiments were
294
carried out. First, PAM-10K and PAM-1000K were simultaneously put in contact with natural
295
quartz particles at an initial concentration of 0.2 g/L which corresponds to the saturation
296
regime on the particles surface. Then after a time varying from 5 minutes to several hours
297
after addition of both polymers, the samples were centrifugated and the supernatant
298
characterized with SEC. For the second experiment, the short polymer chains, PAM-10K,
299
were first put in contact with natural quartz particles. Thereafter, two different delayed times
300
of addition of the high molar mass polymer PAM-1000K have been investigated to highlight
301
the effect of contact time, i.e. 2 and 24 hours. Afterwards, after 5 minutes to several hours, as
302
in the previous experiment, the samples were centrifugated and the supernatant characterized
303
with SEC. The results are gathered in Figure 3.
304
In the case of coadsorption where both polymers are put simultaneously in contact with
305
natural quartz particles (Figure 3a), two regimes were clearly observed. For contact time
306
between the polymers and the natural quartz lower than 30 min, we observed that both
307
polymer chains adsorbed onto the surface. This is due to the fact that shorter polymer chains
308
diffuse much faster than the longer ones and then reach the surface in first.31 Then, after
309
around 30 minutes of contact time, the PAM-1000K chains remained adsorbed onto the
310
surface whereas the amount of adsorbed PAM-10K started to decrease. As experimentally
311
reported in the literature by Fu et al. the desorption of short chains from the surface begins
312
only when the mass saturation of the surface reaches the one expected when adsorbing of
313
shorter chains alone, here 0.3 mg/m2 for PAM-10K.12 One hour after the contact time, t0,
314
corresponding to the introduction time of PAM-1000K, the maximum adsorbed amount was
315
reached, i.e. 0.5 mg/m2. Surprisingly, the desorption of PAM-10K was not complete even
316
after 24 hours. For neutral polymer such as PAM, displacement of short chain polymers was
317
expected since in theory, the free energy of an adsorbed polymerchain is directly proportional
318
to the polymerization degree and consequently to its molar mass.32 For HPAM, electrostatic
319
considerations complicate the matter but, as we have seen above, their behavior in presence of
320
salts is very similar to the one of a neutral polymer due to charge screening. The fact that
321
some short chain polymer remained adsorbed is more puzzling and remains an open question.
322
It could be due to a slow down diffusion of the small polymers in the larger polymer adsorbed
323
layer or to an additional chemical potential term due to polymers concentration near the
324
surface. Figure 3b and 3c show the delayed competitive adsorption between PAM-10K and
325
PAM-1000K, that is when the long polymer chains PAM-1000K were put in contact with a
326
delay time of t0=2h and t0=24h after the introduction of the shorter chains. As soon as the
12
PAM-1000K is added to the sample, PAM-10K started desorbing whereas adsorption of
328
PAM-1000K increased which means that the contact time between PAM-10k and natural
329
quartz particles did not play a significant role on the kinetics of displacement of short polymer
330
chains by the longer ones.
331
Nevertheless, we can notice that in both cases, simultaneous coadsorption (Figure 2 and
332
Figure 3a) or sequential adsorption (Figure 3b and 3c), a small amount of shorter chains
333
remain adsorbed on the surface. Two hypothesis can explained this observation. First this
334
could reflect the occurrence of a few high energy adsorption sites on the natural quartz
335
surface. This hypothesis is supported by the fact that two kind of adsorption sites are present
336
on the natural quartz surface investigated in this study, i.e. silanol and aluminol groups.
337
Indeed, we have previously shown that the presence of aluminol groups on natural quartz
338
surface further increases the adsorption of acrylamide-based polymers.9, 33 This could explain
339
the fact that some polymer chains still remain adsorbed on the particle surface despite the
340
presence of polymer chains of higher molar mass. A second tentative explanation could be
341
that despite the desorption of adsorbed chains by the longer ones, several shorter polymer
342
chains can occupied the residual surface onto quartz particles and explain the observed
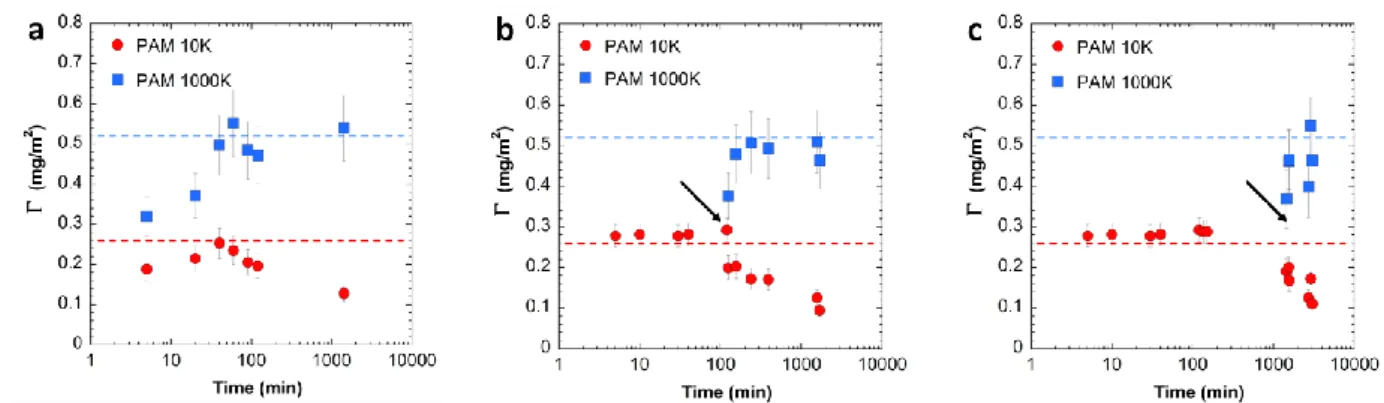
343 results. 344 345 346 347
Figure 3: Competitive adsorption in time between PAM-10K and PAM-1000K at 0.2 g/L on natural quartz either by (a) coadsorption (t=0) or after a delay of (b) t=2h and (c) t=24h. The dashed lines represent the maximum adsorption value, max, when the polymer is alone in solution. The arrow indicates the time (t0) where the PAM-1000K is put in contact with the natural quartz/PAM-10K system. For the coadsorption, t0=0 min.
13
CONCLUSION
349
In the present work, thanks to the coupling of size exclusion chromatography
350
technique and the use of well-controlled polymers in size and distribution, we clarified the
351
mechanism of competitive adsorption of PAM and HPAM on natural quartz. We evidenced
352
that neutral and charged polyacrylamide exhibit the same behavior in presence of salts. Once
353
the surface is mass saturated from the point of view of shorter polymer chains, the longer ones
354
start desorbing the short ones. Besides, the contact time between the polymer and the surface
355
did not seem to affect the mechanism involved. Even when the low molar mass chain
356
polymers were added several hours before the higher ones, the outcome of competitive
357
adsorption remained unchanged. However, we observed that even after a long equilibrium
358
time, few polymer chains remained adsorbed onto the surface suggesting either the possible
359
presence of anchoring sites with different adsorption energy or residual surface onto quartz
360
particles. Moreover, by mixing different monodisperse polymers we were able to model a
361
polydisperse system close to the real polydisperse macromolecules effectively encountered in
362 industrial contexts. 363 364 ACKNOWLEDGEMENTS 365
We thank S. Harrisson for this help for the polymer synthesis. The authors gratefully
366
acknowledge TOTAL (France) for financial support.
367
368
REFERENCES
369
370
1. J. Gregory, S. Barany, Adsorption and flocculation by polymers and polymer mixtures, 371
Advances in Colloid and Interface Science 169 (2011), 1-12. 372
2. J. Letey, Adsorption and desorption of polymers on soil, Soil Science 158 (1994), 244-373
248. 374
3. R. E. Terry, S. D. Nelson, Effects of polyacrylamide and irrigation method on soil physical 375
properties, Soil Science 141 (1986), 317-320. 376
4. R. E. Sojka, D. L. Bjorneberg, J. A. Entry, R. D. Lentz, W. J. Orts, D. L. Sparks, in: Advances in 377
Agronomy, Academic Press: 2007; Vol. 92, pp 75-162. 378
5. H. Bessaies-Bey, R. Baumann, M. Schmitz, M. Radler, N. Roussel, Effect of polyacrylamide 379
on rheology of fresh cement pastes, Cement and Concrete Research 76 (2015), 98-106. 380
14
6. C. Negro, A. Blanco, E. Fuente, L. M. Sanchez, J. Tijero, Influence of flocculant molecular 381
weight and anionic charge on flocculation behaviour and on the manufacture of fibre cement 382
composites by the Hatschek process, Cement and Concrete Research 35 (2005), 2095-2103. 383
7. C. Negro, L. M. Sanchez, E. Fuente, A. Blanco, J. Tijero, Polyacrylamide induced 384
flocculation of a cement suspension, Chemical Engineering Science 61 (2006), 2522-2532. 385
8. D. A. Z. Wever, F. Picchioni, A. A. Broekhuis, Polymers for enhanced oil recovery: A 386
paradigm for structure-property relationship in aqueous solution, Progress in Polymer Science 387
36 (2011), 1558-1628. 388
9. H. Bessaies-Bey, J. Fusier, S. Harrisson, M. Destarac, S. Jouenne, N. Passade-Boupat, F. 389
Lequeux, J. B. d'Espinose de Lacaillerie, N. Sanson, Impact of polyacrylamide adsorption on flow 390
through porous siliceous materials: State of the art, discussion and industrial concern, Journal of 391
colloid and interface science 531 (2018), 693-704. 392
10. J. Blaakmeer, M. R. Bohmer, M. A. C. Stuart, G. J. Fleer, Adsorption of weak 393
polyelectrolytes on highly charged surfaces. Poly(acrylic acid) on polystyrene latex with strong 394
cationic groups, Macromolecules 23 (1990), 2301-2309. 395
11. R. E. Felter, Polymer adsorption studies at the solid/liquid interface using gel permeation 396
chromatography. II. Influence of molecular weight on the adsorption of poly(vinyl chloride) from 397
chlorobenzene onto calcium carbonate, Journal of Polymer Science Part C: Polymer Symposia 34 398
(1971), 227-241. 399
12. Z. Fu, M. M. Santore, Kinetics of Competitive Adsorption of PEO Chains with Different 400
Molecular Weights, Macromolecules 31 (1998), 7014-7022. 401
13. G. J. Howard, S. J. Woods, Adsorption of polymers at the solution-solid interface. VIII. 402
Competitive effects in the adsorption of polystyrenes on silica, Journal of Polymer Science Part 403
A-2: Polymer Physics 10 (1972), 1023-1028. 404
14. C. V. Linden, R. V. Leemput, Adsorption studies of polystyrene on silica I. Polydisperse 405
adsorbate, Journal of colloid and interface science 67 (1978), 63-69. 406
15. G. P. Van der Beek, M. A. C. Stuart, G. J. Fleer, J. E. Hofman, Segmental adsorption energies 407
for polymers on silica and alumina, Macromolecules 24 (1991), 6600-6611. 408
16. R. Ramachandran, P. Somasundaran, Competitive adsorption of polyelectrolytes: A size 409
exclusion chromatographic study, Journal of colloid and interface science 120 (1987), 184-188. 410
17. D. R. Bain, M. C. Cafe, I. D. Robb, P. A. Williams, The fractionation of polyelectrolytes by 411
adsorption onto ionic crystals, Journal of colloid and interface science 88 (1982), 467-470. 412
18. M. A. C. Stuart, J. M. H. M. Scheutjens, G. J. Fleer, Polydispersity effects and the 413
interpretation of polymer adsorption isotherms, Journal of Polymer Science: Polymer Physics 414
Edition 18 (1980), 559-573. 415
15
19. E. Pefferkorn, Structure and stability of natural organic matter/soil complexes and 416
related synthetic and mixed analogues, Advances in colloid and interface science 73 (1997), 127-417
200. 418
20. E. Read, A. Guinaudeau, D. J. Wilson, A. Cadix, F. Violleau, M. Destarac, Low temperature 419
RAFT/MADIX gel polymerisation: access to controlled ultra-high molar mass polyacrylamides, 420
Polymer Chemistry 5 (2014), 2202-2207. 421
21. M. J. Monteiro, Fitting molecular weight distributions using a log-normal distribution 422
model, European Polymer Journal 65 (2015), 197-201. 423
22. D. Babayan, C. Chassenieux, F. o. Lafuma, L. Ventelon, J. Hernandez, Formation of Rodlike 424
Silica Aggregates Directed by Adsorbed Thermoresponsive Polymer Chains, Langmuir 26 425
(2010), 2279-2287. 426
23. C. Flood, T. Cosgrove, I. Howell, P. Revell, Effects of electrolytes on adsorbed polymer 427
layers: Poly(ethylene oxide)-silica system, Langmuir 22 (2006), 6923-6930. 428
24. O. Griot, J. A. Kitchener, Ageing of Silica Suspensions in Water and its Influence on 429
Flocculation by Polyacrylamide, Nature 200 (1963), 1004-1005. 430
25. M. Kawaguchi, K. Maeda, T. Kato, A. Takahashi, Preferential adsorption of monodisperse 431
polystyrene on silica surface, Macromolecules 17 (1984), 1666-1671. 432
26. M. Kawaguchi, Y. Sakata, S. Anada, T. Kato, A. Takahashi, Kinetics of competitive 433
adsorption of polystyrene chains at a porous silica surface, Langmuir 10 (1994), 538-541. 434
27. M. Kawaguchi, S. Hattori, A. Takahashi, Ellipsometric study of competitive and 435
displacement adsorption of polymers at the .THETA. condition, Macromolecules 20 (1987), 178-436
180. 437
28. Z. Fu, M. M. Santore, Competitive Adsorption of Poly(ethylene oxide) Chains with and 438
without Charged End Groups, Langmuir 14 (1998), 4300-4307. 439
29. M. Santore, Z. Fu, Direct Measurement of Molecular-Weight Driven Competition during 440
Polymer Adsorption, Macromolecules 30 (1997), 8516-8517. 441
30. J. C. Dijt, M. A. Cohen Stuart, G. J. Fleer, Surface Exchange Kinetics of Chemically Different 442
Polymers, Macromolecules 27 (1994), 3229-3237. 443
31. G. J. Fleer, M. A. Cohen Stuart, J. M. H. M. Scheutjens, T. Cosgrove, B. Vincent, Polymers at 444
interfaces. Springer Netherlands: London, 1998. 445
32. R. R. Netz, D. Andelman, Neutral and charged polymers at interfaces, Physics Reports 380 446
(2003), 1-95. 447
33. E. Pefferkorn, Polyacrylamide at solid/liquid interfaces, Journal of colloid and interface 448
science 216 (1999), 197-220. 449
450 451