Within Host Evolution Results in Antigenically Distinct GII.4 Noroviruses 1
Kari Debbinka, Lisa C. Lindesmithb,Martin T. Ferrisc, Jesica Swanstomb, Martina 2
Beltramellod, Davide Cortid,e, Antonio Lanzavecchiad,f, and Ralph S. Barica,b# 3
4
Department of Microbiology and Immunology, University of North Carolina, 5
Chapel Hill, NC, USAa; Department of Epidemiology, University of North 6
Carolina, Chapel Hill, NC, USAb; Department of Genetics, University of North 7
Carolina, Chapel Hill, NC, USAc; Institute for Research in Biomedicine, 8
Bellinzona, Switzerlandd; Humabs Biomed SA, Bellinzona, Switzerlande; Institute 9
of Microbiology, ETH Zurich, Zurich, Switzerlandf 10
11
Running Head: Norovirus Within Host Evolution 12
#Address correspondence to Ralph Baric, [email protected] 13
14 15
Abstract word count: 193 16
Text word count: 5,663 17
18
JVI Accepts, published online ahead of print on 19 March 2014 J. Virol. doi:10.1128/JVI.00203-14
Abstract 19
GII.4 noroviruses are known to rapidly evolve, with the emergence of a new 20
primary strain every 2-4 years as herd immunity to the previously-circulating 21
strain is overcome. Because viral genetic diversity is higher in chronic as 22
compared to acute infection, chronically-infected immunocompromised people 23
have been hypothesized as a potential source for new epidemic GII.4 strains. 24
However, while some capsid protein residues are under positive selection and 25
undergo patterned changes in sequence variation over time, the relationships 26
between genetic variation and antigenic variation remains unknown. Based on 27
previously-published GII.4 strains from a chronically-infected individual, we 28
synthetically reconstructed VLPs representing an early and late isolates from a 29
small bowel transplant patient chronically infected with norovirus, as well as the 30
parental GII.4-2006b strain. We demonstrate that intra-host GII.4 evolution 31
results in the emergence of antigenically distinct strains over time, comparable to 32
the variation noted between chronologically predominant GII.4 strains GII.4-33
2006b and GII.4-2009. Our data suggest that in some individuals the evolution 34
that occurs during a chronic norovirus infection overlaps with changing antigenic 35
epitopes that are associated with successive outbreak strains and may select for 36
isolates that are potentially able to escape herd immunity from earlier isolates. 37
Importance 38
Noroviruses are agents of gastrointestinal illness, infecting an estimated 21 39
million people per year in the United States alone. In healthy individuals, 40
symptomatic infection typically resolves within 24-48 hours. However, symptoms 41
may persist years in immunocompromised individuals, and development of 42
successful treatments for these patients is a continued challenge. This work is 43
relevant to the design of successful norovirus therapeutics for chronically infected 44
patients, provides support for previous assertions that chronically infected 45
individuals may serve as reservoirs for new, antigenically unique emergent 46
strains, and furthers our understanding of GII.4 norovirus immune-driven 47
molecular evolution. 48
Introduction 50
Noroviruses are the leading cause of gastrointestinal illness worldwide. 51
While typically an acute disease, norovirus infections can be serious in the 52
young, old, and immunocompromised, as these groups are at risk for more 53
severe disease and death (1-3). Norovirus is spread rapidly in environments 54
where people are found in close proximity including schools and daycares, 55
nursing homes, cruise ships, and hospitals. Importantly, hospital outbreaks can 56
result in significant economic damage, with direct and indirect costs from a single 57
outbreak reaching $650,000 (4). 58
Noroviruses are members of the Caliciviridae family and contain a ~7.5 kb 59
single stranded, positive polarity RNA genome. They are divided into 5 60
genogroups; genogroups I and II are responsible for the majority of human 61
disease and are further subdivided into at least 9 and 22 genotypes, respectively 62
(5). The human norovirus genome encodes three open reading frames: the non-63
structural proteins, the ORF2 major capsid protein (VP1), and the ORF3 minor 64
capsid protein (VP2) (6). VP1 is further divided into the shell (S) and protruding 65
(P) domains, with the P domain is comprised of the P1 and P2 subdomains (6). 66
Phylogenetic studies indicate that the P2 subdomain is the most variable region 67
of the norovirus genome (7, 8). The P2 subdomain is also the most surface 68
exposed region of the norovirus capsid, interacting with antibodies and 69
histoblood group antigens, which serve as binding ligands and putative receptors 70
for human norovirus docking and entry. 71
GII.4 strains cause over 70% of all norovirus outbreaks (9) and epidemic 72
outbreaks occur every 2-4 years involving a new antigenically distinct strain (7, 73
10). Studies of antigenic variation in GII.4 norovirus have shown that the P2 74
region is involved in strain specific antibody recognition (7, 11, 12), and contains 75
at least three blockade (potential neutralization) epitopes (13-15). In epidemic 76
strains, genetic variation in P2 is linked to antigenic changes over time, indicating 77
that molecular evolution in the P2 subdomain is likely driven by escape from 78
human herd immunity (12-17). 79
Noroviruses typically cause acute infection in healthy individuals, resulting 80
in symptomatic infection for 24-48 hours followed by viral shedding for two to four 81
weeks (18, 19). However, some immunocompromised individuals such as 82
transplant patients on immunosuppressive drugs, those with primary 83
immunodeficiencies, cancer patients undergoing chemotherapy, and those with 84
HIV may develop chronic norovirus infection. Symptomatic infection and viral 85
shedding in these patients can persist from weeks to years (20-25) and can 86
result in medical issues such as dehydration and nutrient deficiencies (26), 87
making development of treatment options for these patients an important priority. 88
Unfortunately, there are no approved therapeutics or vaccines for controlling 89
norovirus infections. Attempted methods to control chronic infection have 90
included treatment with drugs effective against other diarrheal diseases (27), 91
adjustment of immunosuppressive drug type or dosage (28), and oral or enteral 92
administration of human IgG (29-32). Although reduction in immunosuppression 93
coupled with IgG administration has shown promise for some transplant patients, 94
IgG therapy has failed in other studies, and reduction of immunosuppression is 95
not always possible. 96
Existing studies provide a basis to investigate important questions about 97
chronic norovirus infection. Although unconfirmed, one recent hypothesis is that 98
chronically infected norovirus patients may be important sources of infection both 99
in healthcare settings (33) and as potential reservoirs for new emergent GII.4 100
norovirus strains (20, 23, 25). Although the fitness and the infectivity of 101
chronically shed virus is currently unknown, potential accounts of chronic 102
norovirus shedders involved in hospital outbreaks and transmission of virus to 103
both immunocompromised and immunocompetent individuals have been 104
documented (21, 33, 34). 105
Virus capsid sequence and phylogenetic data from chronically infected 106
patients have found substantial genetic variation over the course of infection in 107
many, but not all, patients (22, 23, 35). Siebenga et al. found that capsid 108
mutation rate was linked to immune impairment, suggesting that immune-driven 109
selection drives evolution in the capsid during chronic infection (35), and explains 110
differences in evolution depending on level of immunosuppression. Additional 111
studies have corroborated a role for intra-host immune driven selection by 112
demonstrating that virus isolated from chronically-infected patients undergoes 113
positive selection and exhibits higher genetic diversity in the capsid protein than 114
virus from acutely infected individuals (23, 25). In some chronically infected 115
patients with GII.4 strain infections, many of the changes occur in blockade 116
epitopes, areas of known or predicted antigenic importance but antigenic 117
comparisons have not been performed (13-15, 22, 35). 118
In this manuscript, we compare and contrast the antigenic differences 119
using a panel of polyclonal and monoclonal antibodies and time-ordered VLPs 120
derived from early (day 1—P.D1) and late (day 302—P.D302) capsid protein 121
amino acid sequences from a chronically infected immunocompromised patient 122
(23). Our data demonstrate significant antigenic differences between intra-host 123
variants that mirrors the degree of variation seen in major successive norovirus 124
strains, suggesting that chronic norovirus infections can evolve antigenically 125
unique variants with the potential to seed future norovirus outbreaks. 126
Methods 128
Sequences and Structural Homology Models 129
GenBank (NCBI sequence database) sequences used in this study were 130
JQ478409.1 (GII.4-2006b) (15), JQ417309 (P_04.2009 or P.D1) (23), JQ417327 131
(P_02.2010 or P.D302) (23), JN595867.1 (GII.4-2009) (15), and JX459908.1 132
(GII.4-2012) (36), and the VA387 crystal structure is available from the RCSB 133
Protein Data Bank: identifier 2OBT (37). We refer to originally-named P_04.2009 134
as P.D1 and P_02.2010 as P.D302 for simplicity throughout the manuscript. 135
Homology models of these sequences were constructed using Modeller (Max-136
Planck Institutue for Developmental Biology) and modeled in PyMOL. 137
138
Production of VRPs. Virus replicon particles (VRPs) encoding the norovirus 139
major capsid gene were produced as previously described (38). Briefly, 140
expression vector pVR21 encodes the VEE genome with the VEE structural 141
genes replaced with a commercially synthesized norovirus ORF2 gene 142
(BioBasic) behind the 26S promoter. The VEE-norovirus ORF2 construct and two 143
separate plasmids expressing either the VEE 3526 E1 and E2 glycoproteins or 144
VEE 3526 capsid protein were used to make RNA. RNA from all three constructs 145
was electroporated into BHK cells, and 48 hours later VRPs were harvested and 146
purified by high speed centrifugation. VRP titers were determined by counting 147
fluorescent cells detected with FITC-labeled antibody. VLP production from VRPs 148
and structural integrity was confirmed by EM. 149
Production of VLPs. VLPs were produced as previously described (13, 15). 151
Briefly, commercially synthesized norovirus ORF2 (BioBasic) from chronically 152
infected patient sequence or outbreak strain sequence was cloned into 153
expression vector pVR21 behind the 26S promotor, and genome length RNAs 154
were synthesized in vitro using T7 RNA polymerase. RNA from the VEE-ORF2 155
construct and helper RNAs was electroporated into BHK cells, and 24 hours later 156
VLPs were harvested and purified by high speed centrifugation. VLP 157
concentration was determined by BCA Protein Assay (Pierce), and structural 158
integrity was confirmed for all VLPs by EM. 159
160
HBGA Binding Assay. HBGA assays were performed as previously described 161
(7). Briefly, Avidin coated plates (Pierce) were coated with 10 ug/mL synthetic 162
biotinylated HBGAs (GlycoTech), followed by addition of 2 ug/mL VLPs. HBGA 163
binding was detected by strain specific mouse polyclonal sera followed by anti-164
mouse IgG-HRP (GE Healthcare) and then One-Step Ultra TMB HRP substrate. 165
Positive reactivity for each HBGA is defined as an OD 450 nm signal above or 166
equal to 3X the background binding (background range 0.049-0.066) after 167
background subtraction. 168
169
EIAs. Reactivity with mouse and human mAbs was determined by enzyme-linked 170
immunoassay (EIA). Plates were coated with 0.5 μg/ml VLP in PBS, and then 171
two-fold serial dilutions of mAb starting at 1 μg/ml mAb were added. Anti-mouse 172
or human IgG-HRP (GE Healthcare) followed by One-Step Ultra TMB EIA HRP 173
substrate solution was used for detection. Positive reactivity is defined as a mean 174
OD 450 nm >0.2 after background subtraction. Data represent the combination of 175
three independent trials with each VLP run in duplicate in each trial. Sigmoidal 176
dose response analysis was performed as previously described (14) using the 177
reactivity at 1 ug/ml as 100% binding. EC50 values among VLPs were compared 178
using One-way ANOVA with Dunnett’s post test. P<0.05 was considered 179
significant. VLPs with maximum reactivity below mean OD 450 nm 0.2 were 180
assigned a value of zero for graphical representations. 181
182
VLP-Carbohydrate Ligand-Binding Antibody Blockade Assays. 183
Blockade assays using Pig Gastric Mucin Type III (Sigma Chemicals) were 184
performed as previously described (14). PGM-bound VLPs were detected by 185
rabbit anti-GII.4 norovirus polyclonal sera. The percent control binding was 186
defined as the VLP-ligand binding level in the presence of test antibody or sera 187
compared to the binding level in the absence of antibody multiplied by 100. All 188
mAbs and sera were tested for blockade potential at two-fold serial dilutions 189
ranging from 0.0039 to 2 μg/ml (mouse mAbs), 0.0039 to 16 μg/ml (human 190
mAbs), and 0.0098 to 5% (mouse sera). Data from blockade experiments using 191
monoclonal antibodies represent the combination of three independent trials with 192
each VLP run in duplicate in each trial. Data from blockade experiments using 193
polyclonal mouse sera represent the combination of two independent trials in 194
which sera from five individual mice were tested for each VLP. Sigmoidal dose 195
response analysis was performed as previously described, and EC50 values 196
among VLPs were compared using One-way ANOVA with Bonferroni post test. 197
P<0.05 was considered significant. Blockade assays utilize VLP concentrations 198
in the low nanomolar range; therefore, this assay does not discriminate between 199
antibodies with sub-nanomolar affinities. 200
201
Monoclonal antibodies and mouse polyclonal sera 202
Mouse (12) and human (14) monoclonal antibodies were isolated as previously 203
described. Balb/c mice (five per group) were immunized by footpad injection with 204
5 x 10⁴ VRPs expressing norovirus capsid gene (1987, 2002, GII.4-205
2006b, GII.4-2009, P.D1, or P.D302). Mice were boosted on day 21, euthanized 206
7 days post-boost, and sera were harvested. This study followed all institutional 207
guidelines for animal care and experimentation (IACUC guidelines). 208
209
Antigenic Cartography 210
We utilized multi-dimensional scaling (MDS) approaches as described and 211
implemented within the AntigenMap 3D software (39, 40). The EC50 blockade 212
titers of various sera against a panel of VLPs were normalized to maximum 213
blockade titer of each sera, as well as to the maximum overall blockade titer 214
across sera (Normalization method 1 in AntigenMap 3D). Normalized values 215
were used to calculate Euclidean distances, D, between each pair of VLPs. For 216
greater analytic, visualization, and graphical purposes, we then utilized 217
Matlab8.1’s (MathWorks Inc, Natick, MA) cmdscale function to determine the 218
XYZ coordinates such that the data can be displayed in 3 dimensions while 219
maintaining the underlying Euclidean distances directly calculated from the data. 220
We utilized R (www.r-project.org), with the package rgl for 3D visualization of 221
these data. We confirmed the output of our pipeline with that produced by 222
AntigenMap 3D. 223
Results 224
Comparison of sequence changes among chronic infection isolates GII.4-225
2006b. 226
Previous work has shown that changes identified in a few key surface 227
exposed epitopes correlate with shifts in GII.4 norovirus antigenicity (11, 13-15), 228
including residues in Epitope A (294, 296-298, 368, and 372) (13), Epitope D 229
(393-395) (14), and Epitope E (407, 412-413) (15). Changes in these residues 230
likely alter the ability of preexisting immunity to neutralize the virus, selecting for 231
the emergence of new epidemic strains. 232
To study the within-host antigenic evolution of noroviruses during a 233
chronic human infection, we aligned the sequence of the capsid P2 domains of 234
GII.4-2006b, P.D1, and P.D302 to examine sequential amino acid changes from 235
GII.4-2006b through P.D302 after at least 10 months of within-host evolution 236
(23). Note that day 1 and day 302 refer to the days of sample collection and not 237
from beginning of infection, as the time between the beginning of infection and 238
the collection of the day 1 sample is unknown. Between VP1 amino acid 239
positions 248-434, there are 9 differences between GII.4-2006b and P.D1. After 240
10 months, there were 15 additional differences between P.D1 and P.D302, and 241
20 differences between GII.4-2006b and P.D302 located between these amino 242
acid positions (Figure 1A). Similarly, there are 16 differences spanning this 243
domain between GII.4-2006b and subsequent epidemic strains, GII.4-2009 and 244
GII.4-2012. Two of the differences between GII.4-2006b and P.D1 (S368A and 245
S393G) and four of the differences between GII.4-2006b and P.D302 (A294G, 246
S296T, S368A, and N412D) are located within blockade epitope sites (Figure 247
1B). Four differences in blockade epitope residues also exist between P.D1 and 248
P.D302 (A294G, S296T, G393S, N412D) (Figure 1B). We synthesized GII.4-249
2006b, P.D1, and P.D302 genes, expressed VLPs representing these strains, 250
and measured differences in antigenicity and HBGA binding among the chronic 251
infection isolates and GII.4-2006b using biological assays. In addition, several 252
amino acid substitutions present in the chronic infection strains that are 253
conserved in past epidemic strains may also influence the antigenic and HBGA 254
binding characteristics of epitope sites A (292, 295, 373), D (391), and E (414) 255
(Figure 1B) based on their position relative to these epitopes in GII.4 homology 256
models (Figure 1C). 257
Comparison of HBGA binding in chronic infection isolates to GII.4-2006b. 258
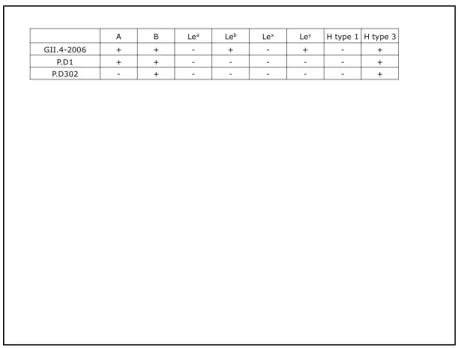
To evaluate differences in HBGA binding preferences among GII.4-2006b, 259
P.D1, and P.D302, we measured VLP binding to synthetic biotinylated 260
carbohydrates (A, B, Lea, Leb, Lex, Ley, H type 1, and H type 3). As previously 261
reported, GII.4-2006b bound A, B, Leb, Ley, and H type 3 (41). In contrast, 262
chronic infection strain VLPs exhibited differential HBGA binding profiles 263
compared to GII.4-2006b and to each other (Table 1). P.D1 was able to bind A, 264
B, and H type 3, while P.D302 bound only B and H type 3 synthetic biotinylated 265
HBGAs. This indicates that HBGA binding preferences may be altered over time 266
during chronic infection, perhaps influenced by individual within host HBGA 267
expression phenotypes. 268
Reactivity with GII.4 Mouse and Human mAbs 270
To measure antigenic differences among VLPs representing GII.4-2006b 271
and chronic strains P.D1 and P.D302, we performed enzyme-linked 272
immunoassays (EIAs) using mouse and human mAbs. We tested five GII.4-273
2006b mouse mAbs (G2, G3, G4, G6, G7) and two GII.4 human mAbs (NVB111, 274
NVB43.9), all of which target epitope site A residues (294, 296-298, 368, and 275
372), for EIA binding with GII.4-2006b, P.D1, and P.D302 VLPs. GII.4-2006b and 276
P.D1 differ in one epitope site A position, where P.D1 contains S368A compared 277
to GII.4-2006b. P.D302 is different from GII.4-2006b at 3/6 epitope site A 278
residues: A294G, S296T, and S368A, while P.D1 and P.D302 are different at 2/6 279
epitope site A residues: A294G and S296T. We also tested reactivity of these 280
VLPs with one human mAb (NVB97), which targets epitope site D residues (393-281
395). While GII.4-2006b and P.D302 share identical epitope site D residues, 282
P.D1 has an S393G change compared to GII.4-2006b. We additionally tested 283
one human mAb (NVB71.4) that targets an unmapped conserved GII.4 epitope 284
(14). Consistent with previously-reported results, all mAbs reacted strongly with 285
GII.4-2006b VLPs (12, 14) (Table 2). In contrast, EC50 values for P.D1 VLPs 286
were significantly different (P<0.05) from GII.4-2006b VLPs for mouse mAbs G2, 287
G4, G6, and human mAbs NVB43.9, and NVB111 (Table 2). Moreover, EC50 288
values for P.D302 VLPs were significantly different from GII.4-2006b for all mAbs 289
except NVB71.4, and different from P.D1 VLPs for all but NVB71.4 and NVB111 290
(Table 2). This indicates that epitope sites A and D are antigenically distinct 291
among GII.4-2006b, P.D1, and P.D302, demonstrating antigenic variation over 292
the course of chronic infection in important blockade epitopes. 293
294
Blockade Activity for GII.4 Mouse and Human mAbs 295
Compared to EIA, neutralization is a more relevant measure of functional 296
antigenic change. To test potential neutralization activity of mAbs (GII.4-2006b-297
G2, G3, G4, G6, and G7, and NVB43.9, NVB71.4, NVB97, NVB111) against 298
GII.4-2006b, P.D1, and P.D302 VLPs, we performed blockade assays, a 299
correlate of protective immunity (42) and a neutralization surrogate. Consistent 300
with previous findings, all mAbs were able to block ligand-VLP interactions for 301
GII.4-2006b (12, 14) (Figure 2). Likewise, P.D1 was blocked by all mAbs (Figure 302
2). However, EC50 blockade titers for two out of five GII.4-2006b mouse mAbs, 303
G2 (Figure 2A) and G7 (Figure 2E), and two of four GII.4 human mAbs, NVB111 304
(Figure 2G) and NVB71.4 (Figure 2I), were significantly different, requiring 7.1X, 305
2X, 2X, 3.2X more antibody, respectively, for blockade compared to GII.4-2006b 306
VLPs. P.D302 VLP-ligand binding was blocked by GII.4-2006b mouse mAbs G2 307
(Figure 2A), G6 (Figure 2D), G7 (Figure 2E), but not by G3 (Figure 2B) or G4 308
(Figure 2C), and blocked by GII.4 human mAb NVB71.4 (Figures 2I), but not by 309
NVB43.9 (Figure 2F), NVB111 (Figure 2G), or NVB97 (Figures 2H). EC50 310
blockade titers were significantly different between GII.4-2006b and P.D302 for 311
G2, G6, G7, and NVB71.4, requiring 12.6X, 15.9X, 12X, and 6.8X more mAb 312
compared to GII.4-2006b, respectively. Overall, EC50 blockade titers were 313
significantly higher for P.D302 compared to both GII.4-2006 and P.D1 for all 314
tested mAbs, demonstrating major antigenic changes in epitope sites A and D 315
over the course of chronic norovirus infection. 316
317
Blockade Response of Strain Specific Mouse Polyclonal Sera 318
While monoclonal antibodies are informative of the changes in a single 319
epitope, polyclonal sera are needed to evaluate global antigenic changes. To 320
measure differences in the total antibody response, we immunized mice with 321
virus replicon particles (VRPs) expressing the capsid gene from GII.4-2006b, 322
P.D1, and P.D302 or 2009, the consecutive outbreak strain following GII.4-323
2006, and measured the induced serum blockade responses (Figure 3). Mice 324
immunized with GII.4-2006b VRPs mounted a robust blockade response against 325
homotypic GII.4-2006b VLPs, while significantly more sera was needed to block 326
GII.4-2009, P.D1, and P.D302 VLPs (16X, 9.4X, and 12.7X, respectively) (Figure 327
3A). Sera from mice immunized with GII.4-2009 VRPs induced a strong 328
blockade response against GII.4-2009 VLPs; however, significantly more sera 329
was needed to block GII.4-2006b and P.D302 VLPs, with 39X more sera needed 330
to block P.D302 VLPs compared to GII.4-2009 (Figure 3B). Sera from mice 331
immunized with P.D1 VRPs most efficiently blocked homotypic P.D1 VLPs. EC50 332
values indicated that more sera is required to block GII.4-2009 (3X) and P.D302 333
(25.8X) than P.D1, while GII.4-2006b and P.D1 EC50 titers were not significantly 334
different (Figure 3C). Sera from mice immunized with P.D302 VRPs efficiently 335
blocked P.D302 VLP-ligand interactions and weakly blocked GII.4-2006b and 336
P.D1, requiring 92X and 61X more sera, respectively. P.D302 sera was unable 337
to block GII.4-2009 VLPs (Figure 3D). This data shows that chronic isolate VLPs 338
induce antibody responses that are different from the parental strain and each 339
other, demonstrating major changes in total antibody response over the course of 340 chronic infection. 341 342 Antigenic Cartography 343
In order to further describe and visualize the differences between virus 344
strains in their antigenic properties, we utilized the multi-dimensional scaling 345
(MDS) approach known as antigenic cartography (39,40). Specifically, we used 346
the pipeline described in AntigenMap 3D (39) to measure and visualize the 347
antigenic relationships among outbreak strains 1987, 1997, GII.4-348
2002, GII.4-2006b, GII.4-2009, and GII.4-2012 as well as chronic isolates P.D1 349
and P.D302, explicitly contrasting antigenic relationships between naturally 350
occurring epidemic strains as well as intra-host variants. The antigenic distances 351
between strains were measured using GII.4-1987, GII.4-2002, GII.4-2006b, 352
GII.4-2009, P.D1, and P.D302 mouse sera EC50 blocking titers against VLPs 353
representative of the specified GII.4 strains, and Euclidean distance values were 354
calculated based on these titers (Figure 4A). Consistent with earlier findings (12), 355
early (1987, 1997, 2002) and late strains (2006b, GII.4-356
2009, GII.4-2012) formed distinct clusters (Figure 4B-C). Not surprisingly, the 357
early within host variant, P.D1, grouped closely with late strains (Figure 4B-C), 358
reflecting its origins from the GII.4-2006b lineage. In contrast, P.D302 did not 359
group with any other strain and was antigenically distant from both the early and 360
contemporary isolates. In order to confirm the visual analysis of these antigenic 361
similarities, we compared Euclidean distances, D, between each pair of VLPs 362
across all serum utilized for antigenic cartography (the Euclidean distance 363
measures the straight-line distance between two points in a multidimensional 364
space). We first examined the groupings of early and late GII.4 outbreak strains. 365
The average distance within a group was 3.79 (range 2.11-6.39) while the 366
average distance between early and contemporary clusters was 10.7 (range 367
8.49-13.32), with each distance unit corresponding to a roughly 1.25-fold 368
difference in blockade response between viruses (Figure 4A). As shown in 369
Figures 4B and 4C, P.D1 grouped closely with late outbreak strain VLPs, with an 370
average D of 3.46 (range 2.26-5.09) (Figure 4A). In contrast, P.D302 was quite 371
distinct from both early and late outbreak strain viruses, as well as from P.D1, 372
with an average D of 9.92 (range 8.73-11.62) (Figure 4A). During an ~10 month 373
chronic infection in this individual, our data demonstrate that intra-host evolution 374
can generate novel variants with unique HBGA binding patterns and encode 375
unique antigenic differences that are as dramatically distinct as time-ordered, 376
epidemic outbreak strains that emerge in human populations. 377
378
Expansion of Epitope Site A 379
We next determined whether novel sites of within host evolution can refine 380
existing epitope maps and identify potential immunogenic changes in epidemic 381
strains of the future. Amino acid position 373 exhibited a N373H change between 382
P.D1 and P.D302 but was conserved in major GII.4 epidemic strains up until a 383
N373R substitution emerged in GII.4-2012 Sydney. Although not supported with 384
empirical data, recent work by Allen et al (43) suggests that this change in the 385
Sydney strain may have impacted its emergence. Since changes to 373 have 386
never been shown to influence immunogenicity, and it is not included as a 387
diagnostic A epitope site residue, this potentially hampers new epidemic strain 388
identification. To determine whether position 373 contributes to antigenic 389
differences in epitope A, we used the blockade assay to test potential 390
neutralization of VLPs representing parental strains GII.4-2009 New Orleans, 391
2012 Sydney, and chimeric sequences 2012.09A, GII.4-392
2012.09A.R373N, and GII.4-2012.R373N (Figure 5) by epitope A targeting 393
human mAb 43.9. 2009 was efficiently blocked by mAb 43.9, while GII.4-394
2012 required significantly more (55.3X) mAb for blockade. Blockade response 395
was partially restored in chimeras GII.4-2012.09A and GII.4-2012.R373N, but 396
required 1.5X and 4.8X more mAb, respectively, for blockade compared to GII.4-397
2009. EC50 blockade titers were not statically different between GII.4-398
2012.09A.R373N and GII.4-2009 VLPs. Similar trends were seems using mouse 399
mAbs targeting epitope A residues (data not shown). 400
401
Discussion 402
Noroviruses are an important cause of gastroenteritis in 403
immunocompromised individuals (44, 45), who are at increased risk for severe 404
disease outcomes (1, 44). Recent vaccine trials utilizing a VLP-based vaccine 405
approach support the idea that efficacious vaccines can be generated that elicit 406
short term protection in some healthy individuals, but vaccines may not protect 407
immunocompromised populations, making development of therapeutics that 408
effectively treat or prevent norovirus infections a top health priority. 409
In immunocompetent people, norovirus infection results in acute disease 410
outcomes (46). In contrast, immunocompromised individuals can develop 411
symptomatic disease and high titer viral shedding up to years. Unfortunately, the 412
literature on specific chronically-infected norovirus patient populations is sparse, 413
and duration and severity of chronic norovirus infections is likely influenced by 414
several factors including underlying condition, drug treatment regime, degree of 415
immunosuppression, and the rate of within host virus evolution, making it difficult 416
to define the characteristics of a typical chronic norovirus case. From these 417
limited studies, it is difficult to discern whether there are characteristics of chronic 418
norovirus infection that are broadly applicable to all populations, characteristics 419
that are true to specific populations, or whether characteristics vary by each 420
individual case. Previous work has shown that during the course of chronic 421
infection, virus genetic diversity can expand quickly (22, 23, 25, 35); however, it 422
was previously unknown whether this genetic variation translated into antigenic 423
variation or the emergence of antigenically unique isolates that differ significantly 424
from contemporary epidemic strains. For the first time, our work clearly 425
demonstrates the potential for significant antigenic variation over the course of 426
chronic infection within an individual, which is important in terms of both 427
therapeutic treatment considerations and for studying the potential role for 428
chronic shedders as reservoirs for evolving new outbreak strains. 429
Since there is no known animal reservoir for human noroviruses (47), the 430
available data indicate that new GII.4 strains likely arise naturally within the 431
human population by epochal evolution, immune driven selection, and inter-host 432
transmission over time (12-14, 16, 17). The occurrence of frequent long-term 433
chronic infections in immunosuppressed patients also represents a possible 434
source of new GII.4 norovirus strains with epidemic potential (23, 25, 35), as 435
these patients may provide an appropriate environment for sustained immune-436
directed molecular evolution by targeting previously identified surface exposed 437
blockade epitopes for mutation driven escape. Evidence supporting this 438
hypothesis includes sequence data from chronically infected patients that 439
demonstrate the emergence of genetic changes in GII.4 blockade epitopes that 440
modulate inter-host antigenicity (22, 35). This diverse pool may contain variants 441
antigenically distinct from the predominant circulating strain, allowing emergence 442
of a new strain under the right conditions (25). However, host and environmental 443
factors coupled with the type and degree of immunosuppression may affect the 444
rate and complexity of intra-host evolution that occurs over time (23), and future 445
work that evaluates the role of different immunosuppressive conditions on intra-446
host norovirus evolution are needed. 447
Our work demonstrated intra-host antigenic changes within epitope site A 448
(amino acids 294, 296-298, 368, and 372). Interestingly, P.D302 contained 449
residue substitutions in amino acid positions 292, 295, and 373, which are 450
conserved in major GII.4 outbreak strains, except for 373, which was altered in 451
the most recent predominant strain, GII.4-2012 Sydney. Changes in these 452
residues likely impact epitope A antibody binding and blockade response either 453
by altering the conformational landscape of the epitope or directly inhibiting the 454
interaction of the antibody with the capsid. Using GII.4-2009/GII.4-2012 chimeric 455
VLPs, we demonstrated that residues at position 373 impact the blockade 456
response of human mAb NVB 43.9, an antibody that targets epitope A. This 457
demonstrates that 373 is part of epitope A, expanding this epitope to 7 positions. 458
Furthermore, we suggest that monitoring intra-host evolved strains may provide a 459
novel diagnostic strategy to map key residues capable of mediating antigenic 460
changes in future outbreaks. While positions 292 and 295 have been conserved 461
in previous predominantly-circulating GII.4 strains, their ability to change in this 462
patient and their proximity to known epitope A residues suggest that these 463
residues could potentially impact antigenic change in epitope A in future 464
epidemics, as residue 373 did in GII.4-2012 Sydney. 465
Reactivity and blockade response data for antibody NVB97 demonstrates 466
antigenic evolution in epitope site D during chronic infection. Epitope site D 467
minimally include residues 393-395, is in close proximity to the carbohydrate 468
binding pocket (37), and previous work demonstrates that modulation of residues 469
within this epitope modulate HBGA specificity (7). Evolution in this epitope site is 470
likely driven both by antibody selective pressure and pressure to maintain binding 471
to one or more HBGAs. Despite conservation of residues 393-395 between 472
GII.4-2006b and P.D302, antigenic phenotypes differ significantly, demonstrating 473
that NVB97 recognition is modulated by amino acid positions outside of the 474
previously-defined epitope site D residues. Position 391, which is close to the 475
carbohydrate binding pocket, is conserved in major outbreak strains and between 476
GII.4-2006b and P.D1, and previous work demonstrated that an alanine 477
substitution at this residue had little impact on HBGA binding (48). Neither the 478
antigenic consequences of residue changes nor the impact of other residue 479
substitutions on HBGA binding at this position have been rigorously evaluated, 480
meaning that the D391N change in P.D302 may contribute to both the HBGA 481
reactivity and antibody blockade differences observed for P.D302. To explore 482
this possibility, we created homology models of these P2 domains and compared 483
the predicted polar interactions present in residues 390-395 (Figure 6) among 484
GII.4-2006b, P.D1, and P.D302. 485
Conformational comparisons between GII.4-2006b and P.D1 show 486
general similarities in the shape created by residues 390-395, with exceptions 487
being the loss of a side chain in 393 of P.D1, and slight shifts in position for side 488
chains in residues 394 and 395 (Figure 6A and 6B). These conformational 489
changes appear to impact the polar interactions within these residues, as the 490
loss of the side chain in residue 393 ablates the hydrogen bond present in GII.4-491
2006b. In addition, the positional shifts in residues 394 and 395 in P.D1 appear 492
to prevent formation of another hydrogen bond present in GII.4-2006b. 493
Conformational comparisons between GII.4-2006b and P.D302 demonstrate that 494
the residue change at 391 has significant impact on the shape and hydrogen 495
bonding networks for residues 390-395 (Figures 6A and 6C). In P.D302, position 496
391 is bent downward, which differs from the position of this amino acid in GII.4-497
2006b and P.D1. The result of this change is the formation of a hydrogen bond 498
between the side chain and main chain of 391. In addition, though residue 393 is 499
conserved between GII.4-2006b and P.D302, the side chain is shifted downward 500
in P.D302 compared to GII.4-2006b, shifting the position of the hydrogen bond 501
found at this residue. The formation of two additional novel hydrogen bonds 502
between 390 & 393 and 390 & 395 suggests that the 391 residue change and 503
resulting conformational changes allowed for these increased polar interactions. 504
A slight conformational shift in residue 395 in P.D302 appears to ablate a polar 505
interaction found in GII.4-2006b at this position. We also compared polar 506
interactions of GII.4-2006, P.D1, and P.D302 to residues outside of 390-395 507
(Figure 6D-F). GII.4-2006b and P.D1 displayed five conserved polar interactions 508
to surrounding amino acids (Figures 6D and 6E), while P.D302 lost the polar 509
interaction at residue 391 and gained an additional bond at residue 394 (Figure 510
6F). 511
In addition to epitope site D being an antibody blockade epitope, these 512
residues modulate HBGA binding, so evolution in this region is likely driven both 513
by antibody selective pressure and pressure to maintain binding to one or more 514
HBGAs. Interestingly, all three structures maintained the two hydrogen bonds to 515
positions 443 and 444. Residue 443 is in the HBGA binding site (37), and 516
maintaining interaction with this residue may be selected for in this individual in 517
order to retain HBGA binding. The altered HBGA binding profile and reduced 518
NBV 97 binding and blockade for P.D302 may be explained by these polar 519
differences, although this cannot be confirmed without a crystal structure of these 520
P2 domains bound to NVB 97 and HBGAs. 521
Our demonstration of intra-host changes in HBGA binding profiles in a 522
chronically infected immunocompromised patient suggests that selection may 523
favor variants that bind patient-specific HBGAs. While speculative, the potential 524
emergence of intra-host variants that target patient-specific HBGA expression 525
profiles could select for the emergence of novel strains that recognize unique or 526
broad combinations of HBGA patterns, allowing for altered pathogenicity and 527
transmission efficiencies in an individual or across select human populations. We 528
could not evaluate this possibility in our study because the HBGA expression 529
profile of this chronically infected patient is unknown. Future research could 530
evaluate these HBGA phenotypic and FUT 2/3 genotypic relationships using 531
saliva and cells from chronically infected patients. 532
How much intra-host and inter-host antigenic variation is necessary to give 533
rise to a new strain that could escape herd immunity in the general population? 534
Using blockade EC50 data from mouse sera against GII.4-2006b, GII.4-2009 535
(representative of a successive outbreak strain), P.D1, and P.D302, we 536
demonstrate that the antigenic variation between P.D1 and P.D302 is 1.5X 537
greater than that seen between GII.4-2006b and GII.4-2009. To further address 538
this question, we used antigenic cartography, which provides easily interpretable 539
measures and visualization of multidimensional antigenic relationships, and has 540
previously been used to study antigenic differences in influenza strains (40, 49). 541
This analysis provided further support for the idea that within-host changes in the 542
virus can equal or exceed those differences seen across successive outbreak 543
strains, with the antigenic space between P.D302 and both GII.4-2006b (D=9.91) 544
and P.D1 (D=9.15) being greater than the average between the consecutive 545
outbreak strains used in this study (average D=4.98; range 2.11 to 12.11) and 546
mirrors the global difference between early GII.4 isolates (1987, 1997, 2002) and 547
contemporary strains (2006b, 2009, 2012). 548
Antigenic cartography is a relatively new, powerful method with which to 549
simply describe the multidimensional antigenic differences between virus strains. 550
As such, there is room for improvement within these methods. Indeed, more 551
complex statistical models underlying antigenic cartography approaches are 552
being developed to better account for uncertainty within these datasets (49), and 553
more comprehensive surveys of both antisera and natural GII.4 isolates over a 554
30-year time span will better allow for the characterization of antigenic change 555
within noroviruses. Within this study, the use of mouse sera permits us to use an 556
immunologically clean background with no pre-exposure history and provides a 557
clearer starting point to evaluate specific relationships among outbreak strains 558
and the intra-host isolates. Future work will require well defined, time-ordered 559
human sera during natural epidemic outbreaks, time-ordered sera during intra-560
host chronic infections, and synthetic reconstruction of capsids representing both 561
outbreak and unique panels of inter-host variants over time; unfortunately, to 562
date, we have been unable to obtain the samples necessary to pursue this 563
comprehensive investigation. Our data suggest that intra-host evolution over a 564
10-month period can yield sufficient antigenic change to escape existing herd 565
immunity. Clearly, additional work examining norovirus infectivity after prolonged 566
shedding is needed in order to clarify whether chronically infected patients are a 567
probable source of novel epidemic strains. 568
Therapeutics are needed to alleviate clinical disease during long-term 569
norovirus infection and prevent the potential emergence of novel antigenic 570
variants with epidemic potential in the general population. Some success using 571
IgG to treat chronic norovirus (32) coupled with our data demonstrating that P.D1 572
is relatively antigenically similar to GII.4-2006b, while P.D302 is antigenically 573
divergent, suggest that treating early during chronic infection may be important 574
for viral clearance and also supports the possibility that similarly-administered 575
broadly neutralizing antibodies may be viable treatment options for patients 576
suffering from long-term norovirus infection. Our work demonstrates that GII.4 577
broadly-neutralizing mAb NVB71.4 retains blockade response against P.D1 and 578
P.D302, even though both these strains are antigenically distinct from GII.4-579
2006b, GII.4-2009, and presumably other major GII.4 strains. This suggests that 580
NVB71.4 or other antibodies with broad cross-blockade activity could be isolated 581
and successfully used as norovirus therapeutics. Importantly, different 582
monoclonal antibodies will be needed that target other GI and GII strain chronic 583
infections. Furthermore, increased surveillance of norovirus isolates from 584
chronically infected patients as well as deep sequencing of patient isolates 585
should be considered in order to better understand the transmission dynamics 586
and genetic potential of norovirus isolates from these patients since these are 587
likely different from what is seen in the general population. Overall, our work 588
supports the idea that chronically infected individuals are potential reservoirs for 589
antigenically novel norovirus strains, and further work to characterize their role in 590
transmission and emergent norovirus outbreaks and development of therapeutics 591
to combat chronic infections should receive a top priority. 592
593
Acknowledgements 594
This work was supported by grant AI056351 from the National Institutes of 595
Health, Allergy and Infectious Diseases and by institutional training grant T32-596
AI007419 from the National Institute of Health. The funders had no role in study 597
design, data collection and analysis, decision to publish, or preparation of the 598
manuscript. We thank Victoria Madden and C. Robert Bagnell, Jr., of the 599
Microscopy Services Laboratory, Department of Pathology and Laboratory 600
Medicine, University of North Carolina—Chapel Hill, for expert technical support. 601
We also acknowledge the UNC-CH Genome Analysis Facility. 602
603
Figure Legends 604
Figure 1: Sequence Changes in Chronically Infected Patient Strains 605
Compared to GII.4-2006b. 606
(A) Available capsid amino acid sequences for GII.4-2006b, P.D1 and P.D302 607
were aligned using Clustal Omega, and sequence differences among GII.4-2006, 608
P.D1, and P.D302 are shown. GII.4-2006b residues are shown in purple. P.D1 609
and P.D302 differences from GII.4-2006b are indicated in light blue, while orange 610
indicates a reversion to the GII.4-2006b residues. (B) Alignment of GII.4-2006b, 611
P.D1, and P.D302 amino acid sequences in and around Epitopes A, D, and E. 612
Green indicates a position within a defined epitope, while white indicates nearby 613
residues that may impact antigenicity in these epitopes. Yellow indicates an 614
amino acid position newly defined as part of epitope A. (C) Structural homology 615
models of GII.4-2006b, P.D1, and P.D302 capsid P2 dimers shown from top 616
view. Purple shows location of Epitopes A, D, and E on the capsid P2 dimer, 617
while green shows changing amino acid residues in P.D1 and P.D302 compared 618
to GII.4-2006b. 619
620
Table 1: Chronic Infection Strain HBGA Binding Preferences 621
VLPs representing GII.4-2006b, P.D1, and P.D302 were assayed for their ability 622
to bind synthetic biotinylated HBGAs A, B, Lea, Leb, Lex, Ley, H type 1, and H 623
type 3 by carbohydrate binding assay. Positive reactivity was defined as a value 624
greater or equal to 3X the background binding value. 625
626
Table 2: GII.4 Mouse and Human mAb EIA Reactivity with Chronic Infection 627
Strains 628
Mouse and human GII.4 monoclonal antibodies against were assayed for 629
reactivity with GII.4-2006b, P.D1, and P.D302 VLPs by multiple dilution EIA. The 630
mean percent binding (percent of the VLP bound to antibody in the dilution 631
course compared to the amount of VLP bound with antibody at 1 ug/mL) of each 632
VLP was fit with a sigmoidal curve, and the mean EC50 (μg/ml) EIA reactivity 633
titers for GII.4-2006b, P.D1, and P.D302 were calculated. * Mean EC50 EIA 634
reactivity titer for the test VLP is significantly different from the mean EC50 for 635
GII.4-2006b (light grey), or ** was significantly different from both GII.4-2006b 636
and P.D1 (p<0.05) (dark grey). Monoclonal antibodies that did not demonstrate 637
EIA reactivity at or above OD450 nm 0.2 at 1 ug/mL with a particular VLP are 638
denoted by an EC50 of >1 ug/mL. Statistics were calculated by One-way ANOVA 639
with Bonferroni post test. 640
641
Figure 2: GII.4 Mouse and Human mAb Blockade Response Against 642
Chronic Infection Strains 643
(A-I) Mouse and human GII.4 monoclonal antibodies were assayed for ability to 644
block GII.4-2006b, P.D1, and P.D302 VLP interaction with carbohydrate ligand. 645
The mean percent control binding (percent of the VLP bound to carbohydrate 646
ligand in the presence of an antibody compared to the amount of VLP bound with 647
no antibody present) of each VLP was fit with a sigmoidal curve, and the mean 648
EC50 (μg/ml) blockade titers for GII.4-2006b, P.D1, and P.D302 were calculated. 649
Error bars represent 95% confidence intervals. * Mean EC50 blockade titer for the 650
test VLP is significantly different from the mean EC50 for GII.4-2006b (p<0.05), or 651
** was significantly different from both GII.4-2006b and P.D1 (p<0.05). 652
Monoclonal antibodies that did not block a particular VLP were assigned an EC50 653
of 2X the upper limit of detection for statistical analysis and are shown on the 654
graph by data points above the upper limit of detection (dashed line). Statistics 655
were calculated by One-way ANOVA with Bonferroni post test. 656
657
Figure 3: Blockade Activity of Mouse Polyclonal Sera Against Homotypic 658
and Heterotypic VLPs 659
Mice were immunized with VRP expressing the capsid gene of GII.4-2006b, 660
GII.4-2009, P.D1, and P.D302, and sera collected from these mice were tested 661
for blockade activity against GII.4-2006b, GII.4-2009, P.D1, and P.D302 VLPs. 662
(A) Blockade activity of sera from mice immunized against 2006b (A), GII.4-663
2009 (B), P.D1 (C), and P.D302 (D) with homotypic and heterotypic VLPs. The 664
mean percent control binding (percent of the VLP bound to carbohydrate ligand 665
in the presence of sera compared to the amount of VLP bound with no sera 666
present) of each VLP was fit with a sigmoidal curve, and the mean EC50 (% sera) 667
blockade titers for GII.4-2006b, GII.4-2009, P.D1, and P.D302 were calculated. 668
Error bars represent 95% confidence intervals. * Mean EC50 blockade titer for the 669
test VLP is significantly different from the mean EC50 for the homotypic strain 670
(p<0.05). Sera that did not block a particular VLP were assigned an EC50 of 10% 671
sera for statistical analysis and are shown on the graph by data points above the 672
upper limit of detection (dashed line). Statistics were calculated by One-way 673
ANOVA with Bonferroni post test. 674
675
Figure 4: Antigenic Cartography for GII.4 Noroviruses 676
Multidimentional Scaling (MDS) was used to identify the antigenic relationships 677
between different norovirus strains. A) Euclidean antigenic distances between 678
virus strains were calculated based on the EC50 efficacy of antisera raised 679
against GII.4-1987, GII.4-2002, GII.4-2006b, GII.4-2009, P.D1 and P.D302 VLPs. 680
Green squares represent distances within either the early (1987, 1998 and 2002) 681
or late (2006, 2009 and 2012) virus groups. Purple squares show the distances 682
between early and late virus groups. (B-C) We determined XYZ-coordinates that 683
maintain the underlying Euclidean distances between viruses, while illustrating 684
the relationships between GII.4 norovirus strains, with each map-distance 685
roughly corresponding to a ~1.25-fold change in blockade response. B) Early 686
strains GII.4-1987 (yellow), GII.4-1997 (red), and GII.4-2002 (light blue) grouped 687
together (lower right hand group), and late strains GII.4-2006b (light purple), 688
GII.4-2009 (dark blue), and GII.4-2012 (dark purple) grouped together (lower left 689
hand group). P.D1 grouped with late strains, closest to GII.4-2006b, while 690
P.D302 was separate from either late or early strains (upper position). C) Side 691
view of the same 3D graph showing the antigenic differences between strains. 692
693
Figure 5: Expansion of Epitope Site A 694
Epitope A targeting human GII.4 mAb 43.9 was assayed for its ability to block 695
GII.4-2009 New Orleans, GII.4-2012 Sydney, GII.4-2012.09A, GII.4-2012.R373N, 696
and GII.4-2012.09A.R373N VLP interaction with carbohydrate ligand. The mean 697
percent control binding (percent of the VLP bound to carbohydrate ligand in the 698
presence of an antibody compared to the amount of VLP bound with no antibody 699
present) of each VLP was fit with a sigmoidal curve, and the mean EC50 (μg/ml) 700
blockade titers for all VLPs were calculated. Error bars represent 95% confidence 701
intervals. Statistics were calculated by One-way ANOVA with Dunnett’s post 702
test. * Mean EC50 blockade titer was significantly different from GII.4-2009. 703
704
Figure 6: Comparison of Epitope Site D Polar Interactions Among GII.4-705
2006 and Chronic Infection Strains 706
Pymol was used to model the polar interactions within residues 390-395 (A-C) 707
and interactions between these residues and surrounding residues (D-F). GII.4-708
2006b is shown in purple (A and D), P.D1 is shown in teal (B and E), and P.D302 709
is shown in pink (C and F). Residues 390-395 are shown in orange for GII.4-710
2006b, yellow for P.D1, and aqua for P.D302. Dotted lines represent structure-711
based predicted polar interactions. Dark purple residues represent positions that 712
interact with HBGAs (D-F). 713 714 References 715 716 717
1. Mattner F, Sohr D, Heim A, Gastmeier P, Vennema H, Koopmans M. 2006. Risk 718
groups for clinical complications of norovirus infections: an outbreak 719
investigation. Clin Microbiol Infect 12:69-74. 720
2. Murata T, Katsushima N, Mizuta K, Muraki Y, Hongo S, Matsuzaki Y. 2007. 721
Prolonged norovirus shedding in infants <or=6 months of age with 722
gastroenteritis. Pediatr Infect Dis J 26:46-49. 723
3. Okada M, Tanaka T, Oseto M, Takeda N, Shinozaki K. 2006. Genetic analysis of 724
noroviruses associated with fatalities in healthcare facilities. Arch Virol 725
151:1635-1641. 726
4. Johnston CP, Qiu H, Ticehurst JR, Dickson C, Rosenbaum P, Lawson P, Stokes 727
AB, Lowenstein CJ, Kaminsky M, Cosgrove SE, Green KY, Perl TM. 2007. 728
Outbreak management and implications of a nosocomial norovirus outbreak. 729
Clin Infect Dis 45:534-540. 730
5. Kroneman A, Vega E, Vennema H, Vinje J, White PA, Hansman G, Green K, 731
Martella V, Katayama K, Koopmans M. 2013. Proposal for a unified norovirus 732
nomenclature and genotyping. Arch Virol 158:2059-2068. 733
6. Prasad BV, Hardy ME, Dokland T, Bella J, Rossmann MG, Estes MK. 1999. X-734
ray crystallographic structure of the Norwalk virus capsid. Science 286:287-735
290. 736
7. Lindesmith LC, Donaldson EF, Lobue AD, Cannon JL, Zheng DP, Vinje J, Baric 737
RS. 2008. Mechanisms of GII.4 norovirus persistence in human populations. 738
PLoS Med 5:e31. 739
8. Donaldson EF, Lindesmith LC, Lobue AD, Baric RS. 2008. Norovirus 740
pathogenesis: mechanisms of persistence and immune evasion in human 741
populations. Immunol Rev 225:190-211. 742
9. Fankhauser RL, Monroe SS, Noel JS, Humphrey CD, Bresee JS, Parashar UD, 743
Ando T, Glass RI. 2002. Epidemiologic and molecular trends of "Norwalk-like 744
viruses" associated with outbreaks of gastroenteritis in the United States. J 745
Infect Dis 186:1-7. 746
10. Siebenga JJ, Vennema H, Renckens B, de Bruin E, van der Veer B, Siezen RJ, 747
Koopmans M. 2007. Epochal evolution of GGII.4 norovirus capsid proteins 748
from 1995 to 2006. J Virol 81:9932-9941. 749
11. Allen DJ, Noad R, Samuel D, Gray JJ, Roy P, Iturriza-Gomara M. 2009. 750
Characterisation of a GII-4 norovirus variant-specific surface-exposed site 751
involved in antibody binding. Virol J 6:150. 752
12. Lindesmith LC, Donaldson EF, Baric RS. 2011. Norovirus GII.4 strain 753
antigenic variation. J Virol 85:231-242. 754
13. Debbink K, Donaldson EF, Lindesmith LC, Baric RS. 2012. Genetic mapping of 755
a highly variable norovirus GII.4 blockade epitope: potential role in escape 756
from human herd immunity. J Virol 86:1214-1226. 757
14. Lindesmith LC, Beltramello M, Donaldson EF, Corti D, Swanstrom J, Debbink 758
K, Lanzavecchia A, Baric RS. 2012. Immunogenetic mechanisms driving 759
norovirus GII.4 antigenic variation. PLoS Pathog 8:e1002705. 760
15. Lindesmith LC, Debbink K, Swanstrom J, Vinje J, Costantini V, Baric RS, 761
Donaldson EF. 2012. Monoclonal antibody-based antigenic mapping of 762
norovirus GII.4-2002. J Virol 86:873-883. 763
16. Lindesmith LC, Costantini V, Swanstrom J, Debbink K, Donaldson EF, Vinje J, 764
Baric RS. 2013. Emergence of a norovirus GII.4 strain correlates with changes 765
in evolving blockade epitopes. J Virol 87:2803-2813. 766
17. Debbink K, Lindesmith LC, Donaldson EF, Costantini V, Beltramello M, Corti 767
D, Swanstrom J, Lanzavecchia A, Vinje J, Baric RS. 2013. Emergence of New 768
Pandemic GII.4 Sydney Norovirus Strain Correlates with Escape from Herd 769
Immunity. J Infect Dis. 770
18. Rockx B, De Wit M, Vennema H, Vinje J, De Bruin E, Van Duynhoven Y, 771
Koopmans M. 2002. Natural history of human calicivirus infection: a 772
prospective cohort study. Clin Infect Dis 35:246-253. 773
19. Obara M, Hasegawa S, Iwai M, Horimoto E, Nakamura K, Kurata T, Saito N, Oe 774
H, Takizawa T. 2008. Single base substitutions in the capsid region of the 775
norovirus genome during viral shedding in cases of infection in areas where 776
norovirus infection is endemic. J Clin Microbiol 46:3397-3403. 777
20. Siebenga J, Kroneman A, Vennema H, Duizer E, Koopmans M. 2008. Food-778
borne viruses in Europe network report: the norovirus GII.4 2006b (for US 779
named Minerva-like, for Japan Kobe034-like, for UK V6) variant now 780
dominant in early seasonal surveillance. Euro Surveill 13. 781
21. Nilsson M, Hedlund KO, Thorhagen M, Larson G, Johansen K, Ekspong A, 782
Svensson L. 2003. Evolution of human calicivirus RNA in vivo: accumulation 783
of mutations in the protruding P2 domain of the capsid leads to structural 784
changes and possibly a new phenotype. J Virol 77:13117-13124. 785
22. Schorn R, Hohne M, Meerbach A, Bossart W, Wuthrich RP, Schreier E, Muller 786
NJ, Fehr T. 2010. Chronic norovirus infection after kidney transplantation: 787
molecular evidence for immune-driven viral evolution. Clin Infect Dis 788
51:307-314. 789
23. Hoffmann D, Hutzenthaler M, Seebach J, Panning M, Umgelter A, Menzel H, 790
Protzer U, Metzler D. 2012. Norovirus GII.4 and GII.7 capsid sequences 791
undergo positive selection in chronically infected patients. Infect Genet Evol 792
12:461-466. 793
24. Ludwig A, Adams O, Laws HJ, Schroten H, Tenenbaum T. 2008. Quantitative 794
detection of norovirus excretion in pediatric patients with cancer and 795
prolonged gastroenteritis and shedding of norovirus. J Med Virol 80:1461-796
1467. 797
25. Bull RA, Eden JS, Luciani F, McElroy K, Rawlinson WD, White PA. 2012. 798
Contribution of intra- and interhost dynamics to norovirus evolution. J Virol 799
86:3219-3229. 800
26. Koo HL, DuPont HL. 2009. Noroviruses as a potential cause of protracted and 801
lethal disease in immunocompromised patients. Clin Infect Dis 49:1069-802
1071. 803
27. Capizzi T, Makari-Judson G, Steingart R, Mertens WC. 2011. Chronic diarrhea 804
associated with persistent norovirus excretion in patients with chronic 805
lymphocytic leukemia: report of two cases. BMC Infect Dis 11:131. 806
28. Boillat Blanco N, Kuonen R, Bellini C, Manuel O, Estrade C, Mazza-Stalder J, 807
Aubert JD, Sahli R, Meylan P. 2011. Chronic norovirus gastroenteritis in a 808
double hematopoietic stem cell and lung transplant recipient. Transpl Infect 809
Dis 13:213-215. 810
29. Florescu DF, Hill LA, McCartan MA, Grant W. 2008. Two cases of Norwalk 811
virus enteritis following small bowel transplantation treated with oral 812
human serum immunoglobulin. Pediatr Transplant 12:372-375. 813
30. Florescu DF, Hermsen ED, Kwon JY, Gumeel D, Grant WJ, Mercer DF, Kalil AC. 814
2011. Is there a role for oral human immunoglobulin in the treatment for 815
norovirus enteritis in immunocompromised patients? Pediatr Transplant 816
15:718-721. 817
31. Ebdrup L, Bottiger B, Molgaard H, Laursen AL. 2011. Devastating diarrhoea in 818
a heart-transplanted patient. J Clin Virol 50:263-265. 819
32. Chagla Z, Quirt J, Woodward K, Neary J, Rutherford C. 2013. Chronic 820
norovirus infection in a transplant patient successfully treated with enterally 821
administered immune globulin. J Clin Virol. 822
33. Sukhrie FH, Siebenga JJ, Beersma MF, Koopmans M. 2010. Chronic shedders 823
as reservoir for nosocomial transmission of norovirus. J Clin Microbiol 824
48:4303-4305. 825
34. Kaufman SS, Chatterjee NK, Fuschino ME, Morse DL, Morotti RA, Magid MS, 826
Gondolesi GE, Florman SS, Fishbein TM. 2005. Characteristics of human 827
calicivirus enteritis in intestinal transplant recipients. J Pediatr Gastroenterol 828
Nutr 40:328-333. 829
35. Siebenga JJ, Beersma MF, Vennema H, van Biezen P, Hartwig NJ, Koopmans M. 830
2008. High prevalence of prolonged norovirus shedding and illness among 831
hospitalized patients: a model for in vivo molecular evolution. J Infect Dis 832
198:994-1001. 833
36. Eden JS, Tanaka MM, Boni MF, Rawlinson WD, White PA. 2013. 834
Recombination within the pandemic norovirus GII.4 lineage. J Virol 87:6270-835
6282. 836
37. Cao S, Lou Z, Tan M, Chen Y, Liu Y, Zhang Z, Zhang XC, Jiang X, Li X, Rao Z. 837
2007. Structural basis for the recognition of blood group trisaccharides by 838
norovirus. J Virol 81:5949-5957. 839
38. Baric RS, Yount B, Lindesmith L, Harrington PR, Greene SR, Tseng FC, Davis 840
N, Johnston RE, Klapper DG, Moe CL. 2002. Expression and self-assembly of 841
norwalk virus capsid protein from venezuelan equine encephalitis virus 842
replicons. J Virol 76:3023-3030. 843
39. Barnett JL, Yang J, Cai Z, Zhang T, Wan XF. 2012. AntigenMap 3D: an online 844
antigenic cartography resource. Bioinformatics 28:1292-1293. 845
40. Cai Z, Zhang T, Wan XF. 2010. A computational framework for influenza 846
antigenic cartography. PLoS Comput Biol 6:e1000949. 847
41. Cannon JL, Lindesmith LC, Donaldson EF, Saxe L, Baric RS, Vinje J. 2009. Herd 848
immunity to GII.4 noroviruses is supported by outbreak patient sera. J Virol 849
83:5363-5374. 850
42. Reeck A, Kavanagh O, Estes MK, Opekun AR, Gilger MA, Graham DY, Atmar 851
RL. 2010. Serological correlate of protection against norovirus-induced 852
gastroenteritis. J Infect Dis 202:1212-1218. 853
43. Allen DJ, Adams NL, Aladin F, Harris JP, Brown DW. 2014. Emergence of the 854
GII-4 Norovirus Sydney2012 Strain in England, Winter 2012-2013. PLoS One 855
9:e88978. 856
44. Roddie C, Paul JP, Benjamin R, Gallimore CI, Xerry J, Gray JJ, Peggs KS, Morris 857
EC, Thomson KJ, Ward KN. 2009. Allogeneic hematopoietic stem cell 858
transplantation and norovirus gastroenteritis: a previously unrecognized 859
cause of morbidity. Clin Infect Dis 49:1061-1068. 860
45. Glass RI, Parashar UD, Estes MK. 2009. Norovirus gastroenteritis. N Engl J 861
Med 361:1776-1785. 862
46. Atmar RL, Opekun AR, Gilger MA, Estes MK, Crawford SE, Neill FH, Graham 863
DY. 2008. Norwalk virus shedding after experimental human infection. 864
Emerg Infect Dis 14:1553-1557. 865
47. Etherington GJ, Ring SM, Charleston MA, Dicks J, Rayward-Smith VJ, Roberts 866
IN. 2006. Tracing the origin and co-phylogeny of the caliciviruses. J Gen Virol 867
87:1229-1235. 868
48. Tan M, Xia M, Cao S, Huang P, Farkas T, Meller J, Hegde RS, Li X, Rao Z, Jiang X. 869
2008. Elucidation of strain-specific interaction of a GII-4 norovirus with 870
HBGA receptors by site-directed mutagenesis study. Virology 379:324-334. 871
49. Bedford T, Suchard MA, Lemey P, Dudas G, Gregory V, Hay AJ, McCauley JW, 872
Russell CA, Smith DJ, Rambaut A. 2014. Integrating influenza antigenic 873
dynamics with molecular evolution. Elife 3:e01914. 874
875 876
Table 1: Chronic Infec2on Strain HBGA Binding Preferences
VLPs represen*ng GII.4-‐2006b, P.D1, and P.D302 were assayed for their ability to bind synthe*c bio*nylated HBGAs A, B, Lea, Leb, Lex, Ley, H type 1, and H type 3 by
carbohydrate binding assay. Posi*ve reac*vity was defined as a value greater or equal to 3X the background binding value.
Table 2: GII.4 Mouse and Human mAb EIA Reac9vity with Chronic Infec9on Strains Mouse and human GII.4 monoclonal an2bodies against were assayed for reac2vity with GII.4-‐2006b, P.D1, and P.D302 VLPs by mul2ple dilu2on EIA. The mean percent binding (percent of the VLP bound to an2body in the dilu2on course compared to the amount of VLP bound with an2body at 1 ug/mL) of each VLP was fit with a sigmoidal curve, and the mean EC50 (μg/ml) EIA reac2vity 2ters for GII.4-‐2006b, P.D1, and P.D302 were calculated. * Mean EC50 EIA reac2vity 2ter for the test VLP is significantly different from the mean EC50 for GII.4-‐2006b (light grey), or ** was significantly different from both GII.4-‐2006b and P.D1 (p<0.05) (dark grey). Monoclonal an2bodies that did not demonstrate EIA reac2vity at or above OD450 nm 0.2 at 1 ug/mL with a par2cular VLP are denoted by an EC50 of >1 ug/mL. Sta2s2cs were calculated by One-‐ way ANOVA with Bonferroni post test.