by
JUDITH JOAN WAGNER
B.A., Wellesley College (1970)
M.A.T., Harvard Graduate School of Education (1971)
SUBMITTED IN PARTIAL FULFILLMENT OF THE REQUIRE4ENTS FOR THE
DEGREE OF
MASTER OF CITY PLANNING
at the
MASSACHUSETTS INSTITUTE OF TECHNOLOGY
June 1980
Judith Joan Wagner 1980
The author hereby grants to M.I.T. permission to reproduce and
to distribute copies of this thesis document in whole or in part.
Signature of Author
Certified by__
vepartnent of Urba/ Studies and Planning
May 27, 1980
Tunney Lee Thesis SupervisorAccepted by
,-- I Chairman, Departmental Bernard Frieden Graduate CommitteeRotch
MASSACHUSETTS INSTITDMk OF TECHNOLOGYAUG
2
0 1980
UBARIES
THE ECONOMIC DEVELOPMENT POTENTIAL OF URBAN AGRICULTURE AT THE COMMUNITY SCALE
by
JUDITh JOAN WAGNER
Submitted to the Department of Urban Studies and Planning
on May 27, 1980 in partial fulfillment of the
requirements for the Degree of Master of City Planning.
ABSTRACT
.
.This paper examines the economic development potential of urban
agriculture at the community scale in Boston, Massachusetts. The paper
provides an overview of the food supply for Boston and Massachusetts and
describes the food needs of the city of Boston.
The uses and value of open space, particularly as used for
com-munity gardening, are discussed and a brief history of urban agriculture
in Boston is provided.
A working definition of community economic
develop-ment is developed and a potential urban agriculture system for Boston is
described. Several case studies of an urban agriculture system are
described, and, finally, the overall benefits of urban agriculture as an
approach to community economic development are summarized.
Section I:
Section II:
Section III:
Section IV:
Section V:
The Context . . . . . . . . . . . . . .A Case for Open Space . . . . . . . . .
A Brief History of Urban Agriculture in Boston . . . . . . . . . . . . . . .
Economic Development Potential . . . .
Case Studies of Potential Economic Development Ventures . . . . . . . . . Conclusions . . . . . . . . . . . . . .
4
17
32 45 77 Section VI: . . . . . . . 10,2SECTION I: THE CONTEXT
INTRODUCTION
"Urban Agriculture" is a concept which usually evokes quizzical looks and a questioning response: "Urban what?" Especially in a city like Boston, situated in one of the most industrialized states in the country, the concept of growing food in an urban setting appears to many people to be a contradiction in terms. But what is the city of Boston "like?" What is the regional context of Boston's food supply? And how can Boston meet the new supply and demand conditions created by the energy crisis and accompanying high inflation and rising unemployment?
The first section of this paper, which explores the potential of com-munity economic development based on urban agriculture, presents information about the status of agriculture in the State of Massachusetts and about the
food needs in the city of Boston. Section II, "A Case for Open Space," argues that there are serious economic and environmental considerations for open space, which is often thought of purely (and wrongly, it will be argued) as an "amenity" for city neighborhoods. Section III provides "A Brief History of Urban Ag'riculture in Boston" in recent years and describes some of the
factors which have led to increasing interest in urban gardening and related activities in Boston. Section IV lays out "The Economic Develop-ment Potential of Urban Agriculture at the Community Scale" in two parts. First is a discussion of the definition of "community economic development" used in this paper; second is an overview of the types of development that
could take place in Boston. Section V provides a set of case studies describing some of the actual efforts on-going in Boston communities to develop components of what could become a multi-faceted urban agricultural system. The final section summarizes the potential benefits of such a system to Boston neighborhoods and the city as a whole.
THE REGIONAL FOOD SITUATION
It is now a well-known fact that Massachusetts imports at least 85 per-cent of its food. Recent figures indicate that it may be as high as 90.5 percent. It has also been estimated that Boston has only one week's supply
-4-of food available at any one time (the 1978 blizzard and recent truckers' strikes brought us within narrow margins of this limit).
In 1979, the U.S. Department of Labor statistics show that for the Lower Budget Standard (based on 1964 U.S. Department of Agriculture esti-mates of an emergency diet for basic nutritional needs), Boston is fourth highest in the continental United States or $13,623 compared to an average
U.S. family-of-four lower budget of $12,585. The cost of the lower budget increased 9 percent between autumn 1978 and autumn 1979. The average U.S. family of four restricted to a lower-scale budget paid $3,911 for food, $3,365 of that for food at home, or 31 percent of their family budget for food. In Boston a comparable family would pay $3,999 for food ($3,492 for food at home) or 29 percent of its budget. (Families on an intermediate budget paid 25 percent of their budgets on food nationally, while families
on a higher budget spent 21 percent on food.) The cost of food in the lower budget rose 9.4 percent between 1978 and 1979.
Boston families on a lower budget pay 8 percent more on the total budget, 2 percent above the national average for all food, 4 percent more
for food eaten at home. Families on an intermediate budget pay 15 percent more than the national average on the total budget and 8 percent more for
food at home. For lower budget families, there are only six cities in the nation with higher costs for food at home. For the intermediate budget, only New York City and Philadelphia have higher food-at-home costs, and the difference is a mere $43 for New York and $52 for Philadelphia.*
One of the major causes of this increased expense for Boston residents, along with factors of energy costs and distance from suppliers, is the
change in the use of Massachusetts land.
Land Use for Agriculture--An Overview
Massachusetts has an approximate land area of some 5 million acres.
Currently, 1.5 million acres of that is in urban use, federally owned or
covered by water bodies. The rest is in rural residential use, farming,
* U.S., Department of Labor, Bureau of Labor Statistics, "Autumn 1979 Urban Family Budgets and Comparative Indexes for Selected Urban Areas," Boston,
April 30, 1979.
-6-other agricultural use, forest (not all of which is actively "forested"),
and miscellaneous other uses.
Less than 6 percent, or 296,034 acres, are
used for production of four major commodity groups--vegetables, fruits,
animal products, and grains for human consumption.*
In 1880, a high point in Massachusetts agricultural history, over 65
percent of the state's land area was in farms, or 3,359,079 acres. At that
time there were 38,406 farms operating in the state. After 1900, however,
the number of farms and the amount of land in farming began to decline
steadily. By 1910 the total land in farming was 2,875,941 acres, or 55.9
percent of the total, but the total value of all farm property was rising
steadily, from $182,646,704 in 1900 to $226,474,025 ten years later. In
1910, Suffolk County, which contains the city of Boston, still had 10.5
percent of its land area (35,200 acres all together) in farms.
But the
cost of an acre of farmland in Suffolk County was up to $1,178.35 cormpared
to $50 to $75 for an acre in neighboring Middlesex County.**
By the turn of the century, the land area in farms was down another
13.3 percent to 2,494,477 acres, while total farm property value had risen
to $300,471,743; but the state still had just under 50 percent of its land
in farming use. In 1929, the Massachusetts Supplement for the U.S.
Statis-tics of Agriculture showed the statewide value of crops produced was some
$43 million, over $30 million of which was attributed to field and orchard
crops. Suffolk County, which by that time had approximately 27 farms still
operating (only 4 percent of the county's land area, but still over 720
acres)., was producing just under $90,000 worth of farm crops; but adjoining
Middlesex County, which had 3,453 farms (over 200,000 acres), was producing
$4,869,619 worth of crops. The dairy industry was another major sector of
the farm economy, and statewide some $23,000,000 worth of milk and dairy
products was produced ($3,393,359 in Middlesex County alone).
Poultry was
almost another $10,000,000 worth of production value for the state.
By 1951, however, the amount of land used for farming had fallen
pre-cipitously. In a 20-year period, farmland had been reduced to 692,300 acres,
*
Ann Marie Chickering, "Toward Greater Self-Reliance:
An Assessment of
Massachusetts' Food Production Potential," Unpublished Dissertation,
Uni-versity of Massachusetts at Amherst, 1979, p. 7 and p. 30, Table 12.
**
U.S., Department of Agriculture, Statistics of Agriculture, Massachusetts
Supplements, Washington, D.C.:
1910, 1920 1930.
or only 14 percent of the total land area. Over the next 20 years, the state lost an average of 13,000 acres of farmland per year, and by 1971,
33 percent of th6 tilled acres in the state had been lost to other uses.*
Total acreage had plummeted to 432,300, or 8.6 percent of the state's total land area.
Food Consumption and Production
A recent study of Massachusetts' food-production capability has
com-piled some figures which outline the quantities of food consumed in the Commonwealth in four food types: vegetables, fruits, animal products and grains for human consumption. These four categories of foods, excluding foods that cannot be grown in Massachusetts such as tropical and citrus fruits, coffee, tea, cocoa, rice** and similar commodities, comprise 79 percent of the foods consumed by Massachusetts residents.
Table I-1 summarizes information about the quantities of these foods consumed.
If per capita consumption in these four groups is 1,630 pounds, then it can be calculated that total per capita consumption is 2,063 pounds,
if the foods not included in this table are added.
Table 1-2 displays figures which show the amount of foods in these four categories produced in the state, and the percentage of total consump-tion in those categories which local production provides. The table indi-cates that the state produces just over 30 percent of its fresh vegetables, but only 13 percent of all vegetables consumed in the state. The state
produces over 100 percent of its fresh fruit consumption (due to the high per capita production of cranberries) but only 61 percent of all its fruit. Only 11 percent of the state's meat is produced locally, and a mere .1
per-cent of the grains consumed by humans is grown in the state.
* J.H. Foster, in "Self-Sufficiency for Food in Massachusetts?" Food and Resource Economics Extension Newsletter, University of Massachusetts at
Amherst, September 20, 1976, Table 4, p. 8.
** It is useful to use some imagination in composing this list. South Korea produces considerable quantities of rice at a latitude comparable to
New England, and Seoul, one of the world's densest and most urbanized cit-ies, has rice fields along a river which cuts through the city, and bamboo and plastic "greenhouses" which grown green produce throughout the winter within a few minutes' drive of the city. (Field observation, February 1978.)
-8-Table I-1. Quantities of Land-Based Foods Consumed in Massachusetts
Processed Total (lbs/year) Average (lbs/capita)
Vegetables
Fruits855,070,600
150,545,400
1,124,552,400
214,613,000 Animal Products Grains for Human Con-sumption1,979,623,000
(20% of all
food in four
categories)
365,158,400
(4%)
6,354,950,600
(64%)
1,152,367,600
(12%)
9,852,099,600
4,926,049.8 t
Source: Chickering, "Toward Greater Self-Reliance," Table 1text, p. 29.
Table 1-2. Percentage of Food Consumed Which Was Produced in Massachusetts
327
601,051
191
1,630
ons
2, p. 30 andVegetables
Fruits
Animal
Products
Grains for
Human
Con-sumption
Total
Consumption (lbs/year)1,979,623,000
365,158,400
6,354,950,600
1,152,367,600
Total Mass. Production (lbs/year)_265,780,495
221,259,958
682,269,425
Percent Percent Fresh of Total31
100*
780,528
13
61
11
.1
Acreage of this Commodity17,341
21,196
257,600
497
9,852,099,600
1,170,090,406
296,034
* Due to cranberry production
Source:
Chickering, "Toward Greater Self-Reliance," Table 12, p. 30.
FreshUsing the figures in Table 1-2, the total percentage of these commodi-ties (which represents 79 percent of all food consumed in the state) pro-duced in Massachusetts is 12 percent. That means that only 9.5 percent of all food consumed in the state is produced right here. In other words, Massachusetts must import 90.5 percent of its foodstuffs from other sources.
A more detailed, but less recent, set of figures is provided in Table
1-3, borrowed from the 1974 Report of the Governor's Commission on Food, and shows the approximate percentages of local production for a broader range of specific commodities.
In summary, the only foods for which Massachusetts is nearly self-sufficient are apples, fresh strawberries, cranberries, sweet corn and fish and shellfish. (The Governor's Commission also collected figures that showed a dramatic drop of 49 percent in the landings of fish over a 10-year period from 1962 to 1972.*) Updated figures show that the state now also produces approximately 49.5 percent of its milk.** On a regional basis, New England is much closer to meeting consumption needs in egg production
(89.9 percent) and more than self-sufficient in potatoes (209 percent).
Most of the fresh fruits and vegetables for Massachusetts, as much as
74.7 percent of what is purchased from outside the state, comes from beyond
the New England area, however. Some 15.4 percent of the food imported into Massachusetts comes from the general New England region, including New Jersey. California alone provides 28.2 percent of the fresh fruits and vegetables imported into the state.*** The cost of transporting food such long distances has long been a factor in the high prices of food in Boston and the state. In 1973, before the cost of energy began to rise so drama-tically, the Governor's Commission estimated that the cost of transporting food was about 8 to 9 percent of Massachusetts' total food bill, compared
* Commonwealth of Massachusetts, "Final Report of the Governor's Commission onFood," June 25, 1974, Figure 21, p. 38, U.S. Department of Commerce data.
** "Self-Sufficiency for Food in Massachusetts (Part II) ," Food and Resource Economics Extension Newsletter, University of Massachusetts at
Amherst, November 29, 1976, pp. 4-5.
-10-Table 1-3.
Food
Massachusetts Food Production as a Percentage of Total Food Consumption
Commodity Mass. Production as Percent of Consumption
Meat
PoultryEggs
Fish and Shellfish
Dairy Products FruitApples
Peaches Pears Strawberries Cranberries Vegetables Tomatoes Lettuce Sweet Corn AsparagusSnap Beans
Cabbage
Potatoes
2.7%3.3
30.1
88.1
19.4
92.88.1
10.3
96.0
51.0
1,288.2
287.0
20.3
4.1
127.9
41.5
25.4
32.9
8.6
37.2
Source:
Commonwealth of Massachusetts,
Report of Task Force #1 of the
Governor's Commission on Food, "Food Supply and Production,"
June, 1974, Table 2, p. 13.
U.S.D.A. Economic Research Service,
Massachusetts Department of Food and Agriculture and U.S.
Depart-ment of Commerce Data.
to a national average of 5 to 6 percent.* 1972 figures also show that truck transportation even at that time cost anywhere from 5 to 13 percent more than rail transport of food.**
More recently, alarming figures have been compiled for a National Agricultural Lands study showing that by the year 2000 California will have lost 15 percent of its prime farmland. New Hampshire and Florida will have lost 100 percent of their prime food production-land by the turn of the century. Vermont will have lost 43 percent of its best land, and Connecti-cut 70 percent.*** And Massachusetts' own farmland will disappear in just
27 years at its current rate of conversion to other uses.
Aside from the fact that the farmland which now supplies Massachusetts food long-distance is fast disappearing, a fact that indicates that food-producing states may need to put their own food needs above the needs of export markets, the cost of importing food will continue to rise. Diesel
fuel costs rose by 65 percent (from 31 cents a gallon to 80 cents) between December 1973 and June 1979. The average long-distance hauling truck gets between 4 and 8 miles per gallon. A recent paper which considers "The
Impact of Rising Gasoline and Diesel Fuel Costs on the Relative Competitive Position of New England Agriculture" provides a methodology for calculating
the impact of fuel price increases of 50 cents per gallon on food prices. The result estimates a 1 percent per unit effect on the cost of food which, if passed on through two handlers each with a 50 percent mark-up policy, could amount to 2.25 cents per ufnit.+ Assuming the unit to be a pound, it is estimated that with the average per capita consumption of 2,063 pounds,
* Commonwealth of Massachusetts, Final Report of Task Force #3 of the Governor's Commission on Food, "Transportation, Distribution, Storage, and Logistics," June 1974, p. 3.
** Commonwealth of Massachusetts, Governor's Commission on Food, "Final
Report," Figure 13, p. 26.
*
Boston Globe, May
,1980.
+ Dr. Robert L. Christenson, "The Impact of Rising Gasoline and Diesel Fuel
Costs on the Relative Competitive Position of New England Agriculture," University of Massachusetts at Amherst, undated, p. 18.
-12-a cost difference of $46.42 per ye-12-ar could be found for e-12-ach person, or
$185.68 for a family of four. The author concludes that the fuel price increase would have "a minor impact on consumer food prices," but a rough calculation shows that this amount adds up to almost $30,000,000 for Boston's po lation and over $280,000,000 for the entire Commonwealth. These figures also do not account for the fact that fuel costs are only
10-12 percent of total transportation costs by long-distance truck.*
In addition, further work needs to be done on the effects of continu-ing shifts from rail transport to truckcontinu-ing of foods. In 1974 rail trans-port was used for approximately 25 percent of meat imtrans-ported and for 43 percent of fresh produce, or roughly 34 percent of all food transportation.
In 1974, truck hauling was on the average 6 percent more expensive than rail.** Overall, transportation costs account for about 8 percent of the retail food bill.*** Using more current cost figures, the impact of fur-ther shifts to truck from rail transport should be estimated.
In short, Massachusetts, and its largest city in particular, may realistically face increasing difficulties in getting food at affordable prices. The next section takes a closer look at just what the food needs are in the city of Boston.
THE CITY OF BOSTON AS CONSUMER
Everyone needs to eat. Food eaten at home costs Massachusetts con-sumers some $4 billion per year. Using the statewide per capita figures, the population of Boston, assuming that everyone is able to eat the average amount of food, requires 1,318,257,000 pounds of food, or almost 660 million tons per year. But some sources of information indicate that in fact many residents of Boston may not be able to obtain all the food they need.
* Ibid., p. 16.
** Commonwealth of Massachusetts, Final Report of Task Force #3 of the
Governor's Commission on Food, p. 6.
*** Christensen, "The Impact of Rising Gasoline and Diesel Fuel Costs on the Relative Competitive Position of New England Agriculture, " p. 16.
A recent feature article in the Chicago Tribune characterized Boston
this way:
Poverty is the most pervasive problem. About one out of every six persons in this Metropolis of
639,000 receives some form of welfare assistance,
and this is thought to be the highest such rate among big cities in the nation.*
Nor is this a short-term problem. "We have a lot of second- and third-generation white Bostonians on welfare," State Representative Barney Frank of Boston told the Tribune. In 1968 a special section of the Boston Globe examined the issue of poverty in the city and found that fully "twenty-five percent of the city is afflicted by poverty."** And a survey of low-income neighborhoods in 1970 by Action for Boston Community Development (ABCD--Boston's anti-poverty agency) found that among all races, 13.5 percent of the population earned incomes under $3,000, 22.3 percent earned between
$3,000 and $5,999, and another 28.9 percent earned between $6,000 and
$9,999. The current federal "poverty" standard is $3,790 for a non-farm
family
of
one and $7,450 for a family unit of four.***
These family income figures become all the more astonishing when com-pared to national figures which show that the average per capita costs for
food rose from $897 to $911, 11 percent more than in 1978. The national average percentage of income spent on food was 16.4 percent, or "just a
little below the 1978 figure."+ In 1973 the percent of income spent for food was 15.8 percent. Obviously for those families with lower incomes, the percentage of income spent on food is much higher, in fact a signifi-cant portion of the budget. What happens, undoubtedly, is that people eat less food, and less nutritious food, when they are faced with a choice between heating their homes, affording transportation to get to work, and
*
Chicago Tribune, March 28, 1980.
** Boston Globe, March 19, 1968.* U.S., Bureau of Labor Statistics, "Urban Family Budgets," 1980. + Boston Globe, April 23, 1980.
-14-eating a balanced diet.* There are several other indicators of the need for assistance with food costs, particularly the various food service pro-grams in Boston including the School Lunch program, elderly meal services,
the Women, Infants and Children Program, and food stamps.
Current figures show that some 64 percent of all the children in
Boston public schools are receiving free and reduced-price meals in school. This is some 42,000 children (or 7 percent of the city's population), of which 40,000 are considered eligible for completely free meals at school.**
Eligibility criteria are specified in terms of family income***: Maximum Gross Income Size of Household for Free Milk and Meals
One 0 to $4,590
Two 0 to $6,040
Three
0 to $7,490
Four 0 to $8,940
Five 0 to $10,390
These income criteria are higher than those used by the Bureau of Labor Statistics to determine official "poverty" levels.
The State Department of Elderly Affairs, which is authorized to serve meals to anyone over sixty without consideration of income criteria, serves
over 700,000 meals to 2,779 elderly people in Boston per year. An official
of the program estimates that the program i-s "not really scratching the surface" of need among elders, but the program is limited by available funding.+The Women, Infants and Children Program, established by Congress to assist women, infants and children found to be "at nutritional risk," is
* See article on the impacts of energy costs on the elderly, Gerry McMullen, "To Be Old, Cold, Hungry," Boston Globe, May 22, 1980, p. 28.
** Figures for all Boston public schools, October 1979; Massachusetts De--partment of Education, Bureau of Nutrition Education and School Food
Services, "Report of Needy Children as of October 31, 1979."
*** Massachusetts Department of Education, Bureau of Nutrition Education and School Food Services Federal-state eligibility forms.
available to those who meet income guidelines which are 195 percent of the "poverty" standards established by the National School Lunch Program
($12,660 for a family of four in Fiscal Year 1979). Participants must also meet a rather rigorous set of medical and nutritional criteria. Statewide, the program serves some 34,000 people. Boston, which is ranked as 20th out of 345 cities and towns in the state in terms of need (that is, only 19 other cities and towns have a higher level of need), accounts for almost 44 percent of the state's participation, or 13,154 people per month.
The federal Food Stamp program, administered by the state, was serving
38,285 households or 107,198 people (using the official multiplier of 2.8)
in Boston in March 1980. Eligibility is based on an elaborate set of basic income guidelines and formulae for deductions for a variety of expenses which can be subtracted from income before it is declared. In March 1980, the basic benefits (that is, not counting the emergency cases handled on-the-spot as the need arises) amounted to $15 million statewide, with $3.3 million going to Boston residents during that month. This means that roughly $40 million is provided to Boston residents annually to assist with the cost of food. Since the average benefit is only $86.73 per house-hold, or $30.97 per person, it is clear that food stamps are only a supple-ment to the family food budget and cannot allow a family to meet all of its food needs. The maximum benefits available to a family of four is $209 per month. While the U.S.D.A. considers Boston's needs met by $101%," anofficial in the state office administering the program estimates that, in fact, the program may be missing as many as 10 to 15 percent of people eligible and in need of assistance. The same official pointed out that all benefits are calculated according to national price figures, a process which ignores the higher costs of food in New England and Boston, and makes no allowances for ethnic preferences in foods which may not be included in the Department of Agriculture's calculations of a "basic nutritious diet."*
What is clear from these figures is that 26 percent of the city's
population, assuming minimum overlap among these programs, are receivingsome form of assistance for food. A considerable portion of Boston's
popu-lation, it
appears, is struggling to feed its
families.
While Boston's
* Personal commumication, May 1980.
-16-average income is rising, from $7,200 in 1960 to around $10,000 in 1978 (Boston Redevelopment Authority figures), the number of families making less than $5,000 is at 22 percent citywide. In many neighborhoods it is well over that figure. (In Chinatown it is 48 percent, in Uphams Corner it
is 29.8 percent, and in the Fenway it is at 30 percent. The North End and South Boston are at 25 percent, and a number of other neighborhoods did not have figures reported in the recent BRA neighborhood profiles.) One source from the Boston Redevelopment Authority shows that 16 percent of the city's families in 1970 had incomes below $4,000. In some neighborhoods (the South End and Roxbury) the figures went as high as 28 percent. Another
18.5 percent of all families in 1970 had incomes between $4,000 and $6,999*
(the latter figure is below the official "OMB Poverty Guidelines" for 1980--$7,450 for a non-farm family of four--and just over the poverty level of
$6,230 for a family of three). These figures are nowhere near the budget projections of the U.S. Department of Labor which estimates the cost of a "lower" standard budget for a family of four at $13,623.
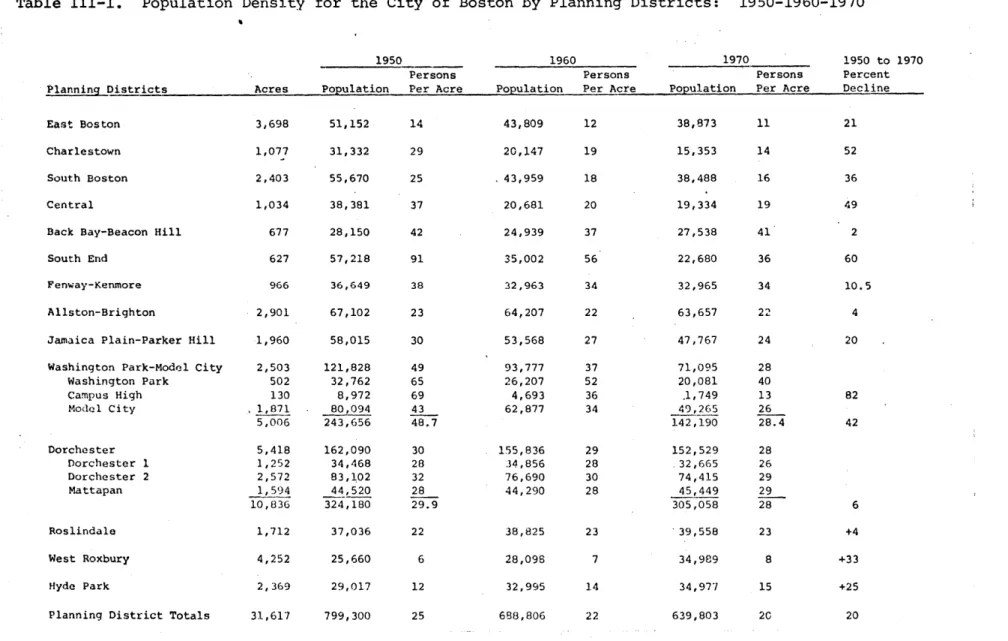
One other important characteristic of "a city like Boston" is the con-dition of its neighborhoods. The tremendous amount of vacant land in Boston is described in detail in Section III, "A History of Urban Agriculture in Boston." The presence of this vacant land, which is currently a strongly negative force in local neighborhoods, should be seriously considered as we try to answer the question which these figures force us to ask: How will the people of Boston be fed?
* Boston Redevelopment Authority, "Distribution of Families by Income Class and Type of Neighborhood for City of Boston," actual figures for 1960, 1970
and 1985 targets, undated.
WHAT IS OPEN SPACE?
The need for open space and the purposes of green places in the city have long been subjects of discussion among social and physical planners from the earliest days of Boston's history. Economically, open space was at one time an important factor in the general prosperity; the Boston Common was one of the earliest publicly-held open spaces which served to support the livestock which was a basic element in the local economy.
Open space has often been considered a luxury for the wealthy and the "better" classes; but it has also been considered an important element of the various antidotes to the poverty, illness and spiritual emptiness which have plagued the centers of cities from early times. Frederick Law Olmsted was one of the articulate advocates of open space for "the masses" as a direct influence on the physical and moral health of the society. His famous system of parks, which remains Boston's central open space resource, was modeled on his belief that all people should have access to the uplift-ing effects of natural areas and open air, even in the city itself. He also knew that open spaces would enhance the value of nearby properties provided with a view and easy access to a "country" environment.
The historical views of open space, however, have been altered and challenged by current conditions. Presently, the city of Boston, like many others, finds itself with an unexpected legacy of empty land in the city, the product of unfinished urban renewal which demolished more structures than it replaced, and the cycle of disinvestment in many city neighborhoods which left houses vacant and subject to arson and eventual demolition. As a result, Boston now has over 4,650 acres of land considered open space, vacant or "extractive."* The city may now have more "open spaces" compared to its land area and population density than ever before. Given the amount.
and availability of land as yet undesignated for other purposes, there is
more "choice" about developing open space than at any other time inBoston's recent history.
* These categories include woodlands, wetlands, and meadows as well as quarries, abandoned wharves, utility rights of way, and land cleared for urban renewal or road construction. Boston Redevelopment Authority, Boston Urban Wilds, September 1976, p. 1C.
-17-
-18-At the same time, however, with tightening city budgets, the
mainte-nance and upkeep of open space in the form of parks are more problematic
than ever. City agencies are loath to develop new parks for fear that they
cannot be maintained and will become problems to the local residents and to
the responsible city agencies.
Before we proceed with this discussion, it is important to make a
dis-tinction between "open space" and "vacant" land. There are those who view
any open land as potential space for a variety of activities; and there
are those who view any open land, even land put to some recreational or
social use, as "underdeveloped" and
for
all
practical purposes "vacant."
The distinction between open space and vacant land is critical to the
defi-nitions and rationale used by planners and policy makers. Debates about
the "highest and best use" for land are a frequent point of contention
between business, city officials and neighborhood residents, all of whom
have different views about what is in their best interests. For the
pur-poses of this discussion, "vacant land" will be defined as land that has no
value in terms of aesthetic appreciation, social uses or economic uses by
local residents or passersby.
"Open space" is
defined as any land which is
utilized for any of those purposes. It is unlikely that vacant land will
become valued open space without some form of investment, whether local
effort or official efforts to make some improvements, especially in a city
as old as Boston, where the natural landscape has been disturbed to the
point that there is almost no natural growth other than the hardiest weeds
and weed-trees.
THE USES OF OPEN SPACE
The term "open space" itself stands for a wide variety of land uses.*
There are three traditional forms of open space most often planned into
cities. First are the familiar passive parks--benches, lighting, a
foun-tain, perhaps, plantings, historical notations or monuments, paths and
walkways. At their best, such spaces are restful, beautiful, and inviting.
At their worst, such spaces become filthy, with broken fixtures and unkempt
plantings, ill-used or used for purposes far from those intended.
*
Thanks to co-workers Charlotte Kahn and Martha
Martin for discussicn
The second familiar form of open space is the active recreation
area--a barea--all field or court, nets, hoops, lighting, observarea--ation area--arearea--as, parea--aving,
and fencing.
The third type of open space, less common in cities and towns until
recent years but now increasing with various land-purchasing programs
("self-help" in Massachusetts), is natural areas.
These areas need tending,
but contain much less visible equipment or physical additions to the
natural landscape. These areas serve for more remote and quiet
uses--walk-ing, hikuses--walk-ing, or sometimes picnics and family outings.
A fourth common sort of open space is not always immediately
recogniz-able as such. Streets, sidewalks, parking lots and building perimeters
-are all often used for passive purposes (sitting, chatting, watching) or
active recreation (games, ball playing, bicycles, skateboards and
roller
skates).
(Into this category could fall the park-drives and sidewalks of
the Metropolitan District Commission (MDC) parks and the Jamaica Way and
River Way roads, which were, in fact, never meant to be the heavy traffic
arteries which they have become.)
The vistas provided by these spaces
should not be overlooked. Frequently these stretches of open space are
all
that some areas of cities have for a view, and dramatic differences
can be noted between streets with trees and plantings and those without.
City planner Kevin Lynch offers a general definition of open
space as:
An outdoor area in the metropolitan region which is
open to the freely-chosen and spontaneous activity,
movement or visual exploration of a significant
number of city people.*
He actually excludes ball diamonds and courts because "they are specialized
facilities
usable only in a particular formalized
way, and therefore not
open."
He does include vacant lots in his definition.
In contrast to these conventional forms of open space, a new form
of
land use is appearing in cities, of which Boston is a leading example. In
many communities,
local residents have taken it
upon themselves, with and
without the assistance of government, to convert vacant land to open
space
which is not exactly recreational, not exactly social, and not exactly for
-20-economic or aesthetic uses. But the land used for urban gardening to produce food, fiber and flowers, is a unique combination of active and passive recreation, community social exchange, beautification, and economic value.
The most interesting differences between this sort of open space and others are important for users, planners, city agencies and local residents alike. First of all, this type of land use guarantees constant occupation of the land by people working in their garden plots. People sometimes work late into hot summer nights, or before work in early mornings. The mainte-nance of the land is provided by the users themselves who see the benefit of keeping the soil in good condition, and fences and water systems in working order. In addition, the land is used to produce food which is a
supplement to basic income and can be considered an economic output. In some cases people are saving hundreds of dollars a growing season on plots as small as 10' x 20' or 20' x 30'.
The constant use, the local maintenance, the extra economic benefits to users provided by gardens, all contrast sharply to other planned open spaces which are often viewed as "the City's" rather than the users', and are often abused. Critics of conventional open space consider it superflu-ous and expensive for the "return on investment." Gardens, on the other hand, are self-maintaining and provide economic returns to the users.
Another contrasting benefit, more difficult to cefine, but visible to
observers, is the cultural and social exchange that takes place on commun-ity gardens. People who have a common interest in gardening and share the common ground of the garden, seem able to communicate across ethnic, age and cultural barriers that deter interaction in other settings such as parks and playgrounds. All things considered, this "new" form of land use may contain some important clues about how other open spaces can be mademore secure and useful to communities. A more detailed discussion of ways
that open space can and should be developed in Boston will be presented
shortly. First, however, it is useful to review some of the recent work which has been done to determine some of the more scientific values of openspace.
THE VALUE OF OPEN SPACE
The uses of open space in aesthetic, moral and even recreational terms may actually be the least important of the functions of open spaces,
parti-cularly in a dense urban setting. The physical properties of trees and other greenery allow them to act as cleansers of air pollution, buffers against wind and solar radiation, temperature regulators, noise controllers, erosion reducers, and, in short, control systems for the extreme conditions
found in most cities. The construction of tall buildings, densely placed
structures, shadowing, pavement, auto exhaust and smokestacks, all contrib-ute to the wind turbulence, fouled air, excessive runoff, sharply fluctuat-ing temperatures, high noise levels and glare which characterize most city environments. Open spaces offset some of these conditions by providing locations where rain water can soak into soils, where grass, trees andshrubs can clean away carbon dioxide and produce fresh oxygen, where temper-atures are modulated and wind is controlled.
In an extensive publication by the U.S. Department of the Interior, some impressive facts and figures are collected.* It would require, for
instance, a greenbelt one-half mile wide alongside a highway to readjust
air quality to acceptable levels.** Since most cities do not have thatamount of open space available, it seems all the more important to develop
open space at every opportunity. One tree's conversion capability has been
calculated at 2400 grams of carbon dioxide per hour (for a beech tree with
1600 square meters of exterior surface).
In the process 1600 grams of
glu-cose are produced along with 1712 grams of oxygen. Roughly, such a tree
can cleanse the carbon dioxide produced by two homes (500 cubic meters each)every day.
A leaf surface of 25 square meters can produce, on a sunny day,
approximately enough oxygen for one person in a day; but since people
breathe all night and through the winter, 150 square meters of leaf surface
are needed to produce one person's oxygen supply. This converts to roughly
30 to 40 square meters of
greenery
per person.
For a city of 600,000,
* U.S., Department of the Interior, National Parks Service, and the American Society of Landscape Architects, Plants, People and Environmental
Qualit,
by G.O. Robinette (Washington , D. C.: Government Printing Office, 1972).
**.Ibid., P. 50.
-22-that's 18 to 24 million square meters or over 4400 acres! (This does not provide for commuters and visitors.) Studies have also shown that trees
can make a significant difference in the levels of ozone present in the atmosphere, reducing this pollutant when it is too close to the zones occupied by humans. But studies have indicated that green spaces are not interchangeable with buildings. In other words, a tree cut down in the center of the city cannot be "replaced" by one on the periphery with the same purifying effect that the original tree had on the air in the central area. If it is remembered that the average life of a tree planted
by the City of Boston is a mere eight years, it-seems that a full-time
tree-planting program would be necessary even to approach maintaining the level of greenery needed to keep the city's air relatively healthful.
Plants have also been shown to have a remarkable ability to reduce noise. Tree and shrub shields can significantly reduce the decibel level of noises by absorbing, breaking up and reflecting sound waves. A neigh-borhood like East Boston, which has suffered for decades now from
excessive noise from the airport, could possibly benefit from a dense planting of a buffer-zone around the airport, particularly along the.areas where planes are positioning onto runways. The Boston neighborhoods along the new Orange Line Extension of the subway and commuter railroad should
likewise be provided with carefully designed plant barriers to reduce the amount of noise which will result, even with the depressed track design.
Plants are also able to provide important protection from solar radiation and reflection, which can be serious problems in central cities where paving and building materials serve to increase absorption and reflection of radiation.
Trees, shrubs, ground cover, and turf, or even a combination of these, are effective in reducing direct as well as reflected solar radiation. They
absorb the heat, provide shade for walls and ground surfaces, and create dead air spaces. Thus plants provide insulation for buildings and the earth, not only from the intense heat of solar radiation, but also from abrupt temperature changes. Plants absorb more of the sun's heat during the day and release
it slowly in the evening--not only cooling the day-time temperature, but also warming the evening temperature and moderating it.*
Wind is another problem which is exacerbated by the construction of city spaces. Tall buildings, sharp corners, and dense construction next to vast empty spaces such as highways and wide streets all contribute to the sometimes fierce winds that characterize Boston's weather. The wind-chill factor often makes a significant difference in perceived tempera-tures and gusts make walking unpleasant and even hazardous for pedestrians in many locations. "Surfaces of buildings will always produce turbulent airflow" which is unpredictable and difficult to control, states the Department of Interior publication.* Trees and shrubs, properly spaced and located, can make measurable differences in wind patterns, slowing wind speeds and redirecting currents. Researchers' Bach and Matthews -are
quoted as follows:
Wind is one of the most important climatic elements in urban planning, since dispersion of air pollu-tion and human comfort are largely dependent on it. Winds that are too strong cause the funnel effect
in our canyon-like streets. This may locally lead to high air pollution potential through lifted
street dust and strong wind fumigation from elevated sources. Winds which are too light may lead to stagnation conditions which may also proddce high air pollution potential and in summer muggy condi--tions. The dieal ventilation system would prevent the funnelling effect but favor the country breeze, i.e., wind blowing from relatively cleaner and cooler country, suburban, or green areas. This could be achieved by a properly spaced system of green areas cutting through the entire built-up area.**
It is even possible to redirect snowdrifts around sidewalks, roads and parking lots with careful placement of plantings.***
Besides offering relief from and modification of wind patterns, plants can contribute to temperature control through their ability to retain moisture. By preventing evaporation of moisture from the soil back into the atmosphere, trees and shrubs stabilize temperatures by
* Ibid., p. 73.
** U.S. Department of: Health, Education, and Welfare, "The Importance of Green Areas in Urban Planning," (Washington, D.C.: July 1969) as cited
in Ibid., p. 86.
*** Ibid., pp. 93-94.
-24-maintaining relatively high humidity. Temperatures under protective plant cover remain cooler during warm days and warmer during cool nights. Roots
retain moisture longer in soil, aiding percolation and cleansing of the water and contributing to the replenishment of aquifers. It has also been estimated that a home well-protected by properly placed plantings can save
22.9 percent of its fuel bills while keeping a temperature of 70 degrees F.
Imagine the fuel savings city-wide if more buildings were protected from wind-chill and radiation by plants.
In summary, the Department of the Interior publication states: Manmade surfaces, then, exaggerate.temperature
extremes. Because plant materials absorb radia-tion and release it more slowly, plants are able to decrease temperature extremes. Highly reflective, manmade surfaces absorb heat to a large extent and
release it rapidly, causing an overheated environment. Plant materials, on the other hand, absorb a greater amount of solar radiation during the daytime and release it slowly at night, reducing diurnal tempera-ture variations. Plant materials, especially in the case of deciduous trees, interfere with solar radia-tion reflecradia-tion, causing a temperature reducradia-tion, not only in the shade of the tree, but immediately adjacent to it.*
From the evidence that has been amassed, open spaces may be more important from the standpoint of environmental health than from any other. The use of land for open space, in this sense, may be the highest and best use in many situations, particularly if criteria designed to protect and maintain environmental quality are used. Open spaces shoula perhaps be evaluated less in terms of their beauty or recreational value, and more
in terms of survival.
With the physical environmental health factors in mind, it is possi-ble to reevaluate the conventional sorts of open space in a different way.
It is quickly clear that the usual paved recreational space will be of little value, since the asphalt or cement paving has all the characteris-tics most detrimental to the environment. Unless concentrated plantings are incorporated into such areas, they will contribute little to the modification and purification of city conditions. Likewise, streets,
sidewalks and parking lots which are often appropriated as open spaces, are by their construction unable to contribute to temperature control, water retention and reduction of radiation. Natural areas and passive parks tend to be much more suited to providing these benefits due to the
existence of grass, trees, shrubs and less intense use of pavement or fixtures. It appears that much of what is considered "official" open space is not contributing at all to the protection of the city's environ-ment.
Community gardens, however, are a positive contribution, since they not only keep ground open to rain, but are planted with crops that con-tribute to the production of oxygen, prevent soil erosion and modify temperatures, and as a bonus produce food for the gardeners which is fresher than any available from stores.
There are other important uses for open space, which have been briefly mentioned, and should also be built into any set of criteria for the development of open space in the city. These may be grouped together as social and cultural uses and include the interaction of people in open
spaces, group recreation, family and extended family events, parties,
exchange of information, goods, services in both informal and formal ways, celebrations and meetings of concern to various interest groups. Often parks or playgrouds are too specific or too general in design to accommo-,date some sorts of cultural and social events. Streets and sidewalks are
sometimes used for block parties, and parking.lots can be converted for some sorts of celebrations or exchanges such as the farmers' markets which are becoming popular in Boston.
If we tried to take into account all the needs of people for open space and all the important functions of open space in a city setting, what sort of criteria could be developed to accommodate all these elements into open space for each neighborhood?
CRITERIA FOR NEIGHBORHOOD OPEN SPACE
Traditional planning "tools" for determining open space needs have been very one-dimensional and based almost entirely on population. Stan-dards for recreational open space, both passive and active, are almost always offered as so many square feet or units per thousand population.
-26-There is usually little effort to modify these standards to population density or age structure. Proposed standards range from 25 percent of a
land area (suggested for the dense New York region) to the much-used "ten acres per thousand" proposed by the National Recreation and Park Association. Economist Marion Clawson has gone far beyond that amount to
suggest 42 acres of regional open space per thousand population plus 36 acres of local open space per thousand people.
If we assume that various uses of open space require different types of open space, the problem of supplying every area of the city with all sorts of space types may seem large. But with some imagination, it should be possible to design various spaces which can serve multiple roles. Both the natural areas and the active recreation areas do not lend themselves well to combination with other uses. But passive recreation, gardening, and various cultural uses and some economic uses are more flexible. Pas-sive recreation can be compatibly introduced at the perimeters of garden space. And concerts, picnics and farmers' markets, for example, could all happen on the same "plaza" style space in one area.
In Boston, the strong neighborhood identities and ethnic character of various neighborhoods offer some suggestions about the style of open space that will be most appreciated. But populations shift, ages shift, and
space should also be designed with an understanding that uses may change over time. It is difficult to determine the best size unit to design the most desirable mix and location of open spaces, but it is safe to say that the current practice of arbitrarily dividing urban areas into units of population by size only is not the most effective for meeting actual needs. Certainly the largest unit that should be used for planning is
the neighborhood, even though in Boston the neighborhoods range tremen-dously in size. Within some of the largest neighborhoods such as
Dorches-ter, itwill be necessary to determine sub-areas which are more akin to
neighborhoods elsewhere in the city. Ideally, if at all possible, the
minimum open space available to every neighborhood should be as follows:Active recreational Paved ball playing area, tennis court, and turf area: area for soccer or other ball games. This area should be surrounded by plantings of trees and shrubs to maximize the oxygen production area available, to reduce glare and provide water retention, runoff control and temperature
Active recreational area: (continued) Passive recreational area: Natural areas: Food-producing and aesthetic gardens: Social-cultural space:
modification. The ideal would be turf playing areas to obtain the benefit of open ground and the cooling effect of grass.
Benches should be placed in a wide variety of places to provide passive seating. One or more
small pocket parks can offer the passive space desired by seniors, small children and
passers-by. Seating and plantings should be located
around all other types of open space.
Each neighborhood should have at least one area which is designated as a Natural Preservation Area and protected from development. This area
could even be a once-vacant lot which is planted with a mix of wild flowers, native trees and
shrubs which can be tended with a minimum of care for maximum "neatness." Areas which might be hazardous for building or prone to erosion
or other types of degradation can be "reclaimed" in places where the original natural state has long since been destroyed.
Each neighborhood should have sufficient area to provide 10 to 15 percent of the population with garden plots of at least 10' x 20'. In neighbor-hoods where a higher proportion of the.residents are tenants without land available to them
around their own homes, the space for community gardens should be increased. Likewise, neigh-borhoods with high proportions of families with low to middle level incomes should reserve pro-portionately more land for food production. The ideal situation would be to provide enough land for food-bearing trees, vines and shrubs and for blooming plants for increased food production and beautification. In addition, space for con-struction of a greenhouse or solar dome would
insure some winter activity in food production, especially for older people.
Every neighborhood should have at least one open space which is designed to handle relatively large groups of people for concerts, neighbor-hood parties, farmers' markets, bazaars, fairs and similar events. The space does not need to be large so much as visually defined,
attrac-tive, with informal seating available on walls and curbs and access for trucks and vehicles.
Ideally, the entire area would not be paved but bricked or cobbled to provide maximum drainage
into the soil; again plantings should be abun-dant.
-28-Streets, sidewalks, and other "found" open space:
All streets and sidewalks should be treated as
the visual and physical open space that they are. At a minimum, plantings should be fre-quent, in the form of trees, shrubs or planters. Medians should also be planted wherever possi-ble to reduce noise, glare and auto pollution. Ideally, any available empty open space, such as the ugly chainlink fences surrounding parking lots, should be planted with vines such as
honeysuckle, which require minimum care but would contribute to the general greening and
oxygen production capacity of the city as well as populations of helpful insects such as honey bees. The more dense the population, the more important the use of these spaces for green space becomes.
Open space of these types would insure that every citizen has a range of open space to meet different needs. Lynch insists that
Choice must be within reach. Open spaces, particu-larly those for daily or weekly use, should be physically proximate to their users, and connected to them by visible easy paths. Thus a network of relatively small spaces, well distributed within the urban system, may be more useful than the large tracts which look so well on land use maps. This is true as long as an open space is large,enough to establish its special character (a size which may often be astonishingly small).*
Lynch also asserts that:
As a matter of public priority the system should first be designed to open up choices for groups now .most deprived of choice. The opposite often occurs
in city park systems, where wealthier, less dense areas get the lion's share of public open space.
Of course these areas are the most influential,
and also most vocal and consciously aware of the advantages to be gained.**
The implementation of such an open space system for the city of Boston would be no small chore. However, closer examination may reveal that it would be less costly than it might first appear. The one kind of
*
Lynch, "The Openness of Open Space," p. 112.
**
Ibid.
open space which has been rather consistently developed has been the
active recreation areas which are the most expensive to prepare. Although there may not be enough active recreation area in every single neighbor-hood unit, especially where population density has been ignored as an indicator of need, it is not likely that there will be an overwhelming need for more such facilities. Plantings and other improvements would be needed at almost all existing sites, however, since most are minimally
landscaped at best.
Passive recreation areas in the form of parks are also well-supplied in Boston, if not well-maintained. That issue will be addressed in a moment. Again it may be additional landscaping which requires most
atten-tion in these areas to enhance their value environmentally and
aestheti-cally.
Garden space and cultural space are the two least common types cf open space found in Boston neighborhoods. Both of these, however, can be developed at relatively low cost on vacant land that is currently idle and
ugly.
Natural areas are also scarce in city neighborhoods, but there are low-cost ways to restore otherwise idle space; and for the few valuable natural areas still existing, there are now federal and state matching funds to assist city acquisition.
The argument that utilizing currently "vacant" land for open space is removing land from the tax rolls has some validity, but there are
ameliorating factors. The land is currently not bringing in much revenue, and indeed costs the city considerable funds for cleaning and maintenance. The budget for "open space management" (vacant lot cleaning) for the City of Boston was over $1.8 million (counting in-kind CETA funds) in fiscal year 1979, for only one-third of the city's neighborhoods. In addition, many of the lots are too small for commercial or residential rebuilding under current zoning laws. Considering the environmental value of open
space, the health of the city will be directly affected by use of land for permanent open space. Particularly in the case of garden space and social
space which can be used for economic ventures like markets, the open space can actually generate "income" for local residents, something a vacant lot will never do. (Section IV provides more detailed information on the potential economic benefits of gardens.)
-30-Finally, there is no way to measure the indirect or subtle effects that increased and improved open space can have on a city. Pride and neighborliness can be restored (we have seen it happen), valuable cross-cultural and cross-age exchange can be encouraged, and increased activity in a neighborhood can actually discourage crime and vandalism. Kevin Lynch articulates several other values of open space which gardens in particular seem particular suited to providing. In addition to providing a "meeting ground for social contact," Lynch states that open space should offer ways to "extend the individual's choices" in relation to the environ-ment, and "convey a sense of the web of life, of the intricate interdepen-dent system of living things."* Open space is no panacea, particularly
when the economy is becoming so tight and unstable; but in all its dimen-sions, it can provide the basics for a healthy neighborhood.
OPEN SPACE MAINTENANCE
The subject of implementation of an open space system, and the accom-panying issue of maintenance of what is developed, deserves considerably more space.. But there are several points that should be mentioned at a minimum. Involvement of users is critical at each stage of development. Local people know their own needs. Planners and designers will need
sharp negotiating skills to mediate among cultural differences in neigh-borhoods with mixed populations and age groups, but their work will be made easier and more successful if they will spend the time understanding the vision of the city that many neighborhood residents have in their minds' eyes. There have also been some convincing experiences to show
that involving local residents in the actual construction of open space such as parks, as was done in Somerville, can have surprising and positive results. Caretaking and use of the park space in that case was greatly enhanced because those who had worked on the construction felt it was
truly "theirs." Community gardens which have been constructed with the help of the gardeners and local residents are often well organized in the process. Again the caretaking is improved and even though vandalism may
occur, neighbors tend to be watchful and protective of a garden everyone has worked on. The costs of such construction is also lowered, even if