HAL Id: hal-01909502
https://hal.archives-ouvertes.fr/hal-01909502
Submitted on 31 Oct 2018
HAL is a multi-disciplinary open access
archive for the deposit and dissemination of
sci-entific research documents, whether they are
pub-lished or not. The documents may come from
teaching and research institutions in France or
abroad, or from public or private research centers.
L’archive ouverte pluridisciplinaire HAL, est
destinée au dépôt et à la diffusion de documents
scientifiques de niveau recherche, publiés ou non,
émanant des établissements d’enseignement et de
recherche français ou étrangers, des laboratoires
publics ou privés.
biosilica particles
Paul Reyerson, Anne Alexandre, Araks Harutyunyan, Rémi Corbineau,
Hector Martinez de la Torre, Franz Badeck, Luigi Cattivelli, Guaciara Santos
To cite this version:
Paul Reyerson, Anne Alexandre, Araks Harutyunyan, Rémi Corbineau, Hector Martinez de la Torre,
et al.. Unambiguous evidence of old soil carbon in grass biosilica particles. Biogeosciences, European
Geosciences Union, 2016, 13 (4), pp.1269-1286. �10.5194/bg-13-1269-2016�. �hal-01909502�
www.biogeosciences.net/13/1269/2016/ doi:10.5194/bg-13-1269-2016
© Author(s) 2016. CC Attribution 3.0 License.
Unambiguous evidence of old soil carbon in grass biosilica particles
Paul E. Reyerson1,2,a, Anne Alexandre3, Araks Harutyunyan1, Remi Corbineau3, Hector A. Martinez De La Torre1, Franz Badeck4, Luigi Cattivelli4, and Guaciara M. Santos11Earth System Science, University of California, Irvine, USA 2Department of Botany, University of Wisconsin-Madison, USA
3Aix Marseille Université, CNRS, IRD, CEREGE UM34, 13545 Aix-en-Provence CEDEX 4, France 4Consiglio per la Ricerca in Agricoltura e l’analisi dell’economis agraria – Genomics Research Centre, Fiorenzuola d’Arda, Italy
acurrent address: Department of Geography and Earth Science, University of Wisconsin-La Crosse, USA
Correspondence to: Guaciara M. Santos (gdossant@uci.edu)
Received: 19 June 2015 – Published in Biogeosciences Discuss.: 17 September 2015 Revised: 27 January 2016 – Accepted: 8 February 2016 – Published: 1 March 2016
Abstract. Plant biosilica particles (phytoliths) contain small
amounts of carbon called phytC. Based on the assumptions that phytC is of photosynthetic origin and a closed system, claims were recently made that phytoliths from several agri-culturally important monocotyledonous species play a sig-nificant role in atmospheric CO2 sequestration. However, anomalous phytC radiocarbon (14C) dates suggested contri-butions from a non-photosynthetic source to phytC. Here we address this non-photosynthetic source hypothesis us-ing comparative isotopic measurements (14C and δ13C) of phytC, plant tissues, atmospheric CO2, and soil organic mat-ter. State-of-the-art methods assured phytolith purity, while sequential stepwise-combustion revealed complex chemical-thermal decomposability properties of phytC. Although pho-tosynthesis is the main source of carbon in plant tissue, it was found that phytC is partially derived from soil carbon that can be several thousand years old. The fact that phytC is not uniquely constituted of photosynthetic C limits the use-fulness of phytC either as a dating tool or as a significant sink of atmospheric CO2. It additionally calls for further ex-periments to investigate how SOM-derived C is accessible to roots and accumulates in plant biosilica, for a better under-standing of the mechanistic processes underlying the silicon biomineralization process in higher plants.
1 Introduction
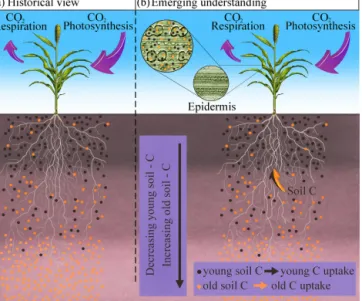
Silicon (Si) is the most abundant element in the Earth’s crust and is widely recycled by higher plants. Si is acquired by roots from soils and precipitated in or between the cells as micrometric hydrous amorphous biosilica particles called phytoliths. Phytolith abundances range from < 1 % of dry weight (d wt) in many plants to several % d wt in grasses that are Si-accumulators (Geis, 1973; Runge, 1999; Webb and Longstaffe, 2000; Raven, 2003). Phytoliths contain small amounts of carbon (C) occluded during silica precipitation (Alexandre et al., 2015), commonly termed as phytC or phy-tOC and assumed to be of photosynthetic origin (Carter 2009; Piperno, 2006) (Fig. 1a). Thus, phytC isotopic signa-tures (δ13C and14C) obtained from buried soils and sedimen-tary archives have been interpreted in terms of paleoenviron-mental changes (Kelly et al., 1991; Carter, 2009; McInerney et al., 2011), or used as a dating tool (McClaran and Umlauf, 2000; Piperno and Stothert, 2003; Parr and Sullivan, 2005; Piperno, 2006).
Motivated by anthropogenic emissions of carbon diox-ide (CO2)(Mauna Loa Observatory; NOAA-ESRL data at http://www.esrl.noaa.gov/) and their direct association with climate change, a set of recent studies has advanced the idea that many monocotyledonous crop species (bamboo, sug-arcane, maize, rice, etc.) as well as grasslands in general (among the largest ecosystems in the world – Suttie et al., 2005) may play a significant role in C sequestration through a newly evidenced mechanism: CO2biosequestration in grass
Figure 1. Sketch of (a) the conventional hypothesis of plant C
oc-clusion during silica precipitation based solely on atmospheric CO2
as a source, and (b) the emerging hypothesis of a dual origin (atmo-spheric CO2and SOM) for plant C (and phytC). Young and old soil
C distributed in leaf epidermis (green tissue) and phytoliths (illus-trated by the bilobate type shape outlined in black) are represented by black and orange dots, respectively, in the microscope diagram.
biosilica particles (Parr and Sullivan, 2005, 2011; Parr et al., 2009, 2010; Song et al., 2013, 2014; Toma et al., 2013). If correct, encapsulated atmospheric CO2 can be slowly and steadily accumulated in soils, with turnover times of the or-der of several hundreds to thousands of years (Parr and Sul-livan, 2005). Selective use of silica accumulator crops could further enhance this sequestration mechanism (Song et al., 2013).
However, the validity of these interpretations has recently been challenged. First, attempts to properly calibrate the geo-chemical signals borne by phytC were inconclusive (Wild-ing, 1967; Kelly et al., 1991; McClaran and Umlauf, 2000; Smith and White, 2004; Webb and Longstaffe, 2010). Sec-ond, differences in the efficiency of phytolith extraction pro-tocols may have contributed to inconsistencies and overes-timations in phytC quantification (from 0.1 to 20 % of phy-tolith d wt) (Corbineau et al., 2013 and references therein, Song et al., 2014 and references therein). Third, systematic offsets of phytC 14C ages relative to the 14C ages of the plant tissues from which phytoliths originate have been pub-lished (Santos et al., 2010, 2012a, b, 2016; Sullivan and Parr, 2013; Yin et al., 2014; Piperno, 2016). These offsets can be as large as hundreds to several thousands of years, regard-less of the chemical protocol used for phytolith extractions, indicating the presence of a secondary contributor of C to phytC. Together, these observations led to the hypothesis that a whole or a fraction of phytC may come from old soil C (Santos et al., 2012a) (Fig. 1b). Previous analyses of
macro-molecules embedded in phytoliths suggested a variety of or-ganic molecules (Bauer et al., 2011 and references therein), but there is no direct evidence that they are solely synthe-sized by the plant. Moreover, a recent Nano Secondary Ion Mass Spectrometry (NanoSIMS) investigation of phytC dis-tribution in the silica structure suggests that a significant part of phytC can be lost at the very first stage of phytolith disso-lution (Alexandre et al., 2015), thus dissociating the concept of phytC protection from phytolith stability.
Therefore, if the soil C to phytC hypothesis is definitively confirmed, it casts doubt on the efficiency of paleoenviron-mental reconstructions based on phytC as a proxy of plant C, and raises questions regarding the present estimates of crop and grasslands phytolith efficiency in sequestering at-mospheric CO2, as well as its assessment of long-term stabi-lization in soils based on fossil phytolith14C dating (decades versus hundreds, or thousands of years, as suggested by Parr and Sullivan, 2005). Additionally, confirmation of a dual ori-gin (soil organic matter (SOM) and photosynthetic) of phytC would open new questions regarding plant–soil interactions and SOM recycling, relevant for our understanding of the role of terrestrial ecosystems in the C cycle.
To unequivocally establish that a fraction of phytC is in-deed from soils, a robust data set is produced here by con-sidering and ruling out all other factors that can possibly bias the isotopic signatures of phytC. We reassess the old soil C contribution to phytC hypothesis (Santos et al., 2012a) on the basis of > 200 isotopic results (δ13C and/or14C) of phytoliths and associated materials (grass tissues, SOM frac-tions, amendments and hydroponic solufrac-tions, CO2 respired from substrates or extracted from air). Pure phytolith concen-trates were acquired from sets of above- and below-ground C manipulation experiments. Phytolith concentrates were ex-tracted using several protocols with different degrees of ag-gressiveness (Corbineau et al., 2013) in four different lab-oratories. Cutting-edge techniques assured phytolith purity, and multiple analyses of carbon isotope reference materials assured high quality and reproducibility of the isotopic re-sults. Furthermore, to establish a link between phytC hetero-geneity in the sense of molecular complexity and resistance to oxidation (labile vs. recalcitrant), we subjected duplicates of pure phytolith extracts to thermal treatments. The multi-methodology approach used in this study allows us to com-pletely address: (a) the anomalous14C results associated with phytC in the literature, (b) the implications of a soil C con-tribution to phytC for14C geochronology dates, and (c) the shortcomings of using phytC as an atmospheric CO2sink.
2 Material and methods
2.1 Samples
Our experimental design is based on a two-step process. First, in order to evidence whether the 14C signatures of
phytC are solely of photosynthetic origin, we select sam-ples from known-year specimens, and compare plant mate-rial grown under normal atmospheric CO2conditions to the artificially altered plant C isotope content of photosyntheti-cally assimilated depleted-14CO2from Free Air Carbon En-richment (FACE) experiments (Sect. 2.1.1). Second, we seek to establish a causal connection between soil C and phytC by selecting samples from plant material grown under nor-mal atmospheric CO2 conditions, but altered substrate car-bon pools (Sect. 2.1.2). In both cases phytC and an array of samples associated with it were selected.
2.1.1 Above-ground C manipulation experiments
The FACE experiments exposed the plants to elevated atmo-spheric CO2concentrations by continuously releasing CO2 through jets from tubes installed in the surroundings and within the enclosures of the cultivation plots. Target mixing ratios of atmospheric and geologic CO2were maintained on plots until leaves were senescent and/or ready for harvesting. Two grass species (Sorghum bicolor and Triticum
du-rum) were grown in two FACE experiments, respectively:
at the Maricopa Agricultural Center (University of Ari-zona, USA) in 1998–1999 (Ottman et al., 2001), and at the Genomics Research Centre of CREA (Consiglio per la ricerca in agricoltura e l’analisi dell’economia agraria) in Fiorenzuola d’Arda, Italy, in 2011–2012 (Badeck et al., 2012; http://centrodigenomica.entecra.it/research/ durumFACE). For each experiment, a plot cultivated un-der ambient atmospheric CO2 was compared to a plot cul-tivated under atmosphere enriched by 160–200 ppm in fos-sil hydrothermal CO2, and therefore free of 14C (Leavitt, 1994; Ottman et al., 2001; Badeck et al., 2012). In terms of stable isotopic labeling, at the sorghum site the enriched CO2 had a δ13C value of −40 ‰ from 1995 to 1998. This stronger isotopic label was obtained from a mixture of nat-ural CO2 from the Springerville, AZ, USA geologic wells with 15 % petroleum-derived CO2. During 1998–1999 only fossil hydrothermal CO2was used (δ13C = −4.36 ‰), while the background air δ13C was −8 ‰ (Leavitt et al., 2001). At the durum wheat site, the commercial fossil CO2 from the Rapolano Terme, Poggio S. Cecilia (Tuscany) well had a
δ13C of −6.07 ‰, which was slightly positive compared to the ambient CO2value of −8 ‰.
Two samples of mixed stems and leaves (∼ 100 g) were obtained from the sorghum site, while four separated sam-ples (300–400 g each) of stems and leaves were collected at the durum wheat site. Eight soil samples (∼ 5 g each) col-lected from the furrows of the sorghum plots at depths of 0– 15, 15–30, 30–45, and 45–60 cm were also obtained from the archives of the Laboratory of Tree-Ring Research, Univer-sity of Arizona, USA. While two soil samples were collected from the ongoing durum wheat experimental plots at a depth of 0–15 cm (∼ 15 g each) during plant biomass harvesting.
To determine the precise14C activity of the plant mate-rials, radiocarbon measurements were conducted before the phytolith extractions started. Since the commercial CO2used in both FACE enrichment sites was from a fossil source, its 14C signature as fraction of modern carbon (FmC or Fm14C; Stuiver and Polach, 1977) was close to zero. There-fore, the14C signature of the enriched CO2was highly de-pleted compared to ambient air, and the plant tissues were tagged accordingly. Radiocarbon signatures of the plant tis-sue yielded Fm14C values of 0.640 (∼ 3.6 kyr BP;14C years before present or 1950; UCIAMS53273 and 53274; Table S1 in Supplement) and 0.556 (∼ 4.7 kyr BP; UCIAMS109000 and 109001; Table S2 in Supplement) at the sorghum and durum sites, respectively. Alternatively, plant tissue from am-bient CO2plots was expected to yield the prescribed atmo-spheric14CO2values of the given year that the growing sea-son took place. At the sorghum site, the Fm14C value of the bulk biomass harvested at the ambient CO2 plot matched with the Fm14C value of the CO2of the year of harvest (e.g., Fm14C ≈ 1.097, equivalent to the atmospheric14CO2 signa-ture measured from clean air in 1999 – http://calib.qub.ac. uk/CALIBomb/ database and calibration software). This14C signature is higher than the present-day ambient CO2due to nuclear weapon tests carried out during the 1950s and 1960s (Levin, 1997; Levin et al., 2013). The nuclear weapon tests doubled the 14C content in the atmosphere, which created an isotopic chronometer (the14C bomb peak) during the last 60 years for all living organisms. At the durum wheat site, however, the14C signature of the biomass harvested at the ambient CO2plot was slightly depleted (Fm14C ≈ 1.017), as expected for CO2above urban areas in Europe in the early 2010s. For comparison, the 14C signature of atmospheric-clean CO2stations in Central Europe was Fm14C = 1.040 in 2012 (Levin, 1997; Levin et al., 2013).
2.1.2 Below-ground C manipulation experiment
The second experiment relies on the simultaneous response of phytC to different carbon amendment treatments of grasses grown under photosynthetic natural conditions (i.e., ambient CO2 air). Sorghum bicolor plants were grown out-doors in a ventilated area at the University of California, Irvine (UCI, USA), in six well-drained 40 L planters (A, B, C, D, E and F) filled with mineral substrates. Five of the planters were enriched with organic nutrients character-ized by a broad range of14C signatures (from bomb spiked to fossil – Tables 1 and 2), while the last contained an in-organic nutrient devoid of C as a control (Planter F). Al-though much concerning the direct root absorption of natural carbon remains unknown, beneficial responses of root and plant growth have been reported in association with the ad-dition of either inorganic carbon (Hibberd and Quick, 2002) and/or humic acids (Nardi et al., 2002). Consequently, we chose as substrate for Planter B, a natural carbonate-based sedimentary deposit mixed with organic carbon detritus of
equal/even-age. For Planter E, fossil humic acids (extracted from leonardite) were chosen as the OC source.
Plants were fed as needed solely with 2 L of ultra-pure wa-ter (Planwa-ter A), or with a combination of ultra-pure wawa-ter and their respective fertilizers and SiO2 providers (Planters B– F) at a concentration of 1 % (v/v) (Table 2). Additionally, the CO2in the air surrounding the planters was isotopically monitored by collecting air in evacuated 6 L cylinders for the duration of the experiment with the purpose of charac-terizing the local atmospheric CO2close to planters, and to serve as a reference for the 14C signatures expected from plant tissue organs. Also, we isotopically measured commer-cial (sorghum) seeds to check if their14C signatures were re-cent. Finally, CO2fluxes respired from the planter substrates were also sampled to evaluate their putative contribution to the phytC14C signature. After 3.5 months the Sorghum
bi-color plants (stem and leaf) were harvested in preparation for
phytolith extractions and isotopic analyses.
2.2 Laboratory procedures
2.2.1 Plant treatment and phytolith extraction
Stems and leaves samples (50–100 g each) were thoroughly rinsed with warm ultrapure water to remove air-dust, dried at 60◦C and ground using an industrial mill (IKA®M20 Uni-versal Mill). About 10 mg of each sample was kept for bulk tissue14C and δ13C analyses.
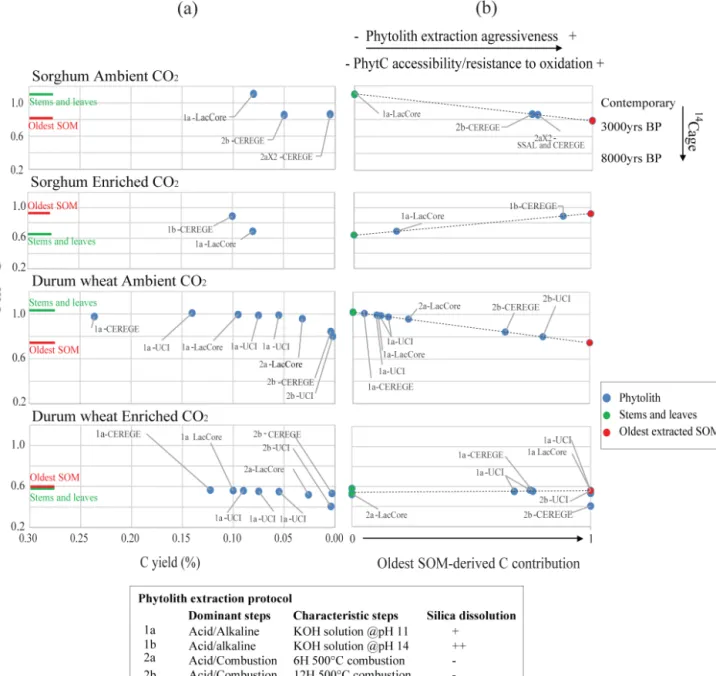
Four phytolith extraction protocols with increasing aggres-siveness (via organic compound oxidation and silica dissolu-tion) were used to treat the samples from the above-ground C manipulation experiment (Fig. 2). The protocols have been previously described in detail by Corbineau et al. (2013). They are based either on acid digestion and alkali or on multi-step dry ashing and acid digestion. They are summarized be-low and in Fig. 2.
Protocols 1a and 1b. Plant samples were subject to strong
wet-digestion steps in order to oxidize the organic matter (e.g., 1N HCl 2 h−1, hot H2SO424 h−1plus 30 % H2O2for 2–3 days, and > 65 % HNO3plus 1 g KClO3for 24 h). This was followed by 30 min of immersion in KOH solution at pH 11 (protocol 1a) or pH 13 (protocol 1b). The KOH im-mersions allowed final removal of any alkali-soluble forms of organic compounds remaining on phytolith surfaces.
Protocols 2a and 2b. Plant samples were subjected to
dry-ashing. Stepwise increases in temperature were used from 300 to 500◦C and the samples were then kept at 500◦C for
6 h (protocol 2a) or 12 h (protocol 2b). Samples were then digested in a > 65 % HNO3and 70 % HClO4mixture (2 : 1). In order to assess local14C contamination during chemi-cal extractions, four laboratories were involved in the extrac-tions. They are UCI (USA), CEREGE (CNRS, AIx-Marseille University, France), the Soils and Sediments Analysis Lab (SSAL, the University of Wisconsin-Madison, USA), and the National Lacustrine Core Facility (LacCore, the
Univer-sity of Minnesota, Twin Cities, USA). Aliquots of pre-baked (900◦C 3 h−1) silicon dioxide powder (SiO
2;mesh# −325, Sigma Aldrich, St. Louis, MO, USA) were chemically pre-treated in parallel with the plant samples, and later analyzed as phytolith extract to provide independent blank data for each laboratory following the procedures described in San-tos et al. (2010).
Due to the limited amount of plant biomass produced by the below-ground C manipulation experiment (Sect. 2.1.2), only two protocols were tested (1a and 2b) at only three of the laboratories (UCI, CEREGE, and LacCore), followed by blank sample materials as required.
2.2.2 Soil extraction fractions
Soils from the above-ground C manipulation experiment were physically cleaned of roots and stones. The bulk SOM fraction was isolated after carbonate removal in 1N HCl baths at 60◦C. The refractory (alkali-insoluble) fraction was further isolated via multiple baths in 1M NaOH at 60◦C, fol-lowed by 1N HCl rinses (Santos and Ormsby, 2013). Upon chemical treatment, samples were adjusted to pH neutral and dried in a vacuum oven (Savant RT 100A refrigerated vapor vacuum pump system).
Amendments from the below-ground C experiment were not subject to any chemical pretreatment, except for the tests performed to small aliquots of greensand (GS, Table 1), al-lowing us to isolate the organic fraction from its bulk mix-ture.
2.2.3 CO2flux measurements
In the frame of the below-ground C manipulation experi-ment, the rate of CO2respired from Sorghum bicolor foliage (after sprouting), root systems and substrate was measured using closed dynamic soil CO2 flux chambers (Czimzik et al., 2006). Chamber headspace gasses were circulated through an infrared gas analyzer (840, 1400, LI-COR, Lin-coln, NE, USA), for 6 min at 0.5 L per minute, and the CO2 concentration was recorded every second. Once headspace CO2 concentrations reached twice that of ambient-air, the CO2was collected in a molecular sieve trap for isotopic anal-ysis, followed by ambient-air samples to serve as references.
2.3 Analytical procedures
2.3.1 Phytolith concentrate purity analysis
Small particulate organic contamination of phytolith concen-trates may considerably bias isotopic and quantitative anal-yses of phytC. The purity of the phytolith concentrates was thus verified by Scanning Electron Microscopy with Energy-dispersive X-ray spectroscopy (SEM-EDS) (Corbineau et al., 2013). Extracted phytoliths, mounted directly on pre-cleaned aluminum stubs, were analyzed with a Schottky Thermal Field Emission FEI/Philips XL-30 SEM with back-scattering
Figure 2. Above-ground C manipulation procedure. (a) Averaged Fm14C values versus averaged phytC yields (or concentration in % of phytoliths). Constant solid lines correspond to the averaged Fm14C values obtained for stems and leaves (SL) of origin and the oldest extracted SOM fraction. (b) Oldest SOM-derived C contribution to phytC calculated using the mixing equation (Eq. 1) presented in the text expressing the14C signature of phytC as the result of mixing between the C derived from plant photosynthesis and the C derived from the oldest extracted SOM fraction. Phytolith samples are labeled according to the extraction protocol (1a, 1b, 2a, 2b described in caption and in the text) used and the laboratory of extraction (UCI, CEREGE, LacCore and SSAL).
electron detector. EDS semi-quantitative analyses of C and Si were obtained from 10 to 30 µm locations on selected particles. Special attention was paid to organic-like particles showing tissue-like or non-phytolith morphologies. A total of ∼ 30 analyses per sample were made. Samples with all C : Si peaks area ratios < 0.1 were reported as devoid of or-ganic particles. The equal/even accuracy and precision of the EDS analyses were evaluated by multiple measurements of a silicon carbide (SiC) standard (#9441, Micro-Analyses
Con-sultant Instrument Ltd, St Ives, UK): mean value of C : Si M = 1.17; standard deviation SD = 0.02 (n = 21).
2.3.2 Stable isotope analysis
Stems/leaves, SOM fractions, nutrients/fertilizers and phy-tolith samples were analyzed for their total C content and stable C isotope ratio (δ13C) using a continuous flow stable isotope ratio mass spectrometer (Delta-Plus CFIRMS)
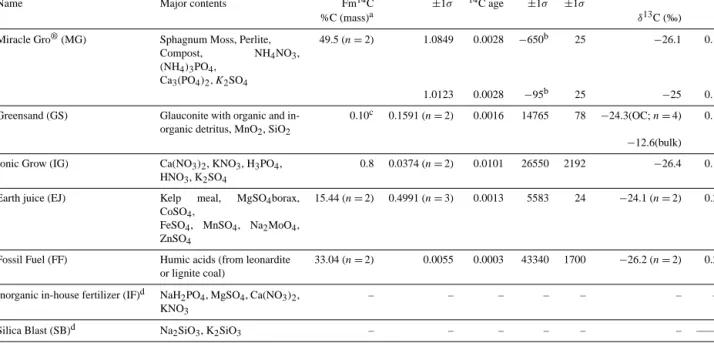
inter-Table 1. Below-ground experiment. Details of substrate amendments, their carbon content, radiocarbon values (as Fm14C and14C age) and C isotopic signatures.
Name Major contents Fm14C ±1σ 14C age ±1σ ±1σ
%C (mass)a δ13C (‰)
Miracle Gro®(MG) Sphagnum Moss, Perlite, Compost, NH4NO3,
(NH4)3PO4,
Ca3(PO4)2, K2SO4
49.5 (n = 2) 1.0849 0.0028 −650b 25 −26.1 0.1
1.0123 0.0028 −95b 25 −25 0.1 Greensand (GS) Glauconite with organic and
in-organic detritus, MnO2, SiO2
0.10c 0.1591 (n = 2) 0.0016 14765 78 −24.3(OC; n = 4) 0.1
−12.6(bulk) Ionic Grow (IG) Ca(NO3)2, KNO3, H3PO4,
HNO3, K2SO4
0.8 0.0374 (n = 2) 0.0101 26550 2192 −26.4 0.1
Earth juice (EJ) Kelp meal, MgSO4borax,
CoSO4,
FeSO4, MnSO4, Na2MoO4,
ZnSO4
15.44 (n = 2) 0.4991 (n = 3) 0.0013 5583 24 −24.1 (n = 2) 0.2
Fossil Fuel (FF) Humic acids (from leonardite or lignite coal)
33.04 (n = 2) 0.0055 0.0003 43340 1700 −26.2 (n = 2) 0.2
Inorganic in-house fertilizer (IF)d NaH2PO4, MgSO4, Ca(NO3)2,
KNO3
– – – – – – –
Silica Blast (SB)d Na2SiO3, K2SiO3 – – – – – – ——
a
Total percentage of carbon was determined by manometric measurements of CO2after combustion of solids. Those values are estimates only, as they do not take in account volatile organic C losses during the drying procedure of the amendments as solutions;bnegative14C ages are associated with material that fixed C during the post-nuclear testing period (e.g., 1950 to the present);cGS %C is based on its total C
amount by d wt, with 0.06 % of it constituted of organic matter detritus with the remaining C pool from marine carbonates. %C estimates of independent fractions were based on stable isotopic measurements of bulk and HCl treated (OC fraction) subsamples (Sect. 2.2.2). Nevertheless, the FmC14C values of the organic C and bulk fractions are similar, and are shown here as an average value. The δ13C values of both fractions
are shown as reference;dattempts to produce CO2from solids (upon freeze-drying) confirmed the absence of C in those amendments, and therefore those are not shown.
Table 2. Below-ground experiment. Planters’ major features: substrates and amendments, living plant appearance, biomass by d wt and
phytolith yields. All nutrients and fertilizers were administered in aqueous solutions, except for MG. In bold: main amendment.
Planters
A B C D E F
Substrate MG GS Baked Sand Baked Sand Baked Sand Baked Sand Amendments In MG In GS, IGa IGa EJ, IFb FF, IFb IFb
Silica Provider In MG In GS SB SB SB SB Appearance Dark green Dark green Dark green Green Yellowish green Green Biomass (g) 98.57 79.09 89.24 86.67 54.78 53.37 Phytolith yieldc 0.12 0.78 0.83 0.83 1.77 1.35
aIG has a very low %C. Therefore, its C contribution to planters B and C after dilution into solution (e.g., ∼ 0.02 g of C per feeding) was found to
be very small, a conclusion supported by isotopic analyses (Table S3);bIF (which does not contain measurable amounts of C) was added to those planters to supply micronutrients to support plant growth;cas % of dry leaf and stem biomass combined.
faced with a Fisons NA-1500NC (for solid materials) and a Gasbench II (for CO2input).
About 10 mg of phytoliths and 25 mg of soil were weighed out into pre-baked (100◦C per 2 h) tin capsules (5 × 9 mm capsules from Costech Analytical Technologies Inc., Valen-cia, CA, USA) using a pre-calibrated microbalance (Sarto-rius AG, Göttingen, Germany). For accurate integration and calibration of carbon peaks of phytolith samples (∼ 0.1 % C), measurements were obtained by decreasing the helium carrier flow rate, and by measuring several size-matched aliquots of standards from the National Institute of Standards Technology. Aliquots of SiO2 blanks and fossil phytoliths (MSG70) used as an internal standard at CEREGE
(Alexan-dre et al., 2015; Crespin et al., 2008) were included for background corrections and accuracy (Santos et al., 2010), respectively. For the bulk tissue samples, aliquots of CO2 gas were recovered after combustion, and sent to CFIRMS, which has a typical precision of 0.1 ‰. Stable isotope results are reported as δ values in ‰ relative to the Vienna Pee Dee Belemnite (vPDB).
2.3.3 Radiocarbon analysis
Stems/leaves, SOM fractions, nutrients/fertilizers, CO2 and phytolith samples were processed for14C accelerator mass spectrometry (AMS) analyses. About 2 mg of plant
tis-sue, 20–100 mg of SOM and 15–300 mg of phytoliths were loaded for tube-sealed combustion (Santos et al., 2004). To avoid CO2adsorption on phytolith surfaces, the loaded sam-ples were kept and transferred warm (at 160◦C) to the evac-uated line for sealing (Santos et al., 2010). Liquid solutions were freeze-dried directly into tubes prior to combustion. At-mospheric CO2was extracted from 6 L collection flasks of whole air, by attaching the flasks to an evacuated line. A similar procedure was used to recover the CO2 collected in molecular sieve traps (from flux chambers). Once the CO2 was cryogenically separated from other gases, it was then transferred to a Pyrex tube at a flame-off port and sealed (Santos et al., 2010). Samples of CO2from tube-sealed com-bustions, flasks and traps were cryogenically isolated, and reduced to graphite (Santos et al., 2007; Xu et al., 2007), or transferred to Gasbench II CFIRMS for isotopic analysis.
The 14C measurements were performed at the Keck-CCAMS Facility (UCI). Precision and accuracy in measure-ments on > 0.7 mg of near-modern carbon samples are typ-ically 0.2–0.3 % (Beverly et al., 2010), and 1 % on samples in the 0.01 mg C range (Santos et al., 2007). The instrument provides the isotopic ratio13C /12C, allowing for fractiona-tion effects (either spectrometer induced or arising from bio-chemical processes) to be corrected for all targets measured. Blanks from SiO2 aliquots were also measured to pro-vide background corrections. All labs and extraction proto-cols showed similar procedural blanks (∼ 0.003 mg of mod-ern C and ∼ 0.002 mg of14C free1. Those values were sub-tracted from the14C data, including the results obtained from the MSG70 reference material, for accuracy. Details on such background subtractions can be found elsewhere (Santos et al., 2010). Radiocarbon results were expressed as Fm14C and when appropriate were discussed as ages.
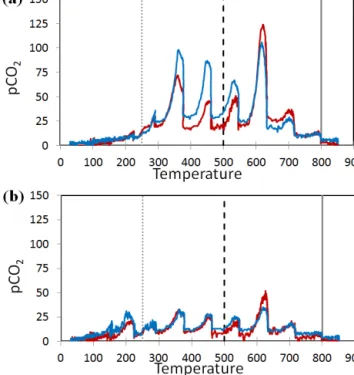
2.3.4 Thermal analysis
We performed thermal analysis of phytoliths on a modified Thermal-Optical Carbon Aerosol Analyzer (RT 3080, Sunset Laboratory Inc.) (Bae et al., 2004). Phytolith concentrates of 7–10 mg were loaded onto a customized spoon (Jelight Com-pany, Inc. USA), placed into the instrument and kept at 50◦C for ∼ 10 min for surface cleansing. The stepwise temperature ramp started at 50◦C and ended at 850◦C 50 min later. Pure oxygen (65 mL min−1) was used to avoid refractory carbon (char) formation. The CO2evolved was injected into a man-ganese dioxide oven at 870◦C, and later quantified by a non-1The term14C free is used in association with materials from
which the original14C radioisotope content has been reduced to zero or close to zero. However, those materials obviously continue to maintain their stable amounts of12C and13C. Consequently, the addition of14C free (or organic carbon from subfossil14C signa-tures) to pools of C containing present-day atmospheric CO2signals
will lower the overall14C signature of the pool. For each 1 % fossil C present, an offset of 80 years is expected (Santos et al., 2016, and reference therein).
dispersive infrared detector. Typical multi-point calibration curves, when analyzing known quantities of C ranging from 2–120 µg, yielded correlation coefficients greater than 0.998. Two phytolith samples were analyzed. Durum wheat leaf phytoliths extracted using protocol 1a, and MSG70, made of highly weathered fossil phytoliths (Alexandre et al., 2015; Crespin et al., 2008).
3 Results and discussions
3.1 Isotopic results from above-ground C manipulation experiments
A total of 21 individual phytolith concentrates were pro-duced for the above-ground experiments by all laboratories involved in this project. Those samples are tabulated in the Supplement (Tables S1 and S2), followed by details on the sample processing (protocols, laboratory and measurement identifiers). Note that when sufficient plant material was available (which was the case for the durum wheat samples) some labs could replicate the extraction (i.e., processing the same pool of biomass following the same protocol).
From those 21 phytolith concentrates, 5114C results were produced to determine the phytC14C signatures (number of targets includes duplicates and/or replicates, as specified in Tables S1 and S2). Two phytC14C targets from MSG70, a fossil phytolith internal standard at CEREGE, were also pro-duced to evaluate measurement reproducibility. Overall, the precision and accuracy of the phytC14C data were better than 0.3 %, based on duplicates and triplicates of graphite sam-ples > 0.5 mg C. For the smaller sized samsam-ples, 1 % or bet-ter were recorded in most cases, even afbet-ter background cor-rections based on measurements of multiple SiO2 aliquots were propagated into individual uncertainties (Tables S1 and S2). We have not identified significant differences in inter-laboratory analyses when using the same protocol on sub-samples of the same biomass sample, and/or when evaluating procedural blank materials (added to every batch analyzed – details in Sect. 2.3.3). To help with determining the phytC carbon sources, other14C results shown in Tables S1 and S2 are from the stems/leaves and SOM fractions (e.g., the car-bon pools associated with the labile-accessible and recalci-trant (alkali-insoluble)).
PhytC concentrations were consistent for a given extrac-tion method but showed a clear decreasing trend with in-creasing protocol aggressiveness. The phytC yields (phytC % relative to the d.wt of phytoliths) averages ranged from 0.24– 0.06 % for the less aggressive protocols 1a and 1b and from 0.05 and 0.002 % for the more aggressive protocols 2a and 2b (Fig. 2a, and Tables S1, S2).
Phytoliths extracted from either sorghum or durum wheat using protocol 1a produced phytC14C signatures closest to the values of the stems and leaves of origin regardless of air CO2concentration (ambient vs. enriched CO2)and grass
species (Fig. 2b). However, phytC14C offsets were still ev-ident when compared to the expected values given the year of harvest or artificial tagging (Table S1). For sorghum, ab-solute offsets varied from 85 (UCIAMS123579 and 123580) to 610 years (UCIAMS123577 and 123578) when using pro-tocol 1a. The maximum offset increased when using proto-cols 1b (2633 years; UCIAMS95338), 2a (1920 years; UCI-AMS130339), and 2b (1990 14C years; UCIAMS95335 to 95337). Durum wheat ambient phytC 14C absolute offsets varied from 105 (UCIAMS123572) to 1925 years (UCI-AMS125986), while phytC offsets from enriched plots var-ied from 310 (UCIAMS123570 and 123571) to 2885 years (UCIAMS125983).
The hypothesis that there is a contribution of SOM-derived C to phytC was tested estimating phytC as a mixture of (i) C derived from plant photosynthesis and (ii) C derived from the oldest SOM fraction measured. The mixing equation is Oldest SOM-derived C contribution =
(Fm14CphytC−Fm14CSL)/(Fm14CSOM−Fm14CSL) (1) where the14C signatures of the oldest SOM, stems and leaves (SL) and phytC are expressed as Fm14CSOM, Fm14CSL and Fm14CphytC. Fm14CphytC was expressed relative to Fm14CSOM(assigned a contribution value of 1) and Fm14CSL (assigned a contribution value of 0). The average Fm14C value of the oldest SOM-C fractions measured in each exper-iment (i.e., the Fm14C average value of the SOM 45–60 cm fraction for S. bicolor plots – Table S1 in Supplement, and the refractory 0–15 cm fraction for T. durum plots – Table S2) were used for Fm14CSOM.
The mixing curves associated with the SOM-derived C to phytC hypothesis are presented in Fig. 2b. The Fm14C values of two phytC samples from the Sorghum Ambient CO2 ex-periment obtained using protocol 1a (UCIAMS123579 and 123580) and one phytC sample from the Durum Wheat En-riched CO2 experiment obtained using protocol 1b (UCI-AMS130339) were higher than Fm14C values of the stems and leaves of origin, indicating that the soil pool still has remnants of14C-labeled OC from the 1950s thermonuclear tests (Levin, 1997; Levin et al., 2013). In this case the SOM-derived C was assigned a contribution value of 0, and the stems and leaves a contribution value of 1 in Fig. 2b. Con-versely, some of the phytC Fm14C values from the Du-rum Wheat Enriched CO2 experiment, obtained using pro-tocols 1a, 2a and 2b (UCIAMS123566, 123567, 125985, 130334 and 130335), were lower (14C age older) than the Fm14C value of the oldest SOM fraction or 1 in Fig. 2b. This pattern suggests that the so-called oldest SOM fraction, which is a mixture of old and young SOM (Schrumpf et al., 2013) may still be “younger” than present-day in terms of its 14C signatures, if the soil C pool is still bearing some bomb-produced 14C OC, or much older if aromatic com-plexes are dominant (Telles et al., 2003; Torn et al., 2009). For the sorghum experiment this trend was particularly
ob-vious, as the ambient CO2 and the upper soil layers were clearly imprinted with bomb14C (Levin, 1997). Therefore, Fig. 2b clearly showed that the phytC Fm14C values unam-biguously trend toward the Fm14C value (or14C age) of the oldest SOM fraction. Overall, the crucial point to be no-ticed is that the phytC14C offsets shifted linearly towards negative values if the oldest SOM fraction was older than the biomass of origin (Sorghum Ambient and Durum Wheat Ambient, Fig. 2a), and towards positive values when the old-est SOM fraction was younger (Sorghum Enriched, Fig. 2a). Thus, phytC14C differences were clearly linked to the oldest SOM14C ages. Moreover, the agreement in phytC14C val-ues obtained from stems and leaves indicated that the offsets were not linked to plant anatomy.
Regarding δ13C values, the phytC offsets relative to the tissue of origin did not systematically trend towards SOM
δ13C values, except for the Sorghum Ambient phytC under-going the 2b protocol (−21.6 ± 0.1 ‰ (n = 2) as indicated in Fig. 3; UCIAMS95335 and 95336). As described earlier, this protocol tends to isolate the most recalcitrant phytC fraction. The difference between phytC δ13C values of durum wheat and sorghum was higher (∼ 15.7 ‰) than the difference be-tween δ13C values of the stems and leaves of origin (e.g.,
∼5.6 vs. ∼ 7.2 ‰ for wheat and sorghum, respectively), as previously reported for grasses with C3 and C4 photosyn-thetic pathways (Webb and Longstaffe, 2000, 2010). Without further discrimination of the molecular composition of SOM-derived C absorbed by the plant roots, in-depth discussion of the δ13C differences between phytC and plant biomass is dif-ficult. Nevertheless, the observed differences between phytC and stems and leaves δ13C values were consistent with pre-vious calibration studies, and were explained by preferen-tial occlusions of plant molecular13C-depleted compounds in phytoliths (Webb and Longstaffe, 2010).
3.2 Isotopic results from below-ground C manipulation experiments
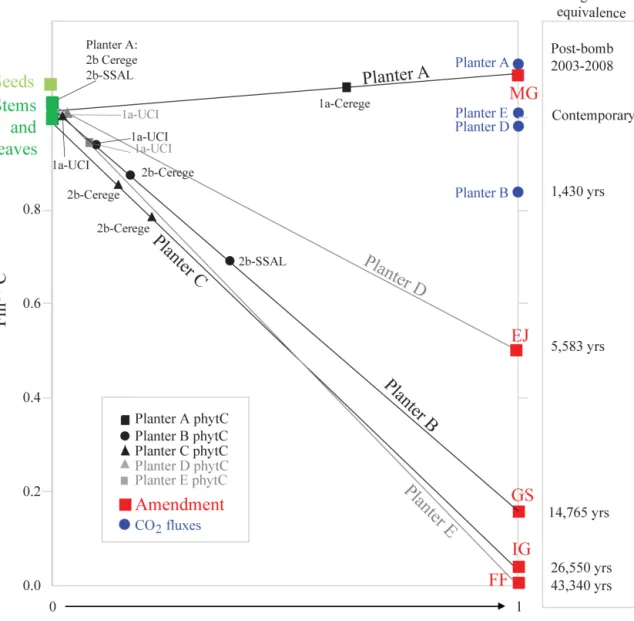
A total of 12 individual phytolith concentrates and phytC 14C targets were produced for the below-ground experi-ments, two of those from the same biomass samples (from Planters A and C), but subjected to different degrees of oxidation (e.g., protocol 2b). Other 14C results shown are from the stems/leaves, nutrients/fertilizers, and CO2 ex-tracted from 6 L flasks and flux chambers (Fig. 4). The com-plete set of isotopic results and sample processing details are tabulated in the Supplement (Tables S3).
Phytoliths produced phytC yields ranged from 0.08 to 0.1 % d wt when using the less aggressive protocol 1a and from 0.01–0.04 % d wt when using the more aggressive pro-tocol 2b (Table S3).
Significant offsets of the phytC 14C values relative to the stem and leaf Fm14C values were again found in as-sociation with the carbon sources in the soils (e.g., sub-strates/amendments). The highest phytC14C offset of 3610
Figure 3. Above-ground C manipulation experiment. δ13C values of stems and leaves, phytC, and soil SOM fractions obtained for (a) sorghum and (b) durum wheat experiments. To facilitate comparisons between groups, samples from ambient and enriched CO2plots are
plotted next to each other. Values are reported as per mil (‰) related to PDB. Results of the bulk and refractory SOM fractions were averaged; consequently results and uncertainties indicate multiple data points. Individual results are shown in Tables S1 and S2.
years (UCIAMS104366) was obtained from the phytC 14C from Planter B when using protocol 2b, showing again that the increased age discrepancies were due to protocol aggres-siveness (e.g., from 1a to 2b). The effect is also observed in the phytoliths associated with Planter C, which received very low amounts of below-ground organic carbon relative to all other treatments (Tables 1 and 2). Specifically, the Planter C phytC14C offsets increased from 160 (UCIAMS130346; protocol 1a) to 1150 (UCIAMS104362; protocol 2b), and to 1760 years (UCIAMS104900; protocol 2b).
Even when we processed biomass samples from all Planters following the same protocol (such as the less ag-gressive 1a protocol),14C age discrepancies between phytC and the plant of origin were highly evident, and correlated to the 14C signatures of amendments (UCIAMS130344 to 130348). PhytC 14C offsets were greater for amendments containing sufficient amounts of C of extreme14C-signatures (e.g., positive 320 years to Planter A, and negative 680 years to Planter E in Table S3). Note that the Planter A substrate was composed of rich bulk-complex OC imprinted with14 C-bomb values (or Fm14C signatures higher than present-day values), while the Planter E substrate received a solution of fossil OC (Fm14C = 0; close to ∼ 43 kyr BP; n = 3) (Tables 1 and 2). As in the above C manipulation experiment, in Fig. 4 we assigned values of 0 and 1 to the Fm14C associated with stems and leaves of origin and amendments, respectively (Ta-ble S3), and used the same mixing equation (Eq. 1).
The bulk stems and leaves produced Fm14C signatures that were very similar to the local ambient air14CO2values col-lected in the 6 L cylinders during the growing season,
exclud-ing any possibility that the phytC14C depletions are a prod-uct of urban fossil atmospheric CO2fixation. The small dis-crepancies between the stem and leaf14C values (e.g., from 25 to 65 years) (Table S3) are attributed to heterogeneities in C distribution within plant cells during C fixation (Pausch and Kuzyakov, 2011; Wichern et al., 2011). The commercial seeds of sorghum were also measured by14C-AMS (Fig. 4) to verify their recent radiocarbon activity (UCIAMS83120 and 83121; Table S3). As expected, once early-fixed pho-tosynthetic CO2 became dominant, remobilized 14C from seeds made little contribution to mature biomass tissue.
Although Fm14C values of substrate CO2 fluxes were depleted towards amendment 14C bulk signatures (UCI-AMS83842 to 83845, Table S3), soil CO2 plant tissue re-fixation via photosynthesis (and its influence on phytC) was found to be negligible, and cannot be invoked to explain the anomalous phytC14C results. CO2fluxes from the planters’ substrates upon sprouting varied from 0.34 to 1.72 ppm s−1 (≈ 10−5g m−2yr−1) (Table S3), indicating very little micro-bial activity. For comparison, global soil CO2 fluxes vary from 60 to 1000 g m−2yr−1(Raich and Sclesinger, 1992).
δ13C offsets between phytC and stems and leaves were
∼6.5 ‰ on average, including the phytC from Planter B (which contain a mixed C pool of OM detritus of plant origin and carbonate deposits – Table 1), showing that the inorganic fraction of the soil C was not a significant source of phytC (Fig. 5). Also in Fig. 5, we show the stable isotopic signa-tures of the CO2fluxes (UCIAMS83842 to 83845; Table S3) collected using closed dynamic soil CO2flux chambers (Cz-imzik et al., 2006). The results fell mostly between the air
Figure 4. Below-ground C manipulation procedure: oldest amendment-derived C contribution to phytC calculated using the mixing equation
(Eq. 1) presented in the text expressing the14C signature of phytC as the result of mixing between C derived from plant photosynthesis (seeds, stems and leaves represented by the green squares) and C derived from the oldest amendment (MG, EJ, GS, IG, FF defined in Table 1 and represented by the red squares). Phytolith samples are labeled according to the phytolith extraction protocol used (1a and 2b) and the laboratory of extraction (UCI, CEREGE and SSAL). Selected age benchmarks from substrate amendments and soil CO2fluxes are shown
for reference on the right axis.
and bulk plant tissue averages, as expected for CO2 pro-duced from above- and below-ground biomasses, supporting our previous observations of negligible effects of soil CO2 respired to phytC.
This data set clearly shows that amendment-derived C, ad-sorbed through root plants, altered the phytC14C signatures.
3.3 Thermal stability of phytC
Chemical compositional insights on carbonaceous materi-als can be obtained via oxidation reactivity to thermal
treat-ments; such treatments have been frequently used on organic compounds from soils and sediments (Plante et al. 2011, 2013; Rosenheim et al., 2013). For instance, single-bonded carbon structures usually show a lower thermal stability than those dominated by double bonds, such as conjugated and aromatic structures (Harvey et al., 2012). Here, we make use of the same chemical-thermal stability concept to evaluate the heterogeneity of phytC in reacting to heat treatments.
Thermograms obtained from phytoliths of the durum wheat leaves and fossil phytoliths (MSG70) indicated a con-tinuum of phytC CO2 with different degrees of resistance
Figure 5. Below-ground C manipulation experiment. δ13C values of the respired CO2, stems and leaves, amendments and phytC for
the five planters enriched in organic carbon nutrients (A–E). Values are reported as per mil (‰) related to PDB, and individual symbols represent single results as reported in Table S3. For Planter B we report two values, its OC fraction (−24.3 ‰) and its bulk fraction (−12.1 ‰ – a mixture of OC and inorganic carbon) (Table 1). Con-stant solid lines correspond to the average δ13C values of ambient-air CO2and bulk plant tissues.
or accessibility (Fig. 6). Although the overall production of CO2 was lower for MSG70, the continuum temperature-dependency pattern of phytC was preserved. For example, at 250◦C both phytolith extracts produced CO2, however the leaf phytoliths show lesser amounts of CO2evolved than soil phytoliths. At 500◦C half of the phytC CO
2in both samples has been evolved, and at 800◦C all of the phytC has been
completely removed.
Phytoliths typically melt at ∼ 573◦C (Deer et al., 1992), but embedded metals (e.g., Al, Fe) within their structures could lead to a decrease in temperature stability (Wu et al., 2014). Nevertheless, phytC that required much higher tem-peratures to fully oxidize (e.g., beyond of the phytolith melt-ing point of 573◦C) would be placed at the upper end of the carbon recalcitrance continuum. (Cheng et al., 2013; Harvey et al., 2012; Plante et al., 2005, 2011, 2013). Furthermore, even if char occurred during combustion leading to some elemental carbon formation, it does not explain the Fm14C phytC discrepancies obtained here (Figs. 2 and 4) or else-where (Santos et al., 2010, 2012a, b; Sullivan and Parr, 2013; Yin et al., 2014).
Santos et al. (2012a) and Yin et al. (2014) also heated phy-tolith aliquots from a single extract, and observed shifts in 14C ages towards older values. This effect is similar to that observed in total carbon or SOM distributions in soils and sediments when subject to thermal decomposability (Plante et al., 2011, 2013). Thus, phytolith extractions that employ heat treatments would better isolate the oldest soil C frac-tion within phytoliths, as previously found (in Sects. 3.1. and 3.2). Basically, if the C pool in phytoliths is supposedly
ho-Figure 6. Thermograms (n = 2; blue and red lines) of phytoliths
obtained from (a) durum wheat leaves, phytoliths extracted follow-ing protocol 1a (Table S2), and (b) soil phytoliths MSG70 extracted using a conventional protocol adapted to soil and sediment materi-als. Peaks are artifacts of the 100◦C temperature-step increments. Vertical lines indicate main temperature thresholds, as explained in the text.
mogeneous and from a single source (atmospheric CO2), the 14C results from all CO
2temperature-fractions should be in absolute agreement, as Fernandez et al. (2015) demonstrated by subjecting carbonaceous materials to ramp pyrolysis and subsequently measuring them by14C-AMS.
3.4 The SOM-derived C to phytC hypothesis set of evidence
Results from both above- and below-ground experiments showed that the14C offsets between phytC and stems and leaves pointed toward the oldest SOM14C values (Figs. 2 and 4). This confirmed that a fraction of the old SOM-derived C occluded in phytoliths was more resistant (or less accessible) to oxidation than the occluded C derived from recent photo-synthesis or from recent SOM. Once the most labile (or more accessible) C had been removed, the older and more resistant carbon fraction became dominant. This behavior mirrors that in a recent study showing an increase in14C age offsets of phytoliths with increasing combustion temperature (Yin et al., 2014), and also the thermal decomposability pattern il-lustrated in the phytC thermograms (Fig. 6).
Our findings also imply that a portion of SOM-derived C is absorbed by the roots, transferred to the stems and leaves, and finally occluded into phytoliths. In the bulk plant organs,
the old SOM-derived C amount is far too small to be14C de-tected in tissue clippings, as it is masked by the large amounts of photosynthetic atmospheric carbon tissue (bulk stems and leaves averaged ∼ 41 % carbon; Tables S1–S3). On the other hand, in phytoliths, the old SOM-derived C becomes over-represented when the most labile-accessible phytC starts to be oxidized. It should be noted that the14C ages of the old-est SOM fraction are averaged bulk values that do not yield any precise assessment of the fine-scale 14C age of the C that may have been absorbed. These drawbacks prevent pre-cise quantification of the old SOM (probably diluted by the young SOM)-derived C contribution to phytC. The impos-sibility of quantifying precisely the amounts of soil C and associated 14C signatures in phytC precludes application of any correction that would allow phytC to be used as a reli-able dating material. As in any other heterogeneous carbon pool, the phytC continuum can be similarly partitioned dif-ferently by distinctive chemical extractions. For instance, in Piperno (2016) the entire data set of post-bomb Neotropi-cal plant phytolith extracts were neither accurate nor precise. While 14C offsets reached discrepancies as high as 4.4 kyr between expected calendar ages and phytC, two pairs of phy-tolith extracts obtained by distinct chemical treatments (sul-furic vs. nitric) yielded a 50 % reproducibility rate (Table 1, Santos et al., 2016).
Recent 3-D x-ray microscopy and NanoSIMS measure-ments of a phytolith sample from the Durum Wheat Enriched CO2experiment (TD-F-L/1a-CEREGE, Table S1) (Alexan-dre et al., 2015) suggested two locations for phytC: in micro-metric internal cavities and within the silica network. Rapid opening of internal cavities during the dissolution process resulted in losses of phytC found in these locations, which is expected when phytoliths are subject to rapid oxidation. Conversely, phytC in the silica network is homogeneously distributed at the micrometric scale, and is less accessible to oxidation. These two pools of phytC may account for the het-erogeneity of phytC accessibility to oxidation.
3.5 Rebuttals to possible arguments against the SOM-derived C contribution to phytC hypothesis
Our experiments and data set allow the rejection of several hypotheses for the “anomalously” old 14C ages for phytC. First, bias due to exogenous C contamination during the phy-tolith extractions performed simultaneously by several labo-ratories and artifacts of errors in background corrections are highly unlikely. In these cases the14C offsets would trend in a single direction, rather than being both positive and neg-ative (Figs. 2b and 4). In addition, aliquots of SiO2 blank yielded14C values in close agreement with the expected re-sults, giving no indication of the presence of unusual contam-inants. Second, natural- or spectrometer-produced anoma-lous δ13C shifts of phytC were not observed here (Figs. 3 and 5) nor elsewhere (Santos et al., 2010, 2012b; Sullivan and Parr, 2013). Third, contributions of soil-respired CO2to
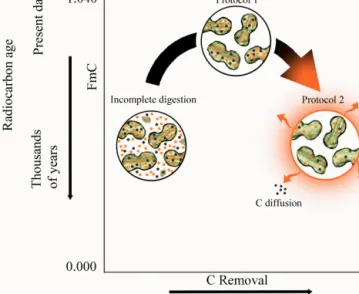
ma-Figure 7. Conceptualization of the impact of phytolith extraction
aggressiveness and C removal on14C age of phytoliths. Incomplete digestion leads to an accumulation of old residual OM in phytolith concentrates. Protocol 1 removes all OM residues and better pre-serves the dual source phytC signature. Protocol 2 removes all resid-ual OM and labile (intrinsically young) phytC. For illustration pur-poses, young and old C are represented by black and orange dots, respectively (see Fig. 1b).
ture plant tissue (and phytC) were also negligible (Sect. 3.2). Fourth, phytC14C results were not biased by organic matter residues, as the efficiency of the phytolith extraction proto-cols was fully checked by SEM-EDS analyses (e.g., accep-tance threshold of C : Si ≤ 0.1 of 30 frames or more) (Cor-bineau et al., 2013), a method superior to microscopic eval-uation alone (Figs. S1 and S2 in Supplement) (Kameník et al., 2013; Santos et al., 2012a). Moreover, our extracts were consistently reproducible regarding phytC yields across all labs involved (Tables S1–S3) and thermal decomposability properties (Fig. 6). Since it has been established that plants do not photosynthesize all carbon found within their tissues (details in Sect. 3.8), the uptake of SOM-derived C via the root system and its allocation to phytC is the only plausible explanation for the phytC14C offsets.
3.6 Implications for the use of phytC as a proxy of plant C
Since plants (and more specifically phytoliths) contain a broad continuum of C with a complex mixture of chemi-cal compounds of different turnover times as evidenced here (Figs. 2, 4, and 6), we believe that insufficient to exces-sive oxidations can result in wild moves in phytC14C dates from thousands, to hundreds, to back to thousands years old (Fig. 7).
While pure phytoliths produced from a less aggressive protocol (e.g., 1a) may minimize 14C offsets to some
de-gree, two factors remain that may explain the anomalous thousands of years old age of phytC indicated in the lit-erature (Wilding, 1967; Kelly et al., 1991; McClaran and Umlauf, 2000; Santos et al., 2010, 2012a, 2016; Sullivan and Parr, 2013; Piperno, 2016). The first factor is the in-complete removal from phytolith concentrates of refractory SOM residues, either extraneous in the case of litter and soil samples or from the plant tissue itself. The accumula-tion effect of small quantities of residual recalcitrant (and somewhat older) SOM derived-C from concentrates due to incomplete digestion (Fig. 7), which can be detected via C:Si peaks with SEM-EDS (Corbineau et al., 2013), may be undetected under natural light microscopy. For instance, Santos et al. (2010) reported phytC 14C age offsets of 2.3 to 8.5 kyr BP on phytolith concentrates extracted from liv-ing grasses usliv-ing conventional digestion protocols, such as Kelly et al. (1991). Later, OM remnants in association with those anomalous14C results were detected by SEM-EDS in phytolith concentrates (Fig. 2 in Santos et al., 2012a), thus demonstrating that even very small amounts of particulate C were enough to bias the phytC14C results. Attempts to re-produce the atmospheric 14CO2 bomb-peak in phytC from bamboo litter and mature leaves subjected to microwave di-gestions, also yielded offsets of several hundreds to 3.5 kyr (Santos et al., 2012b; Sullivan and Parr, 2013). Similarly, a set of post-bomb Neotropical plant phytolith extracts pro-duced by two protocols yielded phytC 14C ages that were highly inaccurate, e.g., phytC14C offsets ranging from sev-eral decades to 4.4 kyr (Santos et al., 2016). In those cases, preferential bias due to post-depositional occlusion of SOM was unlikely. All phytolith extracts analyzed were obtained from living or close to living vegetation, undergoing differ-ent extraction procedures coupled with optical microscope analyses (for purity evaluations). Cumulative effects of OM remnants on phytoliths would also explain the higher phytC yields (Kelly et al., 1991; Li et al., 2014; Parr and Sullivan, 2005; Santos et al., 2010; Song et al., 2014). The second fac-tor is the increasing relative proportion of old SOM-derived C in phytC when phytolith extraction aggressiveness is high enough to remove the phytC fraction most sensitive to oxi-dation (e.g., the labile-accessible C fraction termed “proto-col 2” in Fig. 7). Once carbon partitioning takes place via either further chemical extractions or increased combustion temperatures, phytC concentrations tend to drop followed by increased 14C offsets to thousands of years old (Yin et al., 2014 and the present work).
Since the range of old SOM-derived C content in phytC left by a given protocol can be large (Fig. 2), and can vary in association to the abundances of C fractions within the substrates and their respective 14C signatures (Fig. 4), any attempt to apply a systematic correction to obtain a phytC Fm14C signature derived solely from photosynthesis is likely to fail. We can also assume that when grasses are forced to reach greater rooting depths (Sivandran and Bras, 2012) than the ones sampled here, where the proportion of
intrinsic-older organic compounds is likely to rise (Telles et al., 2003; Torn et al., 2009; Kleber, 2010; Petsch et al., 2001), old SOM-derived C in phytC and its Fm14C depletions would also increase. Furthermore, by themselves the 14C signa-tures of phytC pools with competing14C ages (recent SOM-derived C vs. present-day atmospheric14CO2)are insuffi-cient to distinguish them. Therefore, the old soil C to phytC contributions found here in association with the14C signa-tures of phytoliths extracted from living grasses are likely to be only a very small fraction of the total SOM contribution to phytC, as discussed earlier.
Further work is still needed to assess the full impact of SOM (e.g., the different fractions of labile vs. recalcitrant carbon; Han et al., 2007) to the phytC pool. At natural condi-tions the presence of SOM-derived C in phytC may bias the
δ13C signature to a lesser extent if the SOM and the plants of origin have similar photosynthetic pathways (C3or C4). The bias may however be significant if they are not. The δ13C sig-nature of SOM can be hard to assess, especially in the case of phytoliths extracted from sedimentary archives. Thus, we suggest that the use of14C and δ13C signatures of phytC as a dating tool or as a proxy of plant or atmospheric CO2 sig-natures should be reappraised in the light of the present find-ings.
3.7 Implications for long-term atmospheric CO2 biosequestration
The evidence for a SOM-derived C contribution to phytC decreases the putative effectiveness of grasslands and crops to sequester atmospheric CO2for two reasons. Besides neg-atively affecting phytolith C storage capacity, our findings most importantly invalidate phytC accumulation rates esti-mated from direct 14C dating of soil phytoliths (Parr and Sullivan, 2005). In addition, other issues may also come into play. For instance, the phytolith biosequestration hypothesis is based essentially on the following premises. First, high phytC concentrations are required. Values of 1.5–3 % d wt have been quantified (e.g., Li et al., 2013; Parr and Sulli-van, 2011; Parr et al., 2010). These values are more than 10 times higher than the concentrations recently measured by others (< 0.1 % d wt, Santos et al., 2010). Differences in the efficiency of phytolith extraction protocols (Kameník et al., 2013), combined with the lack of proper control (blanks) and reproducibility of results (Corbineau et al., 2013) may have contributed to these high phytC concentrations. Second, a soil phytolith stability factor of 70 to 90 % based on a few 14C measurements of soil phytoliths (e.g., Parr and Sullivan, 2005) has been estimated and widely used (Li et al., 2014) re-gardless of soil type. These high percentage estimates differ from those of biogenic Si fluxes, based on Si pool measure-ments in tropical soil–plant systems. For instance, accord-ing to Alexandre et al. (2011) investigataccord-ing two soil/plant systems in intertropical areas, only 10 % of phytoliths pro-duced annually are in fact preserved for extended periods,
the remaining 90 % being rapidly dissolved due to weather-ing (Oleschko et al., 2004). These proportions would reason-ably depend on environmental conditions such as activity of elements (Si, Al, Fe, H+) in soil solution, morphology of phytoliths (and thus vegetation type), and elemental concen-tration of phytoliths (and thus soil type).
Only as an exercise, we used the highest phytC yield measured in the frame of the present study (0.3 % of phytoliths) coupled with the 10 % phytolith stability fac-tor estimated from Alexandre et al. (2011), to recalcu-late a global grassland phytC-sink. We obtain a value of 4.1 × 10⁴tC yr−1, which is roughly one hundred times lower than the 3.7 × 10⁶tC yr−1value reported elsewhere (Song et al., 2014 and references therein). This amount is insignificant when compared to the 2.6 × 10⁹tC yr−1estimate for the land C sink (IPCC, 2007), or to the 0.4 × 10⁹tC yr−1global mean long-term soil C accumulation rate (Schlesinger, 1990). This suggests that previous conclusions on the importance of de-veloping silica accumulator crops for increasing atmospheric C sequestration should be reconsidered.
3.8 Implications for our understanding of soil C pools mobilization
Our findings have important implications for our understand-ing of the mobilization of soil C pools. Several studies have shown that terrestrial plant roots can uptake soil dissolved inorganic carbon (DIC). DIC can be transported directly by the transpiration stream or fixed in mycorrhizal and root tis-sues and subsequently translocated in the form of amino acid (Gioseffi et al., 2012; Rasmussen et al., 2010; Talbot and Treseder, 2010). DIC can represent 1–3 % of total leaf-fixed CO2 (Ford et al., 2007; Ubierna et al., 2009). However, as DIC is expected to be in equilibrium with soil CO2respired from autotrophic and heterotrophic sources, its14C signature should reflect an average of SOM 14C signatures, close to contemporary. Assuming soil DIC as the soil end-member in Fig. 2, the phytC samples from ambient CO2experiments would plot along mixing lines with lower slopes than the ac-tual ones. The14C age of several thousand years systemati-cally measured for the most resistant phytC, rather suggests that an older SOM fraction supplies the SOM-derived C ab-sorbed by the roots, up-taken and transported to the stem and leaves tissues.
The fact that roots can also acquire soil C in a molecular form has been previously inferred from the detection in roots, stems and shoots of polycyclic aromatic hydrocarbons (PAH) (Gao et al., 2010; Yu et al., 2013), and soil amino acids (AA) (Paungfoo-Lonhienne et al., 2008; Warren, 2012; White-side et al., 2009, 2012). Although reported PAH tions were three orders of magnitude below phytC concentra-tions (e.g., 10−9g g−1 vs. 10−6g g−1, assuming 0.1 % d wt for both phytolith concentration in plants and phytC content in phytoliths), AAs make up several tenths of a percent of the plant nitrogen requirements (Lipson and Näsholm, 2001).
Arbuscular mycorrhizal fungi, which colonize 70 % of plant families (Talbot and Treseder, 2010; Treseder and Turner, 2007) are probably at the base of the transfer of molecular C from the rhizosphere to the roots, although intact protein has also been shown to enter root cells without the help of my-corrhizae, most likely via endocytosis (Paungfoo-Lonhienne et al., 2008). At lower scales, AA transporters were shown to confer the ability of plants to absorb molecular C from the soil solution (Lipson and Näsholm, 2001; Tegeder, 2012). Root acquisition of humic substances (active and passive) and its positive effect on plant nutrient uptake has been also reported (Trevisan et al., 2010). The incorporation of below-ground physical, chemical and biological processes in the rhizosphere (e.g., microbial priming effect or N and C cycle interactions) have also been proposed (Heimann and Reich-stein, 2008 and references therein). The results of the present study go a step further by demonstrating that part of the soil molecular C absorbed by roots is several thousand years old. Recent studies also show that old, supposedly poorly ac-cessible SOM (Kleber, 2010; Petsch et al., 2001; Schmidt et al., 2011), can be decomposed by organisms or catalytic enzymes (Dungait et al., 2012; Marín-Spiotta et al., 2014). Common sources of dissolved Si for plants are clay miner-als and amorphous silicates (allophane, imogolite). Due to their small size, high surface functional groups, area, and porosity, these minerals stabilize SOM either by adsorption onto their surface or by aggregation (Basile-Doelsch et al., 2007; Jones and Singh, 2014; Kögel-Knabner et al., 2010). Further studies are needed to investigate whether dissolution of Si-bearing forms during active uptake of Si (Ma et al., 2006) may also promote old SOM mobilization, ready to be chelated with Si, absorbed by the roots and translocated to the stems and leaves.
4 Conclusions
Although photosynthesis is the main source of C in plant tissue, we have demonstrated here that grass biosilica (phy-toliths) occlude SOM-derived C that can be several thousand years old, debunking the common assumption of phytC pho-tosynthetic carbon exclusivity. This finding suggests causes for previous anomalously older phytC14C ages found in the literature. Moreover, the fact that phytC is not uniquely con-stituted of photosynthetic C limits the usefulness of phytC either as a dating tool or as a significant sink of atmospheric CO2. Revised estimates of atmospheric CO2 biosequestra-tion by phytoliths led to values that are insignificant com-pared to the total land C or soil C sinks. All in all, by demon-strating that old SOM-derived C is accessible to roots and builds up in plant biosilica, this study constitutes a basis to further investigate the mechanism and amplitude of old SOM recycling by roots for a better understanding of the C cycle at the soil/plant interface.
The Supplement related to this article is available online at doi:10.5194/bg-13-1269-2016-supplement.
Author contributions. G. M. Santos conceived the study. G. M. Santos, A. Alexandre, P. E. Reyerson, and R. Cor-bineau designed the experiments and conceived the strategies for phytolith extraction and purity analyses. G. M. Santos, P. E. Reyerson, A. Alexandre, A. Harutyunyan, R. Corbineau and H. Martinez De La Torre performed the experiments and contributed to analysis tools. F. Badeck and L. Cattivelli provided bulk tissue and soil samples from T. Durum FACE. G. M. Santos, A. Alexandre, and P. E. Reyerson interpreted the data and wrote the paper. All authors discussed the results and implications, and commented on the paper.
Acknowledgements. The authors gratefully acknowledge the
support of the US National Science Foundation (DEB-1144888 to GMS), the French FIR 2010 (Aix-Marseille Université), ECCOREV 2011, AIR Archéométrie 2011(CNRS) and Labex OT-Med 2013. PER wishes to thank J. A. Mason (University of Wisconsin-Madison) and the National Lacustrine Core Facility (University of Minnesota) for lab space usage. GMS thanks M. J. Ottman, B. Kimball, S. W. Leavitt, E. Pendall, P. Pinter, G. Hendrey, H. L. Cho and R. Rauschkolb for providing the archived Maricopa FACE samples. Financial support provided by the Durum experiment via the “Fondazione in rete per la ricerca agroalimentare” with the AGER program: agroalimentare e ricerca is gratefully acknowledged. We thank J. Southon for help with the
14C-AMS analyses, and C. Czimczik and M. Lupasco for technical
support with the CO2flux measurements, help in interpreting the
data, and suggestions and comments on an early version of this paper. We would like to thank X. Xu for the stable isotope analysis and technical support for CO2-air cryogenic extraction, and Q. Lin
and the Laboratory for Electron and X-ray Instrumentation (LEXI) at UC Irvine for access to lab space and assistance with X-ray analytical techniques. We also thank S. Fahrni for providing the inorganic fertilizer used in the control planter, and K. Gallagher for her efforts on the estimates of percent carbon of some amendments. A. Alexandre thanks J. Balesdent (CEREGE) for helpful discussion on root absorption of molecular C. The authors also wish to extend their thanks to the Editor Roland Bol and the three anonymous reviewers for the constructive comments.
Edited by: R. Bol
References
Alexandre, A., Bouvet, M., and Abbadie, L.: The role of savannas in the terrestrial Si cycle: A case-study from Lamto, Ivory Coast, Glob. Planet. Change, 78, 162–169, 2011.
Alexandre, A., Basile-Doelsch, I., Delhaye, T., Borshneck, D., Mazur, J. C., Reyerson, P., and Santos, G. M.: New highlights of phytolith structure and occluded carbon location: 3-D X-ray mi-croscopy and NanoSIMS results, Biogeosciences, 12, 863–873, doi:10.5194/bg-12-863-2015, 2015.
Badeck, F. W., Rizza, F., Maré, C., Cattivelli, A., Zaldei, F., and Miglietta, F.: Durum wheat growth under elevated CO2: first
re-sults of a FACE experiment, in: Proceedings of the XVI National Congress of Agrometeorology: Agrometeorology for Environ-mental and Food Security, Bologna, Pàtron Editore, 2012. Bae, M.-S., Schauer, J. J., Deminter, J. T., Turner, J. R., Smith,
D., Cary, and R. A.: Validation of a semi-continuous instrument for elemental carbon and organic carbon using a thermal-optical method, Atmos. Environ., 38, 2885–2893, 2004.
Basile-Doelsch, I., Amundson, R., Stone, W. E. E., Borschneck, D., Bottero, J. Y., Moustier, S., Masin, F., and Colin, F.: Mineral con-trol of carbon pools in a volcanic soil horizon, Geoderma, 137, 477–489, 2007.
Bauer, P., Elbaum, R., and Weiss, I. M.: Calcium and silicon miner-alization in land plants: Transport, structure and function, Plant Sci., 180, 746–756, 2011.
Beverly, R., Beaumont, W., Tauz, D., Ormsby, K., Von Reden, K., Santos, G. M., and Southon, J. R.: The Keck Carbon Cycle AMS Laboratory, University of California Irvine: status report, Radio-carbon, 52, 301–309, 2010.
Carter, J. A.: Atmospheric carbon isotope signatures in phytolith-occluded carbon, Quaternary Internat., 193, 20–29, 2009. Cheng, P., Zhou, W., Wang, H., Lu, X., and Du, H.:14C dating of
soil organic carbon (SOC) in loess-paleosol using sequential py-rolysis and accelerator mass spectrometry (AMS), Radiocarbon, 55, 563–570, 2013.
Corbineau, R., Reyerson, P. E., Alexandre, A., and Santos, G. M.: Towards producing pure phytolith concentrates from plants that are suitable for carbon isotopic analysis, Rev. Palaeobot. Paly-nol., 197, 179–185, 2013.
Crespin, J., Alexandre, A., Sylvestre, F., Sonzogni, C., Pailles, C., and Garreta, V.: IR laser extraction technique applied to oxygen isotope analysis of small biogenic silica samples, Ann. Chem., 80, 2372–2378, 2008.
Czimzik, C. I., Trumbore, S. E., Carbone, M. S., and Winston, G. C.: Changing sources of soil respiration with time since fire in a boreal forest, Glob. Change Biol., 12, 957–971, 2006.
Deer, W. A., Howie, R. A., and Zussman, J.: An introduction to the rock-forming minerals, Essex, Longman Scientific and Techni-cal, 2nd Edn., Longman Scientific and TechniTechni-cal, Essex, 696 pp., 1992.
Dungait, J. A., Hopkins, D. W., Gregory, A. S., and Whitmore, A. P.: Soil organic matter turnover is governed by accessibility not recalcitrance, Glob. Change Biol., 18, 1781–1796, 2012. Fernandez, A., Santos, G. M., Williams, E. K., Pendergraft, M. A.,
Vetter, L., and Rosenheim, B. E.: Blank corrections for ramped pyrolysis radiocarbon dating of sedimentary and soil organic car-bon, Anal. Chem., 86, 12085–12092, 2014.
Ford, C. R., Wurzburger, N., Hendrick, R. L., and Teskey, R. O.: Soil DIC uptake and fixation in Pinus taeda seedlings and its C contri-bution to plant tissues and ectomycorrhizal fungi, Tree Physiol., 27, 375–383, 2007.
Gao, Y., Cheng, Z., Ling, W., and Huang, J.: Arbuscular mycor-rhizal fungal hyphae contribute to the uptake of polycyclic aro-matic hydrocarbons by plant roots, Bioresour. Technol., 101, 6895–6901, 2010.
Geis, J. W.: Biogenic silica in selected species of deciduous an-giosperms, Soil Sci., 116, 113–130, 1973.