HAL Id: hal-02982488
https://hal-cnrs.archives-ouvertes.fr/hal-02982488
Submitted on 3 Dec 2020
HAL is a multi-disciplinary open access archive for the deposit and dissemination of sci-entific research documents, whether they are pub-lished or not. The documents may come from teaching and research institutions in France or abroad, or from public or private research centers.
L’archive ouverte pluridisciplinaire HAL, est destinée au dépôt et à la diffusion de documents scientifiques de niveau recherche, publiés ou non, émanant des établissements d’enseignement et de recherche français ou étrangers, des laboratoires publics ou privés.
Evidence of mud volcanism due to the rapid compaction
of Martian tsunami deposits in southeastern Acidalia
Planitia, Mars
Ilaria Di Pietro, Antoine Séjourné, F. Costard, Marta Ciążela, J. Alexis
Palmero Rodriguez
To cite this version:
Ilaria Di Pietro, Antoine Séjourné, F. Costard, Marta Ciążela, J. Alexis Palmero Rodriguez. Evidence of mud volcanism due to the rapid compaction of Martian tsunami deposits in southeastern Acidalia Planitia, Mars. Icarus, Elsevier, 2021, 354, pp.114096. �10.1016/j.icarus.2020.114096�. �hal-02982488�
1
Evidence of mud volcanism due to the rapid compaction of
Martian tsunami deposits in southeastern Acidalia Planitia,
Mars
Ilaria Di Pietroa1, Antoine Séjournéb,François Costardb, Marta Ciążelac and J. Alexis Palmero Rodriguezd
a International Research School of Planetary Sciences (IRSPS), Dipartimento di Ingegneria e Geologia (INGEO), Università
degli Studi Gabriele d’Annunzio, viale Pindaro 42, 65127 Pescara, Italy
b Géosciences Paris Sud (GEOPS), UMR 8148, Université Paris-Sud, CNRS, Rue du Belvédère, 91400 Orsay, France c Space Research Centre, Polish Academy of Sciences (PAS), ul. Bartycka 18A, 00-716 Warsaw, Poland
d Planetary Science Institute (PSI), 1700 E Fort Lowell Rd # 106, 85719 Tucson, Arizona, USA
1 Dipartimento di Scienze Psicologiche, della Salute e del Territorio (DISPUTER), Università degli Studi Gabriele d’Annunzio, via dei Vestini 32, 66100 Chieti, Italy
Corresponding author:
Ilaria Di Pietro
Dipartimento di Scienze Psicologiche, della Salute e del Territorio (DISPUTER), Università degli Studi G. d’Annunzio, Via dei Vestini, 31 - 66100 Chieti, Italy
ilaria.dipietro@unich.it
2 Abstract
Thumbprint terrain was first recognized in Viking Orbiter data and described as sets of alternating continuous parallel ridges and depressions up to several tens of kilometres in length, with high and low albedo respectively. We performed a geomorphological analysis of these features using both Context Camera and High Resolution Imaging Science Experiment images, as well as topographic profiles based on Mars Orbiter Laser Altimeter data, with the aim to provide an origin for thumbprint terrain and constrain the geological evolution of southeastern Acidalia Planitia. The identification of runup lobate deposits, coupled with the putative presence of a Late Hesperian ocean in the northern lowlands, led to speculations that evidence of tsunamis may be present in the geologic record of the area. There are several hypotheses that have been proposed previously to explain the origin of thumbprint terrain and include ice-related, volcanic-related, liquefaction and mud-volcanism driven processes. However, a tsunami-related origin provides a strong geological framework for the energy required for the associated lobes to flow uphill and leaving peripheral termination ridges as a result of viscosity. Numerical simulations indicate that - prior to their emplacement - the lobes sustained high velocities, thereby lending further support to the tsunami hypothesis and their origin
from the Lomonosov crater impact. Wave interference patterns, formed during the propagation of the tsunamis over and around prominent topography, likely explain the thumbprint terrain spatial arrangement. The thumbprint terrain sedimentary cones are, herein, considered mud volcanoes related to a tsunami that occurred in southeastern Acidalia Planitia.
3 1 Introduction
The presence of a Hesperian ocean within the northern plains is one of the most debated issues of the Martian geology (Parker et al., 1989, 1993; Head et al., 1998, 1999; Clifford and Parker, 2001; Carr and Head, 2003; Tanaka et al., 2003, 2005). Its presence would imply that northern lowlands gathered a large quantity of water and sediments. Outflow channels, carved by large-scale floods (Carr, 1979), are commonly thought to have served as the primary supply of water which may have filled the northern lowlands in the Late Hesperian (Parker et al., 1989, 1993; Baker et al., 1991; Clifford and Parker, 2001; Tanaka et al., 2005). The ocean-hypothesis is supported by several flat surfaces that can be observed spanning thousands of kilometres and marking distinct units in the peripheral northern lowlands. These limits have been interpreted as paleo-shorelines (Parker et al., 1989, 1993; Clifford and Parker, 2001); for example, the Deuteronilus contact is characterized by very slight topographic variations (-3792 ± 236 m), which are strikingly consistent with the paleo-shoreline hypothesis (Clifford and Parker, 2001; Carr and Head, 2003; Perron et al., 2007; Citron et al., 2018). On the other hand, some limits (i.e., Arabia contact) have topographic amplitudes of up to several kilometres that have initially been used against the ocean hypothesis (Head et al., 1998; Head et al., 1999; Carr and Head,2003). However, recent studies proposed that these limits represent deformed paleo-shorelines as the result of deformation related to true polar wander occurring before and during the massive Tharsis volcanic rise (Citron et al., 2018; Zuber, 2018) or after the formation of Tharsis region (Perron et al., 2007). Several studies have also showed that there could be a large reservoir of water/mud in the deepest portions of the Utopia basin during the Hesperian (Ivanov et al., 2014; Ivanov et al., 2015). This may potentially represent the remnant of a larger standing body of water, further supporting the presence of an ocean within the northern plains (Parker et al., 1989, 1993; Head et al., 1998, 1999; Clifford and Parker, 2001; Carr and Head, 2003; Tanaka et al., 2003, 2005).
4
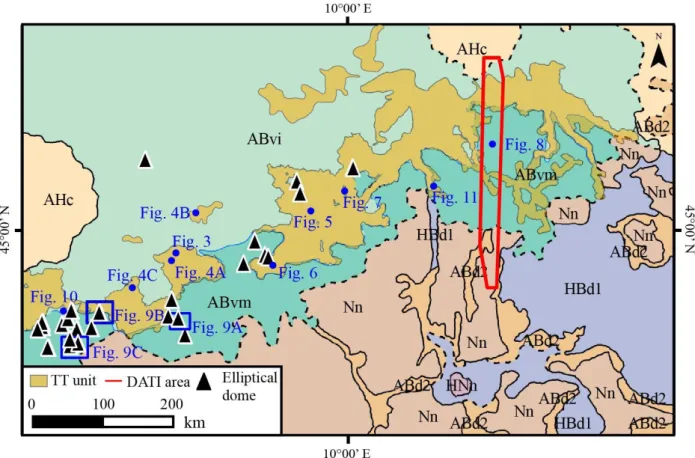
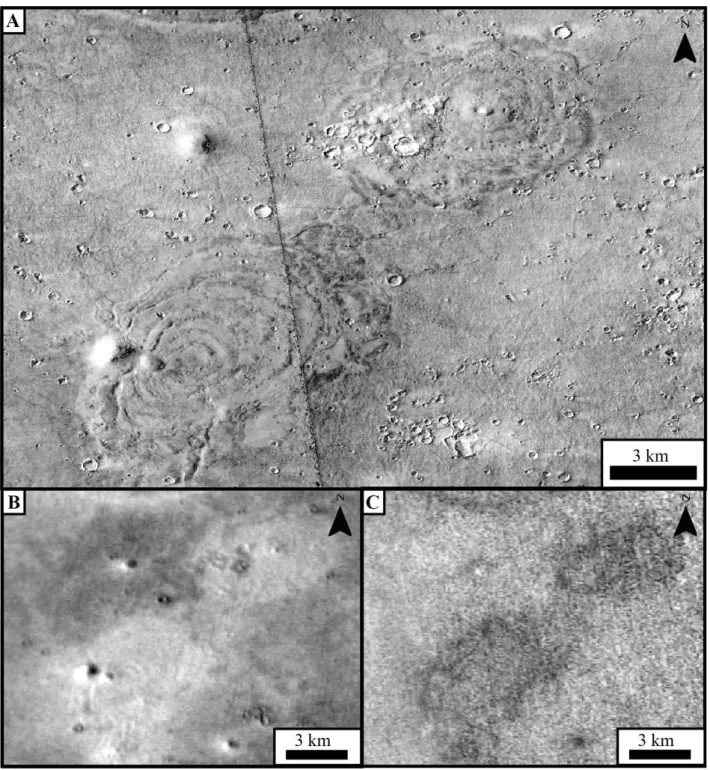
Figure 1. Thumbprint terrain in Acidalia Planitia. A) Thumbprint terrain at low resolution with a random arrangement (black arrow) on the left and an arcuate and parallel linear disposition (white arrow). B) Study area is marked by the black rectangle on the topographic map based on colorized Mars Orbiter Laser Altimeter data. Courtesy of NASA/JPL/Univ. of Arizona.
Thumbprint terrain (represented hereafter as TT) was previously recognized and described as continuous parallel and curvilinear ridges at regional scale (Fig. 1A – white arrow) on the basis of Viking Orbiter data (Lockwood et al., 1992). However, the wealth and increasing resolution of remotely sensed imagery showed it is comprised of both randomly (Fig. 1A – black arrow) and highly organized (Fig. 1A – white arrow) spatial patterns of individual pitted cones/small mounds that lie above lobate deposits. Thumbprint terrain overlies millions of square kilometres primarily in the northern plains between 30°N and 50° (e.g., Acidalia Planitia, Utopia Planitia, etc…), although they also occur in a large area near the Martian equator (i.e., Isidis Planitia). Several hypotheses have been proposed for the origin of thumbprint terrain; with the majority of them involving the presence of ice/water. The individual cones were first interpreted as possible pseudo-craters formed by explosions associated with lava emplacement over wet ground (Frey and Jarosewich, 1982; Carr, 1986), cinder cones (Scott et al., 1995), pingos, ice-cored ridges (Lucchitta, 1981; Rossbacher and Judson, 1981), moraines (Lucchitta, 1981; Scott and Underwood, 1991; Kargel and Strom, 1992; Lockwood et al., 1992), or mounds formed by the disintegration of stagnant ice covers (Grizzaffi and Schultz, 1989). According to the most recent hypotheses, they are interpreted as mud
5
volcanism-driven deposits (Tanaka et al., 2003; Salvatore and Christensen, 2014), liquefaction deposits (Skinner et al., 2008; Skinner and Fergason, 2010) or related to impact-generated tsunami lobate deposits (Rodriguez et al, 2016; Costard et al, 2017; Costard et al., 2019).
On Earth, the most common triggers of tsunamis are earthquakes, subaqueous landslides, and volcanic activity. Only on rare occasions meteorite crashes give rise to tsunamis, thus terrestrial impact-induced tsunami deposits are sparse (Paris et al., 2009; Bryant, 2001). Conversely, on Mars, impact-generated tsunamis seem to be a plausible trigger mechanism. The study area (SE Acidalia Planitia) is uniquely positioned in that numerical modelling and geologic investigation tie an asteroid impact (e.g., Lomonosov crater) to the generation of a tsunami wave (Iijima et al., 2014;
Rodriguez et al, 2016; Costard et al, 2017; Costard et al., 2019) that extended to the areas covered by thumbprint terrain. These numerical predictions, combined with geologic observations, demonstrate the importance of the study area and provides a convincing scenario for thumbprint terrain origin.
Here, we focused on thumbprint terrain (or TT), i.e. alignments of cones or mounds, in the southeastern Acidalia Planitia near the dichotomy (43°-53° N 0°-22° E; Fig. 1B), in an effort to: (i) characterize their geographical distribution; (ii) describe their morphology and relationship with former/underlying topography around the dichotomy and (iii) discuss their origin considering evidences and regional geological context. We will refer to alignments of cones/mounds simply as “thumbprint terrain” or “TT”; while we will refer to both thumbprint terrain and underlying associated lobate deposits as “lobate TT unit”. Although lobate deposits were not the focus of this study, it is useful to have a terminology that indicates both thumbprint terrain and underlying lobes when discussing the overall evolution of the area since target morphologies (TT) are closely related to lobate deposits in SE Acidalia Planitia.
2 Stratigraphy
The Vastitas Borealis Formation is the most widespread formation in the northern lowlands (Greeley and Guest, 1987; Tanaka and Scott, 1987). Many different hypotheses have been proposed to explain its origin, supporting either a sedimentary
6
processes related to outflow channels (Kreslavsky and Head, 2002) or a volcanic process (Catling et al., 2012). Kreslavsky and Head (2002) asserted that a sedimentary section of the Vastitas Borealis Formation formed as a residue when water from the outflow channels settled, quickly froze, and then sublimated. However, recent studies suggested that portions of Vastitas Borealis Formation were emplaced and/or modified while still saturated with liquid water (McGill and Hills, 1992; Tuckwell et al., 2003; Buczkowski and Cooke, 2004; Cooke et al., 2011; McGowan, 2011; Buczkowski et al., 2012). Regional geologic mapping (Tanaka et al., 2005; Fig. 2) separated the Vastitas Borealis Formation into two distinct units: the interior (ABvi) and the marginal unit (ABvm). the ABvi unit is the more extensive of the two units and hosts most of the diagnostic Vastitas Borealis Formation morphological features (Salvatore and Christensen, 2014). Data from Mars Orbiter Laser Altimeter (MOLA) derived Digital Elevation Model (DEM) and several 100-m/pixel-resolution Thermal Emission Imaging System images (THEMIS) reveals that the ABvi unit is rougher and has a higher thermal inertia than the ABvm unit (Tanaka et al., 2005, and references therein). The ABvi unit also consists of relatively bumpy, plains-forming material (Tanaka et al., 2005) that covers most of the northern plains including Vastitas Borealis and Utopia, Acidalia, and northern Arcadia Planitiae. The outer parts of the ABvi unit include the lobate TT unit (Fig. 2), as well as random clusters of hills mostly <1 km across (Frey and Jarosewich, 1982; Grizzaffi and Schultz, 1989; Scott et al., 1995). Approaching the edge of the unit, cones/mounds tend to decrease in quantity, occuring in random and small groups until their complete disappearance (Tanaka et al., 2005; Salvatore and Christensen, 2014). Conversely, the ABvm unit outcrops surround the ABvi in Utopia Planitia, along Arabia Terra, in southern Acidalia Planitia, north of Alba Patera, and in western Arcadia Planitia. At lower latitudes (< 25° N), it appears smoother, exhibits a higher albedo and lower thermal inertia than both the ABvi unit and surrounding materials in THEMIS daytime infrared images. This means that the ABvm unit is warmer, which may indicate a relatively fine-grained material compared to adjacent materials (Tanaka et al., 2005). Parts of the ABvm are buried by Amazonis and Elysium provinces materials. The ABvm unit also includes systems of fretted valleys that are a few kilometres wide and tens of kilometres long (Squyres, 1978; Carr, 1995; Tanaka et al., 2005). These features have no clear terrestrial analogues and they have previously been compared to glacial moraines and kame complexes (Lucchitta, 1981), glacial tunnel valley and esker features (Kargel et al., 1995), or soft-sediment deformation structures (Tanaka et al.,
7
2003). The Vastitas Borealis marginal and interior units generally have a poorly defined contact and post-emplacement material evolution. In addition, the southern limit of the collective outer margin of both Vastitas Borealis units is fairly constant in elevation (~ -3900m ± 70m) and close to the mean elevation of the Deuteronilus contact (see section 1), hence it may indicate the presence of an ancient standing body of water (Parker et al., 1989, 1993; Head et al., 1999; Clifford and Parker, 2001; Carr and Head, 2003). In our study area, the Vastitas Borealis Formation approaches the Noachis Terra unit (Nn) (Fig. 2) and to a lesser extent the Deuteronilus Mensae 1 unit (HBd1; Mangold et al., 2002) (Fig. 2). The Noachis Terra unit is Middle to Late Noachian in age and represents mostly heavily cratered terrain (Tanaka et al., 2005). Most of the unit displays layering (Malin and Edgett, 2001), in MOC narrow-angle data. Elevation ranges between –2,000 and –5,000 m within the northern plains across Orcus Patera and Acidalia Mensa (Tanaka et al., 2005).
Figure 2. Background geological map is ‘US Geological Survey Sci. Inv, Map 2888’ by Tanaka et al., 2005. Lobate TT unit extension is marked by the orange polygons and covers an area bigger than 105
km². Red frame indicates the area of quantitative thermal inertia analysis (See section 3). Elliptical domes related to the thumbprint terrain (see Fig. 9-10) are localized outside or along the boundary of the thumbprint area (black triangles are not to scale). The lobate TT unit was mapped crossing both the Vastitas Borealis interior unit (ABvi) and Vastitas Borealis marginal unit (ABvm). Other geologic units: Nn - Noachis Terra Unit; HBd1 - Deuteronilus Mensae unit 1; ABd2 - Deuteronilus Mensae 2 units; HNn -
8
Nepenthes Mensae unit. See Tanaka et al. 2005, for a more complete description. Courtesy of NASA/USGS.
3 Data and Methods
Context Camera (CTX; 6m/pixel) (Malin et al., 2007) and High Resolution Imaging Science Experiment (HiRISE; 0.25-0.32m/pixel) (McEwen et al., 2007) images were used to investigate thumbprint terrain. CTX images provided a full coverage of the study area to be compared with Mars Orbiter Laser Altimeter (MOLA; Smith et al., 2001) digital elevation model (DEM) which provided the topographic base map with a spatial resolution of 463 m. Detailed topographic profiles were performed from MOLA laser shots (vertical resolution: 50 cm; size of the laser shot on the surface: 128 m) to investigate and to provide a topographic context for TT morphologies and associated lobate deposits (e.g. Fig.3 and following) thanks to MOLA Precision Experiment Data record (PEDR) facility available at the Photothèque Planétaire d'Orsay, France (http://fototek.geol.upsud.fr/-Mars-Orbiter-Laser-Altimeter-.html). Mars Odyssey (ODY) Thermal Emission Imaging System (THEMIS) daytime and night-time infrared (IR) images (100m/pixel; Christensen et al., 2004) were also used to investigate the thermo-physical properties, including thermal inertia that quantifies the thermo-physical properties and average particle sizes of surface textures and morphologies (Fergason et al., 2006). Relief characteristics (slopes and aspects) for the relief correction of albedo and temperature difference (input parameters in Eq. 1) were calculated based on the High Resolution Stereoscopic Camera (HRSC) DEM-s (spatial resolution: 100 m; Neukum and Jaumann, 2004; Jaumann et al., 2007) in *da4.img format (aeroid directly comparable with MOLA grid) acquired from Mars Orbital Data Explorer
(http://ode.rsl.wustl.edu/mars/).
3.1 Thermal inertia estimation
We performed a quantitative detailed analysis of thermal inertia on a selected portion of the studied area (Fig. 2). As direct measurement of thermal inertia was not possible to estimate; Differential Apparent Thermal Inertia (DATI) was computed as follows:
𝐷𝐴𝑇𝐼 = 1 − 𝐴
∆𝑇 [Eq. 1]
where A is the albedo and ∆T is the temperature difference. DATI technique (Sabol et
1
al., 2006) is proportional to P (‘direct’ thermal inertia) and is calculated based on short
9
time (t) intervals (at least one hour time difference) with a high |ΔT/Δt| gradient (in the
3
morning or in the afternoon), preferably during the same period of the year (similar solar
4
longitude).The selected part of SE Acidalia Planitia was chosen on the base of: (i) data
5
availability for DATI calculation (i.e., high quality images with appropriate time interval,
6
in the same period of the year), and (ii) the presence of the key landforms (thumbprint
7
terrain). THEMIS IR images were processed online using the Themis Processing Web
8
Interface (THMPROC; http://thmproc.mars.asu.edu). To calculate the Differential
9
Apparent Thermal Inertia (Eq. 1), high quality THEMIS images were chosen: the
10
minimum and maximum “summing” parameters were set to 1 (full-resolution images),
11
while the minimum and maximum “image rating values” were set to 4 and 7,
12
respectively. These parameters depend on a subjective assessment of the image
13
quality ranging from 1 (unusable) to 7 (very good); this assessment includes
14
consideration of exposure, missing lines, instrument noise, and atmospheric features.
15
Relief correction for A and ∆T was also performed since this kind of calibration is not
16
included in thermal inertia modelling. Temperature difference (∆T) was additionally
17
calibrated against total incoming energy. Atmospheric correction was also included. In
18
order to avoid large errors by calculating DATI and albedo, the cells with i > 79° were
19
excluded from the calculations.
20
The uncertainty in DATI calculation arises from errors due to dust opacity, albedo and
21
slope inclination. The errors in daytime THEMIS temperatures may be ±3 K (Fergason
22
et al., 2006). Assuming the temperature amplitude is 20 K and albedo is 0.2, a ±3 K
23
error implies 17% relative error on thermal inertia due to the error of each of two
24
measured temperatures. Dust opacity is 1.6 J m-2 K-1 s-1/2 making up 0.8% of the
25
average DATI, (200 J m-2 K-1 s-1/2), and standard deviation (SD) due to seasonal
26
variation of dust opacity in the high-dust season, which is 0.1. We estimate that a dust
27
opacity error of 0.1 generates a relative error of 5.6% on apparent thermal inertia by
28
comparing average DATI values corrected for dust opacities of 0.22 (average), 0.32
29
(average +1 SD) and 0.12 (average –1 SD). Considering the two errors of 0.8% and
30
5.6%, the total uncertainty related to dust opacity is 5.7% when applying the rule of
31
error propagation for error addition. The uncertainty of albedo calculation is 8% which
32
generates a 1.5% error on DATI values. The error in computation of slope inclination on
33
HRSC DTM is ~4° (Heipke et al., 2007), which can potentially add up to 35% of error on
34
DATI values where the incidence angle is very high (79°). This is calculated by
10
comparing DATIs for 79° to the average DATI for 75° and 83°, provided all other
36
parameters are fixed at typical values. In the most common case where the incidence
37
angle is in the range 0°– 50°, the DATI error is within 10%. Taking temperature, dust
38
opacity, slope inclination and albedo into account, the total uncertainty on DATI is
39
estimated to be within 27%. However, it can reach up to 43% when the incidence angle
40
is 79°.
41
42
3.2 Crater-size frequency distribution 43
We performed a crater counting analysis using CTX imagery to provide an age
44
estimation for the lobate TT unit deposits. All visible impact craters (>500 m in diameter)
45
were measured except the aligned secondary clusters and rays within the CTX
46
resolution limit using the ArcGIS add-in CraterTools (Kneissl et al., 2011; Bamberg et
47
al., 2013). The crater-size frequency distribution (CSFD) was plotted and the crater
48
retention ages were calculated with Craterstats by visually selecting the portion of the
49
crater size-frequency distributions that is parallel to some isochrons between steps of
50
the distribution (Neukum, 1983; Hartmann and Neukum, 2001; Platz et al., 2013).
51
4 Results 52
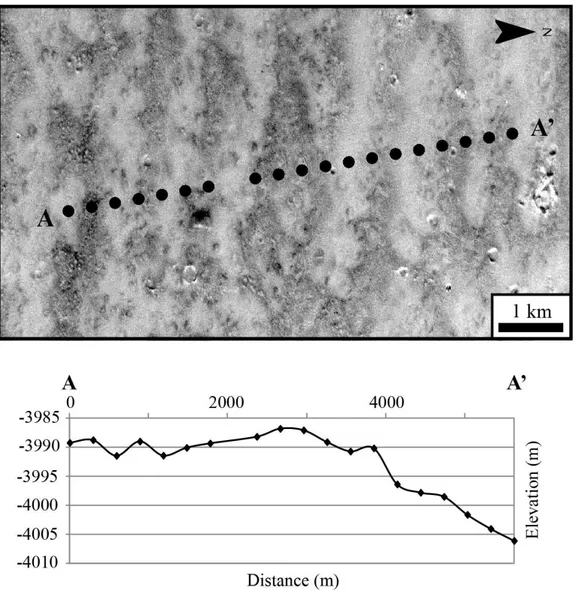
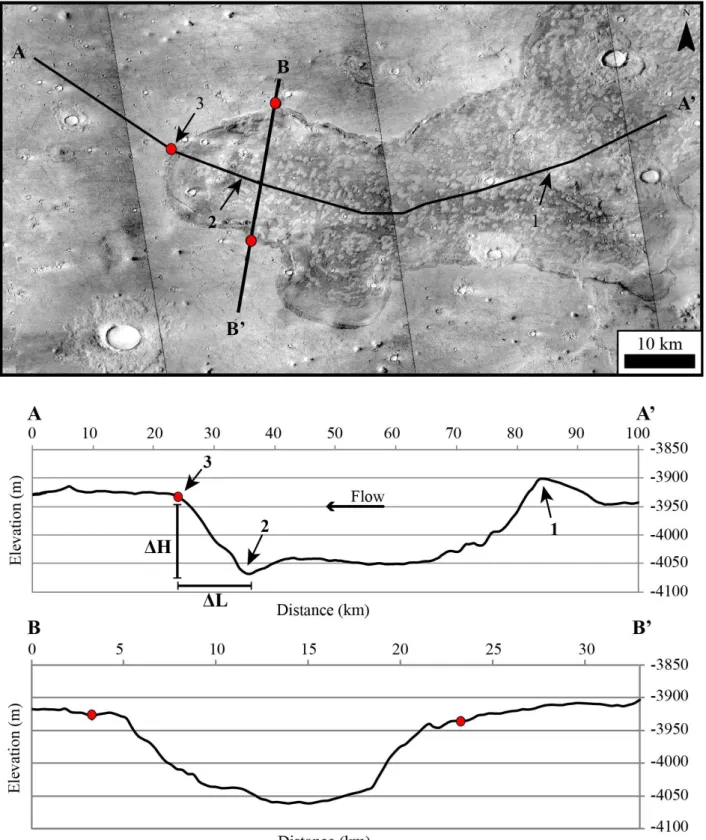
Thumbprint terrain was usually described as sets of alternating ridges/mounds and
53
depressions, with high and low albedo respectively, up to several tens of kilometres in
54
length (Fig. 1A; Lockwood et al., 1992). However, we observed no noticeable variations
55
of alternating relief by using MOLA laser shots in our study area (Fig. 3). The low albedo
56
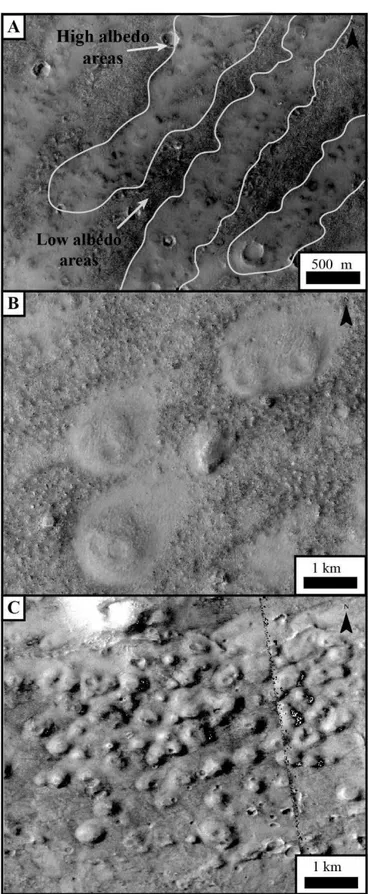
surfaces show a darker rough surface, while the high albedo areas show alignments of
57
poorly expressed mounds (Fig. 4A) that can individually be dome-like (Fig. 4B) or more
58
rarely conical (Fig.4C) when seen at high resolution.
11 60
61 62
Figure 3. Topography of the thumbprint terrain. A topographic profile crossing the high and low albedo
63
area was performed by using MOLA laser shots. No clear topographic alternation is observed between
64
the two areas. The black points represent the approximate size of the laser shot on the surface (128m)
65
according to Smith et al., 1999; 2001 (CTX image n° B17_016195_2250). North is oriented 90 degrees
66
right. Courtesy of NASA/ JPL/Univ. of Arizona.
12 68
Figure 4. Morphology of thumbprint terrain at high resolution. A) High albedo areas include mounds and
69
pits while low albedo areas are composed of a rough surface (HiRISE image: ESP_011949_2255). The
70
high albedo areas of the thumbprint terrain include mounds that may be B) dome-like (HiRISE image:
71
PSP_001928_2265) or more C) cone-like shaped mounds (CTX image: P22_009747_2239). The former
72
type is usually bigger in diameter than the latter, but no clear correlation was found. Courtesy of JPL/Univ.
73
of Arizona.
13
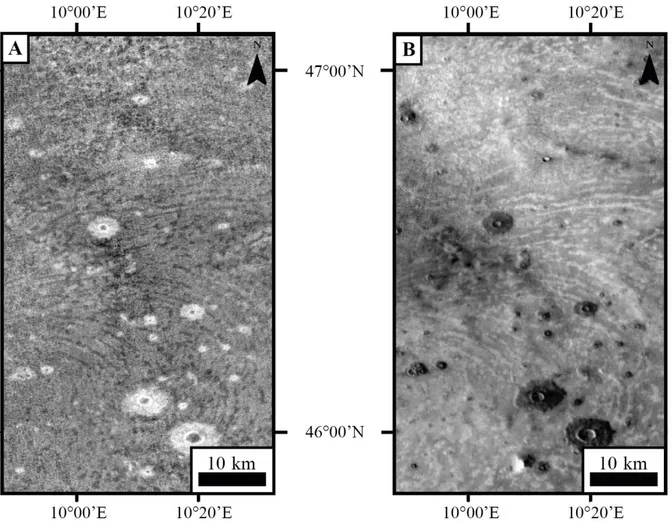
Thermal inertia comparisons showed that thumbprint terrain is brighter than the
75
surrounding terrain in day-time THEMIS images, whereas it is darker in night-time ones
76
(Fig. 5). Moreover, the whole lobate TT unit is also generally brighter in day-IR images
77
in comparison to the surrounding plains and plateau units, so we readily defined the
78
lobate TT unit limit realizing: (i) TT is also present in the ABvm unit, although previous
79
literature (Tanaka et al., 2005) considers that it extends only within the ABvi unit (Fig. 2)
80
and (ii) it covers an extensive surface greater than 105 km² in southeastern Acidalia
81
Planitia.
82
83
Figure 5. THEMIS daytime and night-time infrared images of thumbprint terrain. The low albedo areas are
84
darker in night-time images (A) and brighter in daytime ones (B). Night-time image resolution is lower than
85
the daytime resolution.
86
Unfortunately, the northern limit of the lobate TT unit in Acidalia Planitia is covered by a
87
unit of lower albedo that has a constant elevation of around -4100m (supplementary
88
material). Therefore, the true extent of the unit remains unknown. In the southern region
89
of the study area, the lobate TT unit covers the plateau and valleys near the dichotomy.
90
The southern boundary of the unit is marked by several lobate features with peripheral
91
and lateral ridges that sometimes overlap each other in the Deuteronilus valley system
14
(Costard et al., 2017). The lobes are found inside valleys or on lateral valley plains
93
between -3860 m and -4001 m altitude.
94
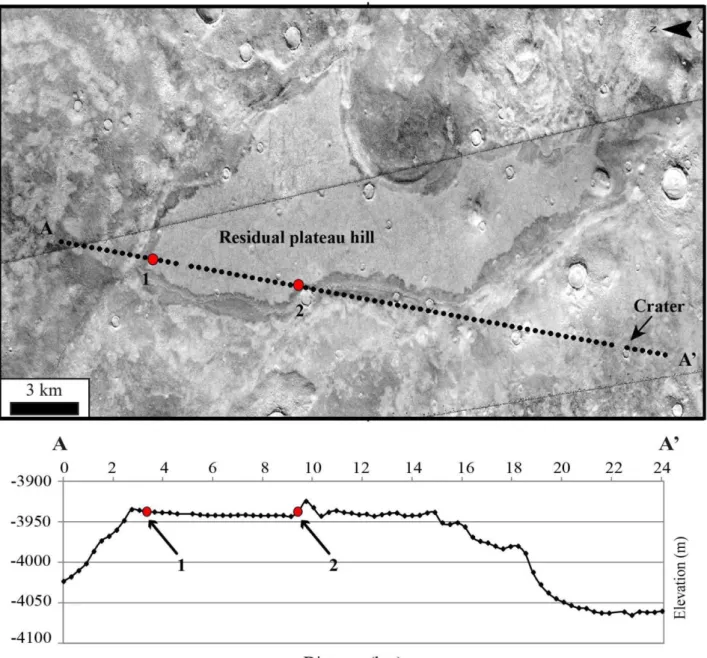
We also observed that lobes are oriented upslope of few degrees (Fig. 6), or on residual
95
hills plains (Fig. 7), reaching a maximum thickness of 10-20 m by using MOLA laser
96
shots (Costard et al., 2017). Occasionally, the characteristic alignments of
97
cones/mounds tend to distance themselves approaching the edge of the lobate TT unit
98
and do not show the characteristic high albedo small mound chains. Regardless, we
99
included them in the thumbprint terrain unit due to thermal inertia comparisons with
100
surrounding areas, lateral continuity and sparse presence of clusters or individual small
101
mounds. A general southeastward trend has been computed from the analysis of the
102
high albedo mounds (Fig. S1 - supplementary material), even if there are some lobes
103
with random direction because of first-order topographic influence (Fig. S2 -
104
supplementary material).
15 106
107
Figure 6. Longitudinal profile (A-A') and cross-section (B-B') of a southern limit lobate TT unit deposit from
108
MOLA DEM. ΔL=12000m; ΔH=138m. Lobate TT unit limits are marked by red dots on the image and on
109
profiles as well. Relative slope value is ≈ 0.70°. CTX images: P18_008112_2251; P18_007901_2250;
110
P18_008046_2253; P21_009338_2253. 111
16 112
Figure 7. Thumbprint terrain deposits can move upslope reaching plateau residual hills. Thumbprint
113
terrain limit that is marked by red dots on the image and on A-A' MOLA shots profile as well (CTX image:
114
B02_010261_2248). North is oriented 90 degrees left.
115
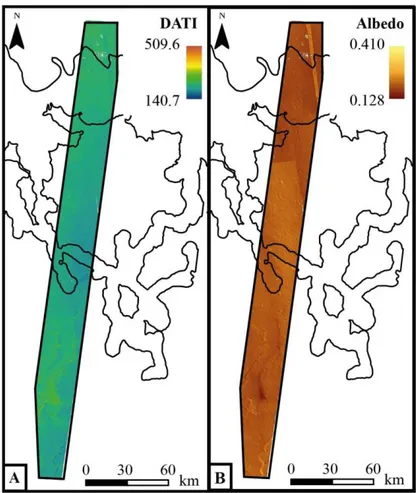
Thermal inertia was calculated based on the IR THEMIS data for the part of the
116
thumbprint terrain unit (marked by the black line on Fig. 8A). For this area, DATI values
117
ranges from 171 to 311 indicating fine particles (~40 – 500 μm: silt to medium sand)
118
with the average particle size of 125 μm (Fergason et al., 2006; Wentworth, 1922). An
119
average albedo of 0.19 (range 0.15-0.33) calculated for this region based on CTX
120
images further supports the presence of silt and fine sand. (Fig. 8 B).
121
17 123
Figure 8. Thermal inertia analysis. A) DATI (J m-2 K-1 s -1/2) values for the selected part of the study area
124
shown in Fig.2. B) albedo values. Lobate thumbprint terrain unit extension is marked by the black line.
125
The location of Fig. 8 is also shown in Fig.2. Top-left corner coordinates: 15°39'58.366"E;
126 49°41'20.171"N. 127 Material DATI (J m-2 K-1 s -1/2) Particle diameters (µm) Dust ~ 150 ~ 45 (silt) Sand ~ 200 ~ 160 (very fine sand/fine sand) 230-270 290 - 575 (medium sand) Rock 1200 128
Table 1. Comparative DATI values (J m-2 K-1 s -1/2)and particles diameters (µm) of selected materials
129
(after Fergason et al., 2006).
130
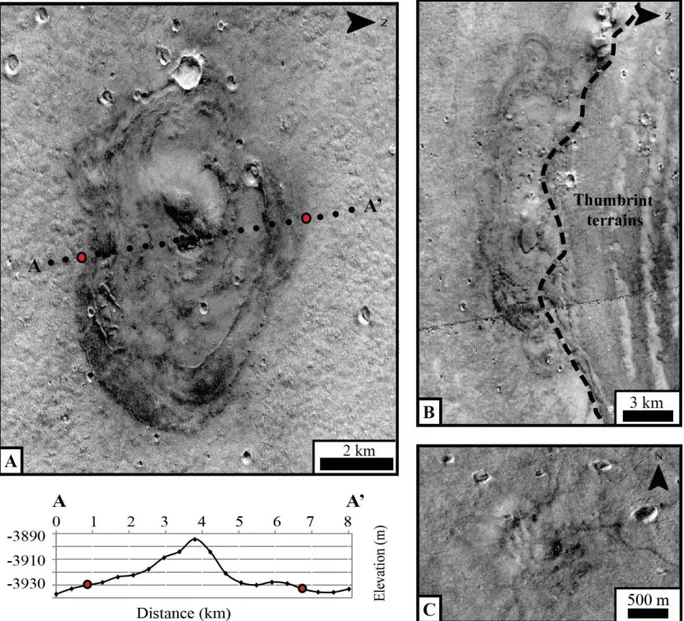
We observed several domes (10-12 kilometres in diameter) near or along the lobate TT
131
unit limit (Fig. 2), making their detection difficult inside thumbprint as the lobate TT unit
132
overlaps them (Fig. 9B). These morphologies are mostly elliptical, have an irregular and
133
lobate edge and show concentric features compared to the central peak (Fig. 9A; Fig.
134
9B). Smaller features (≈1km in diameter) are observed, but are almost circular and do
18
not show clear concentric lineaments (Fig. 9C). MOLA elevation profiles showed they
136
have a symmetric profile and heights of few tens of meters as shown in Fig. 9A.
137
Thermal inertia comparisons show that these domes are very bright in day-IR images
138
and darker in the night compared to the surrounding units (Fig. 10). This characteristic
139
is qualitatively similar to the response that thumbprint terrain has to night/day material
140
exposition. In fact, TT is also generally brighter in day-IR images, whereas it is darker
141
during night acquisition (Fig. 5).
142
143
Figure 9. Large domes underlying thumbprint terrain unit. A) MOLA laser shot cross-section cutting a
144
dome that is found outside thumbprint terrain unit. Central peak and some relating concentric 145
features are visible. The edge is elliptical and quite regular. The boundary is marked by red dots. 146
Dome height is ≈ 40m (CTX image: B17_016195_2250). North is oriented 90 degrees right. B) Dome
147
overlapped by thumbprint terrain. Black dashed line marks thumbprint terrain unit limit. Central peak,
148
some concentric features and an irregular and lobate edge are observed. (CTX image:
19
P21_009391_2238). North is oriented 90 degrees right. C) Small circular dome that does not show a
150
clear/regular limit or concentric features related to the centre (CTX image: G23_027087_2234).
151
152 153
Figure 10. Large domes several kilometres acrossunderlying thumbprint terrain unit in visible CTX-scale
154
(A). Thermal inertia response in day- and night-time acquisitions. THEMIS images show that domes are
155
brighter in daytime (B) and darker in night-time (C) compared to surrounding areas. Night-time image
156
resolution is lower than daytime image. CTX images: P21_009246_2240; G23_027087_2234.
157 158
5 Discussion 159
20
Since the most recent hypotheses have already provided a regional geological
160
framework for lobate deposits in Acidalia Planitia (Rodriguez et al, 2016; Costard et al,
161
2017; Costard et al., 2019 ), in the following paragraphs we will discuss and consider
162
the characteristics of thumbprint terrain to each of the main geological scenarios (i.e.,
163
pingoes, volcanic cones, liquefaction, mud-volcanoes, and tsunami-related deposits) in
164
order to reconcile and insert TT origin in the regional context.
165
Although the scenario of a periglacial environment has been put aside in favour of more
166
conceivable interpretations in the last years, Rodriguez et al. (2016) did not totally
167
dismiss this hypothesis because tsunami deposits could have frozen and formed a layer
168
of permafrost. Moreover, the presence of excess ejecta craters strengthens the
169
occurrence of an icy sub-surface layer that could also be responsible for surficial
170
geological processes as proposed for other geological processes in other areas on
171
Mars (Salese et al., 2016). However, pingoes are domical structures formed by freezing
172
and swelling of groundwater and are, therefore, composed by the same material as their
173
surroundings. Thus, the difference observed between the pitted mounds and the darker
174
adjacent areas in THEMIS images are not consistent with a pingo hypothesis (Fig. 5).
175
Furthermore, the growth of pingoes is accompanied by radial extension cracks (Mackay,
176
1973; 1998), which were not observed in any of our target features and deposits. The
177
high albedo mounds have been also interpreted as moraines, or ice-cored ridges
178
associated with a former glacial environment (Lucchitta, 1981; Rossbacher and Judson,
179
1981; Farrand and Gaddis, 2003), but their exact origin is still under debate. Herein, we
180
find the periglacial origin hypothesis problematic because of thermal inertia
181
comparisons with surrounding deposits (Fig. 5), material viscous behaviour that is not
182
consistent within a periglacial or glacial environment, and the lack of typical glacial
183
features such as polygons, cracks, eskers, drumlins and kettle holes.
184
Alternatively, over many decades, the associated underlying TT lobate deposits have
185
also been interpreted as lava flows flooded over a broad region forming a volcanic plain.
186
In this scenario, the high albedo mounds are interpreted in a variety of ways including:
187
1) rootless cones (pseudocraters) formed by explosions that resulted from a lava flow
188
advancing over a wet substrate (Frey and Jarosewich, 1982); 2) cinder cones formed by
189
explosion and deposition of ashes (Wood, 1979); or 3) tuff cones resulting from the
190
explosive interaction between rising magma and water/groundwater (Wohletz and
191
Sheridan, 1983). However, thumbprint terrain mounds are brighter than basaltic sands
21
in Acidalia (Farrand et al., 2005) and the DATI values of the TT are much lower than the
193
ones expected for lava flows (Fig. 8; Table 1). In addition, volcanic cones do not form in
194
arrangements that resemble patterns observed within TT. Based on the lack of these
195
conditions, we conclude that a volcanic origin of the thumbprint terrain is unlikely for TT
196
in southeastern Acidalia Planitia.
197
More recently, thumbprint terrain has also been interpreted as mud volcanoes which
198
formed after the freezing of an ancient standing body and/or rapid sedimentation and
199
diagenesis. The existence of a mud sheet flood has also been proposed for the northern
200
lowlands due to some hills and ground undulations in Isidis Planitia and Mare Australe
201
(Farrand et al., 2005; Oehler and Allen, 2010; Souček et al., 2015; Komatsu et al.,
202
2016). As outflow channels filled northern lowlands (Baker et al., 1991; Carr and Head,
203
2003), the following ice sublimation mostly depended on the accumulation rate of debris
204
on the surface. Sublimation residue would have formed the Vastitas Borealis Formation
205
units. Even a shallow layer of little debris thickness would have decreased sublimation
206
and favoured freezing (Farmer and Doms, 1979; Carr, 1990; Carr and Head, 2003):
207
both the gradual freezing and the load of the top debris layer make the internal pressure
208
rise. This could have led to mixtures of water, ice, rock/soil and mud expulsion on the
209
surface as proposed in Utopia Planitia in order to explain etched flows and polygonal
210
troughs (Ivanov et al., 2014). This model can also be applied to the thumbprint terrain in
211
Acidalia Planitia since geologic observations and settings are similar. The high albedo
212
mounds could be analogous to terrestrial mud volcanoes with a wide range of different
213
features from meter sized cones to domical structures hundreds of meters in size
214
(Kholodov, 2002) that are similar in lateral and vertical dimension to the Martian domes
215
and cones of the Acidalia region. However, thermal inertia and albedo values indicate a
216
widespread presence of fine sand and silt (mud?) size grains. The reason could be
217
explained by two fundamental factors that eventually interacted with each other. First,
218
detectable grain-size values might not match mud particle size anymore since the
219
material dried up and got indurated over the time. Ultimately, sandy mud volcanoes
220
have been found on Earth (Miyakawa et al., 2013) and, thus, this phenomenon cannot
221
be excluded either.
222
Furthermore, we need to take into account the coexistence of TT with lobate underlying
223
deposits which points to flows with a certain viscosity: the lobate deposits with
224
peripheral ridges clearly indicate that viscous material flowed inside southern valleys
22
(Fig. 6; Fig. 11; supplementary material) and that the plateau and hills were partially
226
flooded (Fig. 7; Fig. S1- supplementary files). Additionally, parallel and arcuate
227
alignments of mounds/cones (thumbprint terrain) observed together around obstacles
228
as knobs, residual hills, and plateaus (Fig. 1A, white arrow, Fig. S1- supplementary
229
files), perfectly follow the inferred underlying lobate deposits flow direction (Fig. 11, Fig.
230
S1 and Fig. S2- supplementary material). In the occurrence of an impact-generated
231
tsunami: obstacles might have first influenced flow direction and speed (tsunami wave
232
fronts), forming thumbprint terrain in parallel and curvilinear patterns. Nevertheless, an
233
impact-generated tsunami provides an explanation to the main concern about the
234
energy required to flow up slopes and reach topographic heights. In a previous work,
235
three craters (30-50 km in diameter) were proposed (Fig. S3 - supplementary files) as
236
the sources of the tsunami events, based on validated terrestrial models scaled to Mars
237
(wave height, propagation, run up elevation, and distance) (Costard et al., 2017). The
238
numerical tsunami simulations presented in Costard et al. (2017) link the TT alignments
239
to interference patterns produced from the interaction between the tsunami fronts and
240
the coastal topography. By binding the numeric simulation results to the morphological
241
observations, we assert that a tsunami event contributed to the formation of TT
mud-242
volcanoes.
243
On Earth, tsunamis move landward in a series of wave fronts (Lavigne et al., 2009),
244
whose energy and interaction with the shoreline topography results in different
245
inundation distances and distributions of lobate debris. Within the complex topography
246
of flat-floored valleys and plateaus along the Martian dichotomy boundary, the
247
interference of the multiple reflected and refracted waves that are observed in
248
simulations explain the flow distribution itself and the origin of the arcuate and parallel
249
pattern that characterizes the thumbprint terrain. Thumbprint terrain cones are not
250
observed in any terrestrial tsunami, but they are herein considered mud volcanoes that
251
formed as a consequence to an overpressure caused by rapid compaction upon
252
deposition of the transported material during the final stage of a tsunami. A similar
253
geological process was proposed for the emplacement of the Vastitas Borealis
254
Formation in both Chryse and Acidalia Planitia at the regional scale (Salvatore and
255
Christensen, 2014). According to this hypothesis, the Vastitas Borealis Formation would
256
be a product of extensive sedimentary modification both during and immediately after
257
outflow channel activity. Mud-extrusion would then result from burial and rapid
23
compaction of previously saturated deposits (Salvatore and Christensen, 2014). In our
259
study area, rapid compaction could have expelled a mixed water-mud material,
260
preferentially along the front, and would explain 1) the arcuate or random pattern of
261
thumbprint terrain reflecting the tsunami propagation when influenced by obstacles (Fig.
262
1A - white arrow) or not (Fig. 1A - black arrow), respectively and 2) the gradual
263
disappearance of TT cones toward the unit boundary as compaction, and hence
264
overpressure, should have decreased as the tsunami wave propagation progressively
265
lost energy and material while moving ‘landward’.
266
267 268
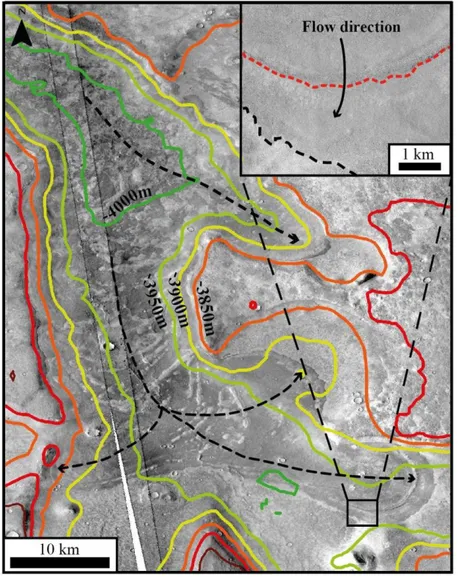
Figure 11. Lobes flow direction inferred from mounds alignments as marked by dashed black arrows.
269
Contour lines are 50 meters spaced. They show that flows clearly go upslope. g18_025425_2271;
270
b18_016498_2264. Inset: Thumbprint terrain flow exceeding valley scarp (dashed red line) for several
271
kilometers. Unit limit is marked by the red dashed line. The lobe has no peripheral ridges and its front is
272
lobate (HiRISE ESP_016498_2265).
273
On Earth, geophysical surveys and studies - across the continental margins of the Arctic
274
Ocean – continuously detect suites of hectometre/meter-wide seafloor mounds
24
accompanied with seepage due to the destabilization of gas hydrates (methane)
276
trapped in seafloor and permafrost-associated sediments (Serov et al., 2015, 2017;
277
Andreassen et al., 2017). Pressure is increased by released methane and triggers
278
blowouts through weakened zones. The Holocene marine transgression affected the
279
Arctic shelves and led to an extensive permafrost thawing; this is the reason why gas
280
hydrate degradation occurs primarily on the circum-Arctic Ocean continental shelves
281
(Macdonald, 1990; Lachenbruch, 1994; Maslin, 2010), where subsea permafrost
282
thawing and methane hydrate dissociation have been triggered by warming and
283
inundation since the Late Pleistocene. Seafloor mounds are steep-sided, up to 1100 m
284
wide, generally semi-circular to elliptical in plan view, and have an irregular upper
285
surface incised with straight or curved furrows. Since the mounds are elevated well
286
above the surrounding seafloor, the most plausible formation mechanism is either
287
deposition or uplift. However, the absence of any discernible seismic paleo-seafloor
288
favours the former hypothesis (Andreassen et al., 2017). We find it difficult to attribute
289
thumbprint terrain cones in Acidalia Planitia to these terrestrial shallow-water
sea-290
mounds considering the scale, mutual geographic distribution, timing of formation and
291
their absence in any terrestrial tsunami deposit since these Martian cones are smaller
292
and more densely coalesced (whether organized or not) than Earth’s features.
293
Therefore, TT mounds/cones are more likely thought as mud-volcanoes related to a
294
catastrophic event (tsunami) rather than a release of pressure that gradually
295
accumulated in the sub-surface due to sediment deposition. However, these terrestrial
296
gas blowouts cannot be ruled out for elliptical domes that have been observed outside
297
or under the thumbprint terrain unit (Fig. 2; Fig. 9) and must be further investigated to fit
298
the Acidalia Planitia thumbprint terrain and tsunami-related deposit. The same
299
qualitative thermal inertia response to daily temperature changes between elliptical
300
domes and thumbprint terrain mounds indicates that: 1) these features might be
301
composed by the same material reflecting the uniformity of lithologies in Acidalia
302
Planitia and 2) both elliptical domes and high albedo mound thumbprint terrain
303
alignments are qualitatively finer grained or more poorly consolidated than surrounding
304
areas. This behaviour fits well with average DATI values and conclusion (see section 4).
305
Therefore, elliptical domes may be the result of material extrusion (due to gradual
306
freezing and/or the load of top debris) prior to the extensive viscous flowing (tsunami
307
event) that led to the thumbprint terrain unit overlapping them and making dome
308
detection difficult inside the lobate TT unit.
25
New findings stated that some TT is too young to have experienced the ocean floor
310
environment, and, hence, a tsunami event, according to the current understanding of
311
the cryosphere depth and thermo-chemical structure of Mars (De Toffoli et al., 2019).
312
However, some areas of thumbprint terrain may be old enough to have experienced
313
tsunamis. In De Toffoli et al., 2019, 370 Ma may be the age of a possible ice-rich mantle
314
covering the older underlying TT deposit as it was observed in northern Arabia Terra
315
where a similar thumbprint terrain is covered by young ice-rich ejecta from Lyot crater
316
(48°33'42.72"N 18°12'46.78"E). Moreover, when dating surfaces and bedforms, it has
317
been observed that the floor ages of some Martian outflow channels generally equate to
318
younger mesoscale flows (several hundred meters to a few kilometers) instead of those
319
published in more general geologic maps reflecting older and regional scale processes
320
(Rodriguez et al., 2015). If alignments of cones in Acidalia Planitia were as recent as
321
those analysed in Arcadia Planitia (De Toffoli et al., 2019), their strict occurrence with
322
lobate flow deposits direction and highly organized patterns around obstacles (hills or
323
residual plateaus), matching a very older and distinct tsunami event flow, would be an
324
unusually fortunate coincidence. Consequently, this firmly underlines the importance of
325
investigating thumbprint terrain found in other areas of Mars. High-resolution images
326
may further distinguish multiple TT sets: i) analysing adjacent deposits and the
327
geological context in which they are formed, ii) evaluating origin and/or putative trigger
328
mechanisms discerning any morphological convergence.
329
The ocean hypothesis remains controversial and explanations have been put forward to
330
account for the presence of the TT in the absence of an ocean. For example, Skinner et
331
al. (2008) proposed that the propagation of seismic surface waves through northern
332
plains sedimentary units could have triggered liquefaction and run-up flows along the
333
margins of these deposits. In conclusion, given the morphology, the scale, the thermal
334
inertia analysis, the strict occurrence of thumbprint terrain within lobate deposits and
335
their congruous spatial arrangement with inferred lobes direction, and the significant
336
energy required to surmount little slopes, here we favour a tsunami-related origin for TT
337
in Acidalia Planitia, rather than simply a mud-volcanism deposit.
338
339
6 Conclusions 340
This paper renewed questions about the presence of a large standing body of water on
341
Mars by analysing thumbprint terrain, lobate morphologies and deposits in southeastern
26
Acidalia Planitia. The most likely hypothesis is a tsunami-related origin, as lobate TT
343
unit characteristics (e.g., viscosity, onslope flows, etc…), geological setting and numeric
344
simulations are comparable to terrestrial tsunami deposits. Lobate deposits inside
345
valleys, peripheral lobes and lateral ridges, as well as the energy required to surmount
346
little slopes, overlap valley walls and reach the plateau, fit well with a viscous flow of fine
347
material from the advance of a tsunami. Here, we interpret that these lobes are the
348
remnant of an impact-induced flow with high energy that produced a large inundation
349
subsequent to one or several tsunamis. In this context, thumbprint terrain would be
350
related to the final stage evolution of the tsunami wave propagation, i.e. mud volcanoes
351
that extruded water-mud mix material along the tsunami wave fronts. A wider coverage
352
of high-resolution data would improve our understanding and reveal new crucial
353
information in the ongoing debate of thumbprint terrain origin.
354
The presence
(
Parker et al., 1989, 1993; Head et al., 1998, 1999; Clifford and Parker,355
2001; Carr and Head, 2003; Tanaka et al., 2003, 2005), and eventual freezing (Ivanov
356
et al., 2014), of a former northern body of water, or a mud-ocean as Jöns (1987)
357
proposed, provides the geological context for thumbprint terrain as mud volcanoes
358
related to a tsunami event. In addition, crater counting showed that lobate TT unit is
359
Early Amazonian; 2.8 ± 0.2 Gyr according to Hartmann 2004-iteration (Fig. S4 -
360
supplementary files). This crater counting analysis is concordant to a crater-retention
361
age of 2.9 Gyr, proposed by Costard et al., 2017 for the same area, and to other
362
previous literature (Hiesinger et al. 2009) which corresponds to an Early
363
Amazonian/Late Hesperian ocean, in agreement with Parker et al., 1993. The Late
364
Hesperian is also the timing of peak outflow channel activity, and thus is consistent with
365
the presence of a transient northern ocean ~3 Ga.
366
Giving morphologies and scales, fully thermal inertia and albedo values compliance,
367
multiple impact craters possibility fitting numerical simulations, the occurrence of TT
368
with lobes, their congruous alignments with inferred lobes direction and in favour of a
369
general geological context, we herein mainly support the tsunami-driven mud-volcanoes
370
hypothesis rather than others mentioned above.
371
Acknowledgements 372
This research was partially conducted and supported by the Programme National de
373
Planétologie (PNP) of Institut National des Sciences de l’Univers (CNRS-INSU), the
374
Centre National d’Etudes Spatiales (CNES). The EXOMHYDR project within the TEAM
27
programme of the Foundation for Polish Science co-financed by the European Union
376
under the European Regional Development Fund (contract TEAM/2016-3/20). Our
377
gratitude also goes to Dr. Jakub Ciazela for contribution in the ATI method and
378
estimation of ATI errors. A special thanks goes to Professor Lucia Marinangeli who
379
supported us actively and made it possible to conclude the study.
380
381
References 382
Andreassen, K., Hubbard, A., Winsborrow, M., Patton, H., Vadakkepuliyambatta, S., Plaza-Faverola, A., 383
... & Mienert, J., 2017. Massive blow-out craters formed by hydrate-controlled methane expulsion 384
from the Arctic seafloor. Science, 356(6341), 948-953. 385
Baker, V. R., Strom, R. G., Gulick, V. C., Kargel, J. S., Komatsu, G., Kale, V. S., 1991. Ancient Oceans, 386
Ice Sheets and the Hydrological Cycle on Mars. Nature. 352, 589-594. 387
Bamberg, M., Asche, H., Jaumann, R., 2013. Additional tools for surface analysis in ArcGIS. EPSC 388
Abstracts Vol. 8, EPSC2013-435, 2013. European Planetary Science Congress 2013. 389
Bryant, E. A., 2001. Tsunami: The Underrated Hazard, pp. 320, Cambridge Univ. Press, Cambridge. 390
Buczkowski, D. L., Cooke, M. L., 2004. Formation of double-ring circular grabens due to volumetric 391
compaction over buried impact craters: Implications for thickness and nature of cover material in 392
Utopia Planitia, Mars. Journal of Geophysical Research: Planets. 109. 393
Buczkowski, D. L., Seelos, K. D., Cooke, M. L., 2012. Giant polygons and circular graben in western 394
Utopia basin, Mars: Exploring possible formation mechanisms. Journal of Geophysical Research-395
Planets. 117. 396
Catling, C., Leovy, C.B., Wood, S.E., Day, M.D., 2012. Does the Vastitas Borealis Formation contain 397
oceanic or volcanic deposits?: Third Conference on Early Mars: Geologic, Hydrologic, and Climatic 398
Evolution and the Implications for Life, 21–25 May 2012, Lake Tahoe, Nevada: LPI Contribution no. 399
1680, abstract 7031. 400
Carr, M.H., 1979. Formation of martian flood features by release of water from confined aquifers. J. 401
Geophys. Res. 84, 2995–3007. 402
Carr, M. H., 1986. Mars - a Water-Rich Planet. Icarus. 68, 187-216. 403
Carr, M. H., 1990. D/H on Mars Effects of Floods, Volcanism, Impacts, and Polar Processes. Icarus. 87, 404
210-227. 405
Carr, M.H., 1995. The Martian drainage system and the origin of valley networks and fretted channels. 406
Journal of Geophysical Research: Planets, 100(E4), pp.7479-7507.
407
Carr, M. H., Head, J. W., 2003. Oceans on Mars: An assessment of the observational evidence and 408
possible fate. Journal of Geophysical Research-Planets. 108. 409
Christensen, P. R., Jakosky, B. M., Kieffer, H. H., Malin, M. C., McSween, H. Y., Nealson, K., ... & Ravine, 410
M., 2004. The thermal emission imaging system (THEMIS) for the Mars 2001 Odyssey Mission. 411
Space Science Reviews, 110(1-2), 85-130.
412
Citron, R., Manga, M. & Hemingway, D., 2018. Timing of oceans on Mars from shoreline deformation. 413
Nature 555, 643–646 doi:10.1038/nature26144 414
Clifford, S. M., Parker, T. J., 2001. The evolution of the Martian hydrosphere: Implications for the fate of a 415
primordial ocean and the current state of the northern plains. Icarus. 154, 40-79. 416
Cooke, M., Islam, F., McGill, G., 2011. Basement controls on the scale of giant polygons in Utopia 417
Planitia, Mars. Journal of Geophysical Research-Planets. 116. 418
28 Costard, F., Séjourné, A., Lagain, A., Ormö, J., Rodriguez, J. A. P., Clifford, S., et al., 2019. The 419
Lomonosov crater impact event: A possible mega‐tsunami source on Mars. Journal of Geophysical 420
Research: Planets, 124, 1840– 1851. https://doi.org/10.1029/2019JE006008. 421
Costard, F., Séjourné, A., Kelfoun, K., Clifford, S., Lavigne, F., Di Pietro, I., Bouley, S., 2017. Modeling 422
tsunami propagation and the emplacement of thumbprint terrain in an early Mars ocean, Journal of 423
Geophysical Research-Planets. 122. 424
De Toffoli, B., Pozzobon, R., Massironi, M., Mazzarini, F., Conway, S., & Cremonese, G., 2019. Surface 425
Expressions of Subsurface Sediment Mobilization Rooted into a Gas Hydrate-Rich Cryosphere on 426
Mars. Scientific reports, 9(1), 8603. doi:10.1038/s41598-019-45057-7. 427
Farmer, C. B., Doms, P. E., 1979. Global seasonal variation of water vapor on Mars and the implications 428
for permafrost. J. Geophys. Res. 84, 2881–2888. 429
Farrand, W.H., Gaddis, L .R. , 2003. THEMIS Observations of Pitted Cones in Acidalia Planitia and 430
Cydonia Mensae, Sixth International Conference on Mars, #3094. 431
Farrand, W. H., Gaddis, L. R., Keszthelyi, L., 2005. Pitted cones and domes on Mars: Observations in 432
Acidalia Planitia and Cydonia Mensae using MOC, THEMIS, and TES data. Journal of Geophysical 433
Research-Planets. 110. 434
Fergason, R. L., Christensen, P. R., Kieffer, H. H., 2006. High-resolution thermal inertia derived from the 435
Thermal Emission Imaging System (THEMIS): Thermal model and applications. Journal of 436
Geophysical Research-Planets. 111. 437
Frey, J. V., Jarosewich, M., 1982. Subkilometer Martian volcanoes: Properties and possible terrestrial 438
analogs, J. Geophys. Res., 87(B12),9867–9879, doi:10.1029/JB087iB12p09867. 439
Greeley, R., Guest, J.E., 1987. Geologic map of the eastern equatorial region of Mars, 1:15,000,000 440
scale. US Geological Survey Geol. Inv. Ser., Map I-1802-B. 441
Grizzaffi, P., Schultz, P. H., 1989. Isidis Basin - Site of Ancient Volatile-Rich Debris Layer. Icarus. 77, 442
358-381. 443
Hartmann, W.K. and Neukum, G., 2001. Cratering chronology and the evolution of Mars. In Chronology 444
and evolution of Mars (pp. 165-194). Springer, Dordrecht.
445
Head, J. W., Hiesinger, H., Ivanov, M. A., Kreslavsky, M. A., Pratt, S., Thomson, B. J., 1999. Possible 446
ancient oceans on Mars: Evidence from Mars Orbiter Laser Altimeter data. Science. 286, 2134-447
2137. 448
Head, J. W., et al., 1998. Oceans in the past history of Mars: Tests for their presence using Mars Orbiter 449
Laser Altimeter (MOLA) data. Geophysical Research Letters. 25, 4401-4404. 450
Heipke, C., Oberstb, J., Albertze, J., Attwenger, M., P. Dorninger, P., E. Dorrer, Ewe, M., Gehrke, S., 451
Gwinner, K., Hirschmüller, H., Kim, J.R., Kirk, R.L., Mayer, H., Muller, J.P., Rengarajan, R., 452
Rentsch, M., Schmidt, R., Scholten, F., Shani, J., Spiegel, M., Wählisch, M., Neukum, G., & the 453
HRSC Co-Investigator Team (2007). Evaluating planetary digital terrain models—The HRSC DTM 454
test, Planetary and Space Science, 55 (14), 2173-2191, doi.org/10.1016/j.pss.2007.07.006. 455
Hiesinger, H., Rohkamp, D., Sturm, S., Thiessen, F. and Reiss, D., 2009.Thumbprint Terrain in Isidis 456
Planitia, Mars: Geology, Ages, Morphology, and Morphometry. In EGU General Assembly 457
Conference Abstracts (Vol. 11, p. 7812).
458
Jaumann, R., Neukum, G., Behnke, T., Duxbury, T.C., Eichentopf, K., Flohrer, J., Gasselt, S.V., Giese, 459
B., Gwinner, K., Hauber, E. and Hoffmann, H., 2007. The high-resolution stereo camera (HRSC) 460
experiment on Mars Express: Instrument aspects and experiment conduct from interplanetary 461
cruise through the nominal mission. Planetary and Space Science, 55(7-8), pp.928-952. 462
Jöns, H. P., 1987. Large fossil mud lakes or giant mud sheet floods in Syrtis Major (Isidis Planitia) and 463
Mare Australe. Mars. Lunar. Planet. Sci. 18,470-471. 464
Iijima, Y., Goto, K., Minoura, K., Komatsu, G. and Imamura, F., 2014. Hydrodynamics of impact-induced 465
tsunami over the Martian ocean. Planetary and Space Science, 95, pp.33-44. 466
29 Ivanov, M. A., Hiesinger, H., Erkeling, G., Reiss, D., 2014. Mud volcanism and morphology of impact 467
craters in Utopia Planitia on Mars: Evidence for the ancient ocean. Icarus. 228, 121-140. 468
Ivanov, M. A., Hiesinger, H., Erkeling, G., Reiss, D., 2015. Evidence for large reservoirs of water/mud in 469
Utopia and Acidalia Planitiae on Mars. Icarus. 248, 383-391. 470
Kargel, J. S., Baker, V. R., Begét, J. E., Lockwood, J. F., Péwé, T. L., Shaw, J. S., & Strom, R. G., 1995. 471
Evidence of ancient continental glaciation in the Martian northern plains. Journal of Geophysical 472
Research: Planets, 100(E3), 5351-5368.
473
Kargel, J. S., Strom, R. G., 1992. Ancient Glaciation on Mars. Geology. 20, 3-7. 474
Kneissl, T., van Gasselt, S., & Neukum, G., 2011. Map-projection-independent crater size-frequency 475
determination in GIS environments—New software tool for ArcGIS. Planetary and Space Science, 476
59(11-12), 1243-1254.
477
Kholodov, V. N., 2002. Mud volcanoes, their distribution, regularities, and genesis: Communication 1. 478
Mud volcanic provinces and morphology of mud volcanoes. Lithol. Miner. Resour., 27, 197– 209. 479
Komatsu, G., Okubo, C. H., Wray, J. J., Ojha, L., Cardinale, M., Murana, A., ... & Gallagher, R., 2016. 480
Small edifice features in Chryse Planitia, Mars: assessment of a mud volcano hypothesis. Icarus, 481
268, 56-75.
482
Kreslavsky, M. A., Head, J. W., 2002. Fate of outflow channel effluents in the northern lowlands of Mars: 483
The Vastitas Borealis Formation as a sublimation residue from frozen ponded bodies of water. 484
Journal of Geophysical Research-Planets. 107. 485
Lachenbruch, A. H., 1994. Permafrost, the active layer, and changing climate. Washington, DC: US 486
Geological Survey. 487
Lavigne, F., Paris, R., Grancher, D., Wassmer, P., Brunstein, D., Vautier, F., ... & Gomez, C., 2009. 488
Reconstruction of tsunami inland propagation on December 26, 2004 in Banda Aceh, Indonesia, 489
through field investigations. Pure and Applied Geophysics, 166(1-2), 259-281. 490
Lockwood, J. F., Kargel, J. S., Strom, R. B., 1992. Thumbprint Terrain on the Northern Plains: A Glacial 491
Hypothesis. Abstracts of the Lunar and Planetary Science Conference, volume 23, page 795. 492
Lucchitta, B. K., 1981 . Mars and Earth: Comparison of cold-climate features. Icarus, 45, 264–303, 493
doi:10.1016/0019-1035(81)90035-X. 494
MacDonald, G. J., 1990. Role of methane clathrates in past and future climates. Climatic Change, 16(3), 495
247-281. 496
Mackay, J. R., 1973. The growth of pingos, western Arctic coast, Canada, Can. J. Earth Sci., 10, 979– 497
1004. 498
MacKay, J. R., 1998. Pingo growth and collapse, Tuktoyaktuk Peninsula area, western arctic coast, 499
Canada: A long-term field study. Geogr. Phys. Quat., 52, 1– 53. 500
Malin, M. C., Bell, J. F., Cantor, B. A., Caplinger, M. A., Calvin, W. M., Clancy, R. T., ... & Lee, S. W., 501
2007. Context camera investigation on board the Mars Reconnaissance Orbiter. Journal of 502
Geophysical Research: Planets, 112(E5)..
503
Malin, M. C., Edgett, K. S., 2001. Mars Global Surveyor Mars Orbiter Camera: Interplanetary cruise 504
through primary mission. Journal of Geophysical Research-Planets. 106, 23429-23570. 505
Mangold, N., Allemand, P., Duval, P., Geraud, Y., Thomas, P., 2002. Experimental and theoretical 506
deformation of ice-rock mixtures: Implications on rheology and ice content of Martian permafrost. 507
Planetary and Space Science. 50, 385-401. 508
Maslin, M., Owen, M., Betts, R., Day, S., Dunkley Jones, T., & Ridgwell, A., 2010. Gas hydrates: past and 509
future geohazard? Philosophical Transactions of the Royal Society A: Mathematical, Physical and 510
Engineering Sciences, 368(1919), 2369-2393. 511
McEwen, A. S., Eliason, E. M., Bergstrom, J. W., Bridges, N. T., Hansen, C. J., Delamere, W. A., ... & 512
Kirk, R. L., 2007. Mars reconnaissance orbiter's high resolution imaging science experiment 513
(HiRISE). Journal of Geophysical Research: Planets, 112(E5). 514