The Effect of Medicaid on Management of Depression:
Evidence From the Oregon Health Insurance Experiment
The MIT Faculty has made this article openly available. Please share
how this access benefits you. Your story matters.
Citation Becker, Katherine et al. "The Effect of Medicaid on Management
of Depression: Evidence From the Oregon Health Insurance Experiement." The Milbank Quarterly 96 ,1 (March 2018): 29-56 © 2018 Milbank Memorial Fund
As Published http://dx.doi.org/10.1111/1468-0009.12311
Publisher Wiley
Version Original manuscript
Citable link https://hdl.handle.net/1721.1/123683
Terms of Use Creative Commons Attribution-Noncommercial-Share Alike
THE EFFECT OF MEDICAID ON MANAGEMENT OF DEPRESSION:
EVIDENCE FROM THE OREGON HEALTH INSURANCE EXPERIMENT
Katherine Baicker, PhD * Harvard University Heidi L. Allen, PhD Columbia University
Bill J. Wright, PhD Providence Health and Services
Sarah L. Taubman, ScD
National Bureau of Economic Research Amy N. Finkelstein, PhD
MIT
August 2017
* Corresponding author: Katherine Baicker, Harris School of Public Policy, University of Chicago, 1155 E. 60th St,
Chicago, IL 60637; kbaicker@uchicago.edu. We are grateful to Alisa Busch for her helpful comments and advice, and to InnessaColaiacovo, Daniel Prinz, Allyson Barnett, Belinda Tang, and Kathryn Clark for expert research assistance, to the survey research team at CORE, to numerous Oregon state employees for help acquiring the necessary data and for answering our many questions about the administration of state programs, and to our generous funders.
We gratefully acknowledge funding for the Oregon Health Insurance Experiment from the Assistant Secretary for Planning and Evaluation in the Department of Health and Human Services, the California HealthCare Foundation, the John D. and Catherine T. MacArthur Foundation, the National Institute on Aging (P30AG012810,
RC2AGO36631 and R01AG0345151), the Robert Wood Johnson Foundation, the Sloan Foundation, the Smith Richardson Foundation, and the U.S. Social Security Administration (through grant 5 RRC 08098400-03-00 to the National Bureau of Economic Research as part of the SSA Retirement Research Consortium). We also gratefully acknowledge Centers for Medicare and Medicaid Services’ matching funds for this evaluation. The findings and conclusions expressed are solely those of the authors and do not represent the views of SSA, the National Institute on Aging, the National Institutes of Health, any agency of the Federal Government, any of our funders, or the NBER.
THE EFFECT OF MEDICAID ON MANAGEMENT OF DEPRESSION:
ABSTRACT
Context: Expanding Medicaid to previously-uninsured adults has been shown to increase
detection and reduce the prevalence of depression, but the ways that Medicaid affects mental health care, how effectively it addresses unmet needs, and how those effects differ for those with and without a history of depression remain unclear.
Methods: We take advantage of Oregon’s Medicaid lottery to gauge the causal effects of
Medicaid coverage using a randomized controlled design, drawing on both primary and administrative data sources.
Findings: Medicaid coverage reduced the prevalence of undiagnosed depression by almost 50%
and untreated depression by more than 60%. It increased use of medications frequently prescribed to treat depression and related mental health conditions and reduced the share of respondents reporting unmet mental health care needs by almost 40%. The share of respondents screening positive for depression dropped by 9.2 percentage points overall, and by 13.1 for those with pre-existing depression diagnoses, with greatest relief in symptoms seen primarily in feeling down or hopeless, feeling tired, and trouble sleeping – consistent with the increase observed not just in medications targeting depression but also in those targeting sleep.
Conclusions: Medicaid coverage had significant effects on the diagnosis, treatment, and
outcomes of a population with substantial unmet mental health needs. Coverage increased access to care, reduced the prevalence of untreated and undiagnosed depression, and
substantially improved the symptoms of depression. There are likely to be substantial mental health consequences of policy decisions about Medicaid coverage for vulnerable populations.
KEYWORDS
Medicaid, insurance, depression, mental health
POLICY POINTS
• We take advantage of Oregon’s Medicaid lottery to gauge the causal effects of Medicaid coverage on mental health care, how effectively it addresses unmet needs, and how those effects differ for those with and without a history of depression.
• Medicaid coverage reduced the prevalence of undiagnosed depression by almost 50% and untreated depression by more than 60%. It increased use of medications and reduced the share of respondents reporting unmet mental health care needs by almost 40%.
• There are likely to be substantial mental health consequences of policy decisions about Medicaid coverage for vulnerable populations.
I
NTRODUCTION1
Almost one third of low-income Americans report having been diagnosed with 2
depression – twice the rate of the nation overall.1 Depression has been correlated with worse
3
health and lower quality of life, along with increased health care use.2-6 Effective treatments for
4
depression exist, but the uninsured are less likely to have their depression treated than those with 5
Medicaid.7 Medicaid coverage may thus result in substantial improvements in depression and
6
quality of life, but because of the many differences between Medicaid enrollees and the 7
uninsured, the causal connections between insurance coverage, treatment, and outcomes are 8
difficult to discern. At a time when policy-makers are reevaluating the scope of Medicaid 9
coverage, better information about the effects of Medicaid on mental health care and outcomes is 10
crucial. 11
In 2008, Oregon allocated by random lottery a limited number of slots in its Medicaid 12
program for low-income adults. This lottery provides a unique opportunity to study the effects 13
of Medicaid coverage without the influence of confounding factors that otherwise plague 14
comparisons of insured to uninsured populations. In previous analyses using the lottery, we 15
found that Medicaid coverage increased health care use (including primary, hospital, prescription, 16
and emergency department care); improved financial security (although had no significant effect 17
on employment or earnings); and improved self-reported health and mental health but had no 18
detectable effects on several measures of physical health.8-11 In particular, we found that
19
Medicaid coverage decreased the probability of screening positive for depression by 9.15 20
percentage points (95% CI: -16.70 to -1.60; p=0.018), a relative reduction of 30 percent, and 21
found a borderline-significant increase in use of broadly related medications.8
In this paper, we explore in more detail the ways in which Medicaid coverage affected 1
the diagnosis, treatment, and symptoms of depression, and the degree to which Medicaid 2
successfully met mental health needs. Oregon’s Medicaid program covered inpatient care, 3
outpatient care (including some psychotherapy), and psychiatric prescription drugs with no 4
copayments. We examine the effect of insurance on the prevalence of undiagnosed and untreated 5
depression, use of different treatments and specific mental health medications, and a range of 6 depressive symptoms. 7 8
M
ETHODS 9 Medicaid Lottery 10Oregon held a series of lottery draws in 2008 from a waiting list of approximately 90,000 11
people to allocate 10,000 available slots in Oregon Health Plan (OHP) Standard. Those selected 12
were enrolled in Medicaid if they completed the application and met eligibility requirements. 13
OHP Standard provided benefits to low-income adults who were not categorically eligible for 14
Oregon’s traditional Medicaid program. To be eligible, individuals must have been aged 19 to 64, 15
Oregon residents, U.S. citizens or legal immigrants, without health insurance for 6 months, and 16
not otherwise eligible for Medicaid or other public insurance. They must have had income below 17
the federal poverty level and less than $2000 in assets. OHP Standard provided relatively 18
comprehensive medical benefits (including prescription drug coverage) with no consumer cost 19
sharing and low monthly premiums (between $0 and $20, based on income), administered 20
mostly through managed care organizations. The lottery process and OHP Standard, the data 21
sources on which we draw, and the statistical methods we deploy are described in much more 22
detail elsewhere.8-11
23 24
Data Sources
1
Lottery and Medicaid Enrollment 2
The state provided us with the initial lottery list and with detailed data on Medicaid 3
enrollment for every individual on the list. The list comprises our study population, as 4
summarized in Appendix Figure A1. We use these data to construct our primary measure of 5
insurance coverage during the study period. 6
7
In-Person Interviews and Clinical Assessments 8
Between September 2009 and December 2010, we conducted a large in-person data 9
collection effort to assess a wide variety of outcomes. The 20,745-person sample for the in-10
person data collection included almost all of the individuals selected in the lottery living in the 11
Portland area and a roughly equal number of unselected controls. The collected data includes 12
answers from the 12,229 respondents to a detailed questionnaire, including administration of the 13
PHQ-8 scale.12-14
14
The in-person interview also included a catalog of medications in participants’ possession. 15
Medications were categorized using a commercially available prescription drug database (First 16
DataBank). Our medication data thus capture only medication possession at a specific point in 17
time, not adherence or prescriptions that lapsed or went unfilled. Appendix Table A1 provides 18
additional detail on the mental health medications possessed by study participants. 19
We use these data for almost all of our outcome measures as well as to classify 20
individuals on the basis of pre-lottery diagnosis of depression. Additional data sources used in 21
ancillary analyses are described in the Appendix. 22
Statistical Analysis
1
Our analysis relies on the lottery’s random assignment to generate unbiased estimates of 2
the effect of Medicaid on outcomes. Not all adults selected in the lottery successfully enrolled in 3
Medicaid (with some of those selected not completing the application and some of those 4
applying ultimately deemed ineligible). 5
The subgroup of those selected in the lottery who went on to be enrolled is not 6
comparable to the overall group not selected in the lottery, so simple comparisons of those 7
actually enrolled to the control group would not provide valid causal estimates of the effects of 8
Medicaid. Rather, we used a standard instrumental variables approach to gauge the effect of 9
gaining Medicaid coverage through the lottery on subsequent health care use and depression 10
outcomes. The estimates shown in Tables 2-4 represent the local average treatment effect of 11
Medicaid coverage, using selection in the lottery as an instrument for coverage. 12
The methods used here follow those of our prior quantitative analyses very closely, and 13
are detailed in the Appendix. Most analyses were pre-specified and publicly archived in advance 14
of completing any outcomes analyses; analyses that were not pre-specified are marked in the 15
tables with a carat (^). In all analyses we cluster the standard errors by household since the
16
treatment is at the household level. All analyses of outcomes from the survey data are weighted 17
using survey weights to account for survey fielding methods. 18
19
Sample Characteristics and Insurance Coverage
20
12,229 individuals completed an interview by October 13, 2010 (effective response rate = 21
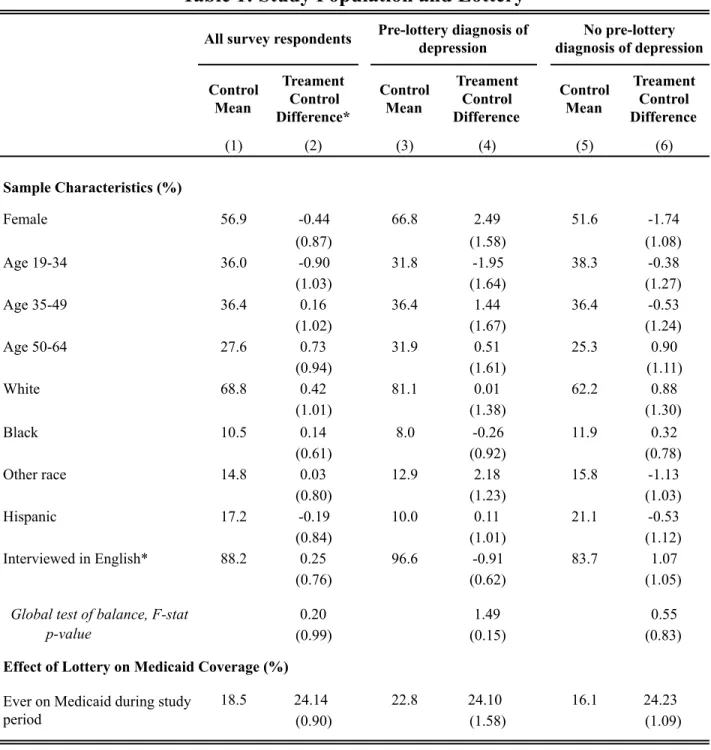
73%; see Appendix Figure A1). Table 1 describes the limited baseline demographics collected 22
on the lottery list itself, confirming the expected balance between treatment and control groups. 23
Just over half the study participants are women, about a quarter are ages 50-64 (the oldest 1
eligible age group), and about 70 percent are white. 2
In addition to the full sample of in-person respondents, we also focus on those 3
respondents who report having received a diagnosis of depression that was made prior to the 4
lottery (34 percent of the sample). This categorization is based on the recollection of 5
respondents at the time of the in-person interview. In theory, recollections about diagnoses made 6
before the lottery could differ between those selected and those not selected (even though actual 7
pre-lottery experiences should not, because of the random selection); these recollections are, 8
however, balanced across treatments and controls (difference -0.80; p=0.40). 9
The categorization of those with a pre-lottery diagnosis of depression captures both the 10
individual having experienced a depressive episode in the past and the individual having had that 11
depression recognized and diagnosed by a healthcare professional. Thus, given the recurrent 12
nature of depression, this subgroup is one with a higher risk of depression during the study 13
period. It is also, however, likely a subgroup with greater connection to the healthcare system 14
(as evidenced by having received a diagnosis) and willingness to discuss depressive symptoms 15
with a healthcare provider. 16
Those with a pre-lottery diagnosis of depression are more likely to be female, which is 17
consistent with the higher rates of depression in women in general.15 They are also slightly older,
18
more likely to be of white race, and more likely to have been interviewed in English. 19
Table 1 also shows the relationship between being selected in the lottery and being 20
covered by Medicaid. For in-person survey responders, lottery selection increased the probability 21
of ever being covered by Medicaid during the study period (between March 10, 2008 and the 22
individual’s interview date) among those selected relative to the control group by 24.1 23
percentage points . Self-reports at the time of the interview show no change in private insurance 1
coverage. Control group Medicaid coverage rates are higher overall in the subgroup with a pre-2
lottery diagnosis of depression, but the increase in coverage generated by the lottery is not 3
significantly different between those with and without pre-lottery depression diagnoses. 4
5
Limitations
6
There are of course several limitations to this analysis. First, while the random 7
assignment generated by the lottery yields strong internal validity for causal estimates of the 8
effects of Medicaid expansion, there are limits to external generalizability. Second, our 9
measures of medication possession do not allow us to analyze adherence to medication; rather, 10
they are a snapshot at a particular point in time. Third, we have limited information on the types 11
of treatment for depression study subjects may have received. Thus, while our analyses yield 12
strong evidence of the effects of Medicaid on a number of aspects of the care of and outcomes 13
for depression for this population, there remain important questions about the effects of different 14
types of insurance coverage and specific courses of treatment. 15
16
R
ESULTS17
Diagnosis and Treatment of Depression
18
Diagnosis 19
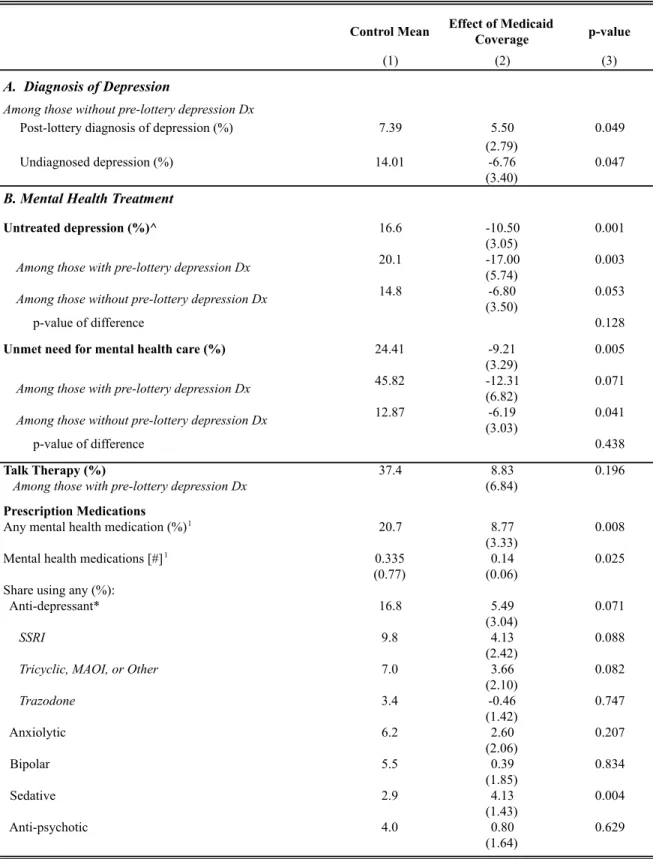
Table 2, Panel A reports the impact of Medicaid on the diagnosis and treatment of 20
depression, overall and separately for those with and without pre-lottery diagnoses of depression. 21
The top panel focuses on the diagnosis of depression among the sample that reported not having 22
such a diagnosis before the lottery (N=8,063). Medicaid increased the chance of receiving a 23
depression diagnosis from a health care provider during the post-lottery study period by 5.5 24
percentage points (relative to 7.4 percent of the control group; p=.049). Medicaid also decreased 1
the prevalence of undiagnosed depression (defined as having a PHQ-8 score of 10 or higher at 2
the time of the interview, but reporting not having received a diagnosis of depression) by 6.8 3
percentage points (relative to 14.0 percent of the control group; p=.047). 4
5
Treatment 6
Table 2, Panel B explores the effect of Medicaid on mental health treatments. Medicaid 7
reduced the share of the population with untreated depression (defined as having a PHQ-8 score 8
of 10 or higher at the time of the interview, but not reporting receiving talk therapy or having 9
related medications)14 by 10.5 percentage points (relative to the control group mean of 16.6,
10
p=.001). It virtually eliminated untreated depression among those with a pre-lottery diagnosis (-11
17.0, relative to control group mean of 20.1, p=.003). 12
We have previously reported that Medicaid reduced the prevalence of unmet need for 13
health care (defined as needing health care and not having that need fully met) by 10.7 14
percentage points (relative to a control group average of 39.0, p=.004).8 The next rows examine
15
unmet need for mental health care in particular. 24.4 percent of the control group overall 16
reported not getting all the mental health care they needed, while 45.8 of the control group with a 17
pre-lottery depression diagnosis reported such unmet need. Medicaid reduced unmet need for 18
mental health care by 9.2 percentage points overall (p=.005), by 12.3 percentage points for those 19
with pre-lottery depression diagnoses (insignificant, p=.07), and by 6.2 percentage points for 20
those without (p=.04). Appendix Table A2 shows additional detail on health care utilization 21
based on pre-lottery depression diagnosis. 22
The lower rows report Medicaid’s impact on treatment rates, including psychotherapy 23
and medications. Only those with a pre-lottery diagnosis of depression were asked about use of 24
psychotherapy. 37.4 percent of the control group reported receiving psychotherapy in the last 1
year, with Medicaid increasing that share by an insignificant 8.8 percentage points (p=.196). 2
We next show use of mental health medications (with drugs and categories described in 3
more detail in the Appendix). 20.7 percent of the control sample is taking at least one of these 4
drugs, and Medicaid increases that share by 8.8 percentage points (p=.008). A similar pattern 5
holds for the number of medications. 6
The next rows break out these medications into several categories. Examined at this level 7
of granularity, there are substantial changes primarily in the use of antidepressants (but only of 8
borderline statistical significance) and sedatives. Anti-depressant use is quite common overall 9
(16.8 percent of control respondents), and Medicaid increases anti-depressant use by 5.49 10
percentage points (p=.07), but with only marginal statistical significance, consistent with our 11
prior findings examining a broader group of medications.8 As shown in Appendix Table A3, this
12
increase is statistically significant for the subset of respondents with pre-lottery diagnoses of 13
depression. 14
Depression is often comorbid with other mental health conditions,15 so we also examine
15
the use of medications for anxiety, bipolar disorder, psychosis, and the use of sedatives. These 16
other types of mental health medications are used less commonly than anti-depressants, and only 17
the use of sedatives changes significantly with Medicaid, increasing by 4.13 (relative to the 18
control group average of 2.9, p =.004). As shown in Appendix Table A3, there are no 19
statistically significant differences in the effects of Medicaid on medication use for those with 20
versus without pre-lottery depression diagnoses. 21
Symptoms of Depression
1
In previous work, we found that Medicaid coverage substantially reduced the prevalence 2
of depression.8 In Table 3 we explore in more detail the effects of insurance on the symptoms of
3
depression, and whether the effects differ by history of depression (as measured by pre-lottery 4
diagnosis). 5
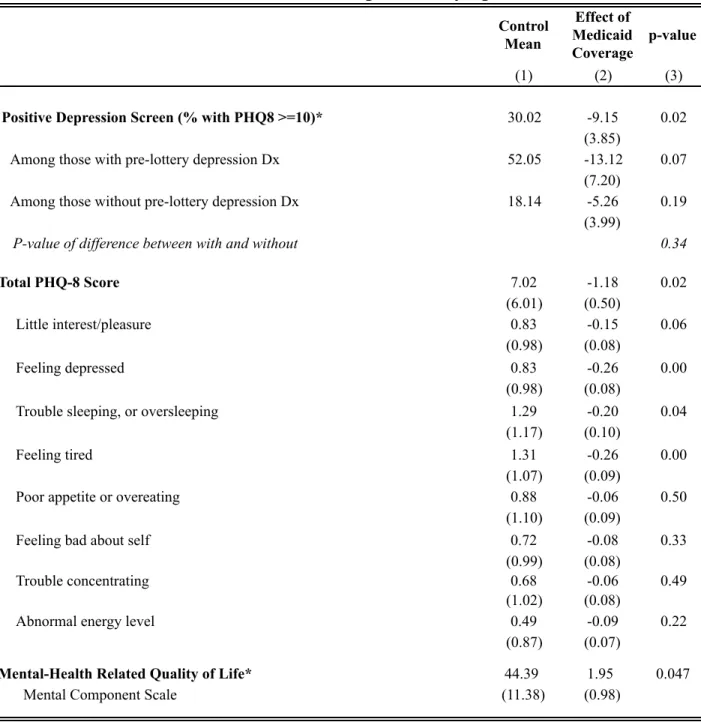
First, we show the effect of Medicaid on screening positive for depression (PHQ-8 score 6
of 10 or more 14) at the time of the interview. Depressive symptoms are quite common in this
7
population. Overall, 30 percent of controls screened positive for depression, compared to less 8
than 9 percent nationally.16 That rate dropped by 9.15 percentage points (p=.02) for those
9
gaining Medicaid through the lottery. 10
The prevalence of depressive symptoms is substantially higher for individuals with a pre-11
lottery diagnosis of depression, with 52 percent of controls screening positive for depression, 12
compared to 18 percent of controls with no pre-lottery diagnosis of depression. The effect of 13
Medicaid on depression was not statistically significantly different for those who had received a 14
diagnosis of depression before the lottery (-13.1, p=.07) versus those who had not (-5.26, p=.19) 15
(p-value of difference=.34). 16
Next, we examine which symptoms of depression changed in response to Medicaid 17
coverage, using the components of the PHQ-8 questionnaire.16 Medicaid coverage significantly
18
reduced depressive symptoms (1.18 point drop in PHQ-8 score relative to control mean 7.02, 19
p=.019), primarily through decreases in symptoms of having little interest or pleasure, feeling 20
depressed, sleep problems, and feeling tired. Scoring poorly on the first two of these is 21
considered particularly important for a clinical diagnosis of depression.12 The bottom rows
22
report the effects of Medicaid on an alternate instrument, the mental health component of the 8-23
question Medical Outcomes Study Short-Form (SF-8) to assess health-related quality of life,17
1
where we also see an improvement in overall scores. 2
3
DISCUSSION 4
Depression poses a major health burden to low income populations. More than 30% of 5
our control group of largely uninsured low-income adults screened positive for depression, and 6
24% reported unmet mental health needs. Amid discussion of the fate of Medicaid coverage, 7
better information is needed about the role of Medicaid in the diagnosis, treatment, and 8
alleviation of the symptoms of depression. 9
Using the unique opportunity presented by the Oregon Medicaid lottery, we assess the 10
effect of Medicaid coverage on depression care and outcomes. Medicaid coverage significantly 11
increased the diagnosis and treatment of depression, reducing the prevalence of undiagnosed 12
depression by almost 50% and untreated depression by more than 60%. It increased use of 13
medications frequently prescribed to treat depression and related mental health conditions, and 14
reduced the share of respondents reporting unmet mental health care needs by almost 40%. 15
These changes are consistent with the substantial drop in depression seen in those gaining 16
access to Medicaid through the lottery. The share of respondents in whom we observed positive 17
depression screens dropped by 9.2 percentage points overall, and by 13.1 for those with pre-18
existing diagnoses of depression. The greatest relief in symptoms was seen primarily in feeling 19
depressed, feeling tired, and trouble sleeping – consistent with the increase observed not just in 20
medications targeting depression but also those targeting sleep. 21
There are several limitations to this study. We have limited information on the nature of 22
the health care received; we look at only the first two years of post-insurance outcomes; we have 23
little pre-randomization information that can be used for subgroup analysis. There are also 24
important limits to external generalizability of the results: our population of low-income adults in 1
Oregon who were interested in signing up for Medicaid may not be representative of other 2
segments of the population. 3
That said, the Oregon lottery allows us to examine the causal effects of Medicaid 4
coverage on the diagnosis, treatment, and outcomes of a population with substantial unmet 5
mental health needs. Medicaid coverage resulted in a significant increase in access to care, 6
reducing the prevalence of untreated and undiagnosed depression and substantially improving 7
the symptoms of depression. There are thus likely to be substantial health consequences of 8
policy decisions about Medicaid coverage for this vulnerable population. 9
R
EFERENCES1. Gallup. Gallup-Healthways Well-Being Index2009.
2. Chapman D, Perry G, Strine T. The Vital Link Between Chronic Disease and Depressive Disorders. Preventing Chronic Disease 2005;2:1-10.
3. Unützer J, Schoenbaum M, Katon WJ, et al. Healthcare Costs Associated With Depression in Medically Ill Fee-for-service Medicare Participants. Journal of the American Geriatrics Society 2009;57:506-10.
4. Dismuke CE, Egede LE. Association of Serious Psychological Distress With Health Services Expenditures and Utilization in a National Sample of US Adults. General Hospital Psychiatry 2011;33:311-7.
5. Egede LE, Zheng D, Simpson K. Comorbid Depression is Associated With Increased Health Care Use and Expenditures in Individuals With Diabetes. Diabetes Care 2002;25:464-70.
6. Sobocki P, Ekman M, Ågren H, et al. Health-Related Quality of Life Measured with EQ-5D in Patients Treated for Depression in Primary Care. Value in Health 2007;10:153-60.
7. Harman JS, Edlund MJ, Fortney JC. Disparities in the Adequacy of Depression Treatment in the United States. Psychiatr Services 2004;55:1379-85.
8. Baicker K, Taubman S, Allen H, et al. The Oregon Experiment - Effects of Medicaid on Clinical Outcomes. New England Journal of Medicine 2013;368:1713-22.
9. Baicker K, Finkelstein A, Song J, Taubman S. The Impact of Medicaid on Labor Market Activity and Program Participation: Evidence from the Oregon Health Insurance Experiment. American Economic Review: Papers and Proceedings 2014;104:322-8.
10. Taubman SL, Allen HL, Wright BJ, Baicker K, Finkelstein AN. Medicaid increases emergency-department use: evidence from Oregon's Health Insurance Experiment. Science 2014;343 (Online Supplement):263-8.
11. Finkelstein A, Taubman S, Wright B, et al. The Oregon Health Insurance Experiment: Evidence from the First Year. Quarterly Journal of Economics 2012;127:1057-106.
12. Kroenke K, Spitzer RL, Williams JBW. The PHQ-9: Validity of a Brief Depression Severity Measure. Journal of General Internal Medicine 2001;16:606-13.
13. Ali G-C, Ryan G, De Silva MJ. Validated Screening Tools for Common Mental Disorders in Low and Middle Income Countries: A Systematic Review. PloS one 2016;11:e0156939.
14. Kroenke K, Strine TW, Spitzer RL, Williams JBW, Berry JT, Mokdad AH. The PHQ-8 as a measure of current depression in the general population. Journal of Affective Disorders 2009;114:163-73.
15. Kessler RC, Berglund P, Demler O, et al. The Epidemiology of Major Depressive Disorder: Results From the National Comorbidity Survey Replication (NCS-R). Journal of the American Medical Association
2003;289:3095-105.
16. Kroenke K, Strine TW, Spitzer RL, Williams JB, Berry JT, Mokdad AH. The PHQ-8 as a Measure of Current Depression in the General Population. Journal of Affective Disorders 2009;114:163-73.
17. Ware JE, Kosinki M, Dewey J, Gandek B. How to Score and Interpret Single-Item Health Status Measures: A Manual for Users of the SF-8 Health Survey. Lincoln, RI: QualityMetric Inc.; 2001.
18. Finkelstein A, Taubman S, Wright B, et al. The Oregon Health Insurance Experiment: Evidence from the First Year. Quarterly Journal of Economics 2012;127:1057-106.
19. Baicker K, Taubman SL, Allen HL, et al. The Oregon Experiment – Effects of Medicaid on Clinical Outcomes. New England Journal of Medicine 2013;368:1713-22.
20. Imbens GW, Angrist JD. Identification and Estimation of Local Average Treatment Effects. Econometrica 1994;62:467-75.
21. Angrist JD. Estimation of Limited Dependent Variable Models with Dummy Endogenous Regressors: Simple Strategies for Empirical Practice. Journal of Business & Economic Statistics 2001;19:2-16.
22. Angrist JD, Pischke J-S. Mostly Harmless Econometrics: An Empiricist's Companion. Princeton, NJ: Princeton University Press; 2009.
A
PPENDIX1 2
This Appendix provides additional detail on the statistical methods and data sources used in “The 3
Effect of Medicaid on Effective Management of Depression: Evidence from the Oregon Health 4
Insurance Experiment,” as well as additional results not reported in the main paper. 5
6
A. METHODS 7
8
Randomization and Intervention
9 10
Oregon opened a waiting list for a previously closed Medicaid program (OHP Standard) in early 11
2008 and then conducted eight lottery drawings from the waiting list between March and 12
September 2008. Those selected were enrolled in Medicaid if they completed the application and 13
met eligibility requirements. 14
15
OHP Standard (the lotteried Medicaid program) provides benefits to low-income adults who are 16
not categorically eligible for Oregon’s traditional Medicaid program. To be eligible, individuals 17
must have been aged 19 to 64, Oregon residents, U.S. citizens or legal immigrants, without 18
health insurance for 6 months, and not otherwise eligible for Medicaid or other public insurance. 19
They must have income below the federal poverty level and have less than $2000 in assets. OHP 20
Standard provides relatively comprehensive medical benefits (including prescription drug 21
coverage) with no consumer cost sharing and low monthly premiums (between $0 and $20, 22
based on income), provided mostly through managed care organizations. The lottery process and 23
OHP Standard are described in more detail elsewhere 18.
24 25
Data Sources
26 27
Lottery and Medicaid Enrollment 28
29
The state provided us with the initial lottery list and with detailed data on Medicaid enrollment 30
for every individual on the list. We use these data to construct our primary measure of insurance 31
coverage during the study period. These data are described in detail elsewhere 18.
32 33
In-Person Interviews and Clinical Assessments 34
35
Between September 2009 and December 2010, we conducted a large in-person data collection 36
effort to assess a wide variety of outcomes. The 20,745-person sample for the in-person data 37
collection included almost all of the individuals selected in the lottery living in the Portland area 38
and a roughly equal number of unselected controls. The collected data includes answers to a 39
detailed questionnaire, a catalog of medications in participants’ possession, anthropometric 40
measurements, blood pressure measurements, and assays from dried blood spots. We use these 41
data for almost all of our outcome measures as well as to classify individuals on the basis of pre-42
lottery diagnosis of depression. Receiving a pre-lottery diagnosis of depression required having 43
had access to a health care provider in the past, which may explain the higher insurance rates; 44
alternatively, it may be that those with a history of depression are more likely to seek insurance 45
in order to obtain care for depression. These data are described in detail elsewhere 19.
Using the medication catalog and a commercial medication database (First DataBank), we 1
classify drugs based on primary therapeutic use for mental health conditions. We separate anti-2
depressants into three subgroups: (1) SSRIs (selective serotonin reuptake inhibitors) are the most 3
commonly prescribed class of anti-depressants, and are generally recommended as the first-line 4
therapy; (2) tricyclic, MAOI, and other antidepressants, all of which are older therapies and 5
which may be recommended for depression that does not respond to SSRIs; use of these 6
antidepressants may reflect refinement of treatment or second-line therapy for patients not 7
responding to SSRIs, but could also reflect the use of an outdated treatment; (3) trazodone (and 8
branded equivalents), which is commonly prescribed as a sleep aid even in the absence of 9
depression (and is therefore excluded from our summary measures of mental health medications 10
above). Appendix Table 1 shows the most common of these medications. 11
12
Hospital Discharge Records 13
14
We obtained standard hospital discharge data for the entire state of Oregon from January 2008 15
through September 2009. We probabilistically matched these data to the Oregon Health 16
Insurance Experiment Study population based on information provided at the time of lottery 17
sign-up. We use these data to measure hospital use for mental health specifically. These data are 18
described in detail elsewhere 18.
19 20
Emergency Department Records 21
22
We obtained standard emergency department visit data for twelve hospitals in the Portland-metro 23
area from January 2007 through December 2010. We probabilistically matched these data to the 24
Oregon Health Insurance Experiment Study population based on information provided at the 25
time of lottery sign-up. We use these data to measure emergency department use for mood 26
disorders. These data are described in detail elsewhere 10.
27 28
Statistical Analysis
29 30
Our analysis focuses on isolating the impact of insurance coverage itself using the exogenous 31
variation of selection in the Medicaid lottery. This approach is detailed in Finkelstein et al.11 We
32
model this as follows: 33
34
(1) 35
36
i denotes an individual and h denotes a household. MEDICAID is an indicator for whether the 37
individual was covered by Medicaid during the course of the study. 38
39
We denote by Cih the set of covariates that are correlated with treatment probability (and 40
potentially with the outcome) and therefore must be controlled for so that estimates of β1 give an
41
unbiased estimate of the relationship between winning the lottery and the outcome. In all of our 42
analyses, Cih includes indicator variables for the number of household members on the lottery list; 43
although the state randomly sampled from individuals on the list, the entire household of any 44
selected individual was considered selected and eligible to apply for insurance. As a result, 45
household size. We denote by Vih a second set of covariates that can be included to potentially 1
improve power by accounting for chance differences between treatment and control groups in 2
variables that may be important determinants of outcomes. These covariates are not needed for 3
β1 to give an unbiased estimate of the relationship between winning the lottery and the outcome,
4
however, as they are not related to treatment status. Following our previous work, our primary 5
specification includes the pre-randomization version of the outcome for data from administrative 6
data sets (hospitalizations or ED visits). 7
8
We estimate equation (1) by two stage least squares (2SLS), using the following first stage 9 equation: 10 11 (2) 12 13
Here the excluded instrument is the variable LOTTERY, an indicator variable for whether or not 14
household h was selected by the lottery. 15
16
We interpret the coefficient on insurance from instrumental variable estimation of equation (1) as 17
the local average treatment effect of insurance, or LATE 20. In other words, our estimate of π 1
18
identifies the causal impact of insurance among the subset of individuals who obtain insurance 19
upon winning the lottery but who would not obtain insurance without winning the lottery (i.e. the 20
compliers). 21
22
The LATE interpretation requires the additional identifying assumption that the only mechanism 23
through which winning the lottery affects the outcomes studied is the lottery’s impact on 24
insurance coverage. We believe this is a reasonable approximation; in earlier work we discussed 25
potential violations; where we could explore them we did not find cause for concern 18.
26 27
In all of our estimates, we estimate linear models even though a number of our outcomes are 28
binary. Because we are interested in the difference in conditional means for the treatments and 29
controls, linear probability models would pose no concerns in the absence of covariates or in 30
fully saturated models 21,22. Our models are not fully saturated, however, so it is possible that
31
results could be affected by this functional form choice, especially for outcomes with very low or 32
very high mean probability. In prior work we have explored sensitivity to alternate 33
specifications (such as logistic regressions) and found that linear and non-linear models produce 34
very similar results. 35
36
In all of our analyses we cluster the standard errors on the household identifier since the 37
treatment is at the household level. All analyses of outcomes from the survey data are weighted 38
using survey weights to account for the sample releases into the field and intensive follow-up of 39
initial non-responders; the weights are described in detail elsewhere 19.
40 41
B. Additional Results
1 2
Health Care Utilization by Pre-Lottery Diagnosis Status 3
4
Appendix Table A2 explores how the effect of Medicaid on health care utilization differs for 5
those with and without pre-lottery diagnoses of depression. Use of all categories of health care 6
services is higher in the controls with a pre-lottery diagnosis of depression than those without. 7
The effects of Medicaid on utilization are also higher, but those increases are not concentrated in 8
care specific to mental health conditions. We note that results for hospitalizations and ED use 9
are similar (and similarly insignificant) when we use the category of “mood disorders” (shown 10
here) or a broader category of “mental health” (which includes psychoses, etc.; results not 11
shown). We cannot interpret these differences in use as necessarily attributable to the pre-12
existing depression itself, however: those with pre-lottery diagnoses of depression may differ in 13
other dimensions, and may have been more likely to interact with the health care system 14
(increasing the probability of having their depression diagnosed). 15
16
Diagnosis and Treatment by Pre-Lottery Diagnosis Status 17
18
Appendix Table A3 shows a more complete break-out the results shown in Tables 2 and 3 for 19
those with and without pre-lottery diagnoses of depression, as well as tests of whether the 20
differences in the effect of Medicaid are statistically significantly different between these two 21
groups. As previously reported, Medicaid insignificantly increases anti-depressant use overall 22
by 5.49 percentage points (p=.07); the magnitude of the effect is larger in percentage points for 23
those with a pre-lottery depression diagnosis (9.87, p=.152), but is only statistically significant 24
for those without (4.76, p=.033) and represents a larger percent increase relative to the control 25
group rate. In general, while the differences between the two groups are often in the expected 26
direction, the differences between the two groups in the effect of Medicaid are not statistically 27
significant. 28
Control Mean Treament Control Difference* Control Mean Treament Control Difference Control Mean Treament Control Difference (1) (2) (3) (4) (5) (6) Sample Characteristics (%) Female 56.9 -0.44 66.8 2.49 51.6 -1.74 (0.87) (1.58) (1.08) Age 19-34 36.0 -0.90 31.8 -1.95 38.3 -0.38 (1.03) (1.64) (1.27) Age 35-49 36.4 0.16 36.4 1.44 36.4 -0.53 (1.02) (1.67) (1.24) Age 50-64 27.6 0.73 31.9 0.51 25.3 0.90 (0.94) (1.61) (1.11) White 68.8 0.42 81.1 0.01 62.2 0.88 (1.01) (1.38) (1.30) Black 10.5 0.14 8.0 -0.26 11.9 0.32 (0.61) (0.92) (0.78) Other race 14.8 0.03 12.9 2.18 15.8 -1.13 (0.80) (1.23) (1.03) Hispanic 17.2 -0.19 10.0 0.11 21.1 -0.53 (0.84) (1.01) (1.12) Interviewed in English* 88.2 0.25 96.6 -0.91 83.7 1.07 (0.76) (0.62) (1.05)
Global test of balance, F-stat 0.20 1.49 0.55
p-value (0.99) (0.15) (0.83)
Effect of Lottery on Medicaid Coverage (%)
18.5 24.14 22.8 24.10 16.1 24.23
(0.90) (1.58) (1.09)
*Results for all survey respondents were previously reported in Baicker et al. 2013.
Samples consists of all in-person interview respondents (N=12229), those with a pre-lottery diagnosis of depression (N=4166) and without (N=8063).
Table 1: Study Population and Lottery
All survey respondents Pre-lottery diagnosis of depression diagnosis of depressionNo pre-lottery
Ever on Medicaid during study period
Notes: For each sample, the first column reports the control mean of the variable (with standard deviation for continuous outcomes in parentheses). The second column reports estimated differences between treatments and controls for the dependent variable (shown in the left hand column), specifically the coefficient (with standard error in parentheses) on LOTTERY based on estimating equation (1). The global test of balance rows report the pooled F statistics and p values from testing treatment-control balance on all the above variables jointly. All regressions include indicators for the number of household members on the list and adjust standard errors for household clusters. All analysis is weighted using survey weights.
Control Mean Effect of Medicaid Coverage p-value
(1) (2) (3)
A. Diagnosis of Depression
Among those without pre-lottery depression Dx
Post-lottery diagnosis of depression (%) 7.39 5.50 0.049 (2.79)
Undiagnosed depression (%) 14.01 -6.76 0.047 (3.40)
B. Mental Health Treatment
Untreated depression (%)^ 16.6 -10.50 0.001 (3.05) 20.1 -17.00 0.003 (5.74) 14.8 -6.80 0.053 (3.50) p-value of difference 0.128
Unmet need for mental health care (%) 24.41 -9.21 0.005 (3.29) 45.82 -12.31 0.071 (6.82) 12.87 -6.19 0.041 (3.03) p-value of difference 0.438 Talk Therapy (%) 37.4 8.83 0.196
Among those with pre-lottery depression Dx (6.84)
Prescription Medications
Any mental health medication (%)1 20.7 8.77 0.008
(3.33)
Mental health medications [#]1 0.335 0.14 0.025
(0.77) (0.06) Share using any (%):
Anti-depressant* 16.8 5.49 0.071
(3.04)
SSRI 9.8 4.13 0.088
(2.42)
Tricyclic, MAOI, or Other 7.0 3.66 0.082 (2.10) Trazodone 3.4 -0.46 0.747 (1.42) Anxiolytic 6.2 2.60 0.207 (2.06) Bipolar 5.5 0.39 0.834 (1.85) Sedative 2.9 4.13 0.004 (1.43) Anti-psychotic 4.0 0.80 0.629 (1.64)
Table 2: Diagnosis and Treatment of Depression and Mental Health Conditions
Notes: For each sample, the first column reports the control mean of the dependent variable (with standard deviation for continuous outcomes in parentheses). The second column reports the estimated local-average-treatment effect of Medicaid coverage (with standard error in parentheses). See Appendix for estimating equations and detail on functional Among those with pre-lottery depression Dx
Among those without pre-lottery depression Dx
Among those with pre-lottery depression Dx Among those without pre-lottery depression Dx
Control Mean Effect of Medicaid Coverage p-value (1) (2) (3)
Positive Depression Screen (% with PHQ8 >=10)* 30.02 -9.15 0.02
(3.85)
Among those with pre-lottery depression Dx 52.05 -13.12 0.07
(7.20)
Among those without pre-lottery depression Dx 18.14 -5.26 0.19
(3.99)
P-value of difference between with and without 0.34
Total PHQ-8 Score 7.02 -1.18 0.02 (6.01) (0.50) Little interest/pleasure 0.83 -0.15 0.06 (0.98) (0.08) Feeling depressed 0.83 -0.26 0.00 (0.98) (0.08)
Trouble sleeping, or oversleeping 1.29 -0.20 0.04
(1.17) (0.10)
Feeling tired 1.31 -0.26 0.00
(1.07) (0.09)
Poor appetite or overeating 0.88 -0.06 0.50
(1.10) (0.09)
Feeling bad about self 0.72 -0.08 0.33
(0.99) (0.08)
Trouble concentrating 0.68 -0.06 0.49
(1.02) (0.08)
Abnormal energy level 0.49 -0.09 0.22
(0.87) (0.07)
Mental-Health Related Quality of Life* 44.39 1.95 0.047
Mental Component Scale (11.38) (0.98)
*Aggregate result previously reported in Baicker et al. 2013.
Notes: For each sample, the first column reports the control mean of the dependent variable (with standard deviation for continuous outcomes in parentheses). The second column reports the estimated local-average-treatment effect of Medicaid coverage (with standard error in parentheses). See Appendix for estimating equations and detail on functional form. The third column reports the p-value of the estimated effects. All regressions include indicators for the number of household members on the lottery list and adjust standard errors for household clusters. All analysis is weighted using survey weights. PHQ-8 scoring: 0 is no days of symptoms, 1 is several days, 2 is more than half the days, and 3 is nearly every day. Samples consist of all in-person interview respondents (N=12229), those with a pre-lottery diagnosis of depression (N=4166), and those without (N=8063).
Therapeutic Use Most Frequently Observed Medications
Anti-depressant: SSRI Citalopram
Fluoxetine Sertraline Paroxetine Escitalopram Anti-depressant: Tricyclic, MAOI, or Other Bupropion
Amitriptyline Duloxetine Venlafaxine Nortriptyline Anxiolytic Clonazepam Lorazepam Hydroxyzine Alprazolam Diazepam Bipolar Quetiapine Lamotrigine Aripiprazole
Valproic Acid, sodium valproate, valproate sodium, divalproex Lithium Sedative Lorazepam Zolpidem Doxepin Temazepam Doxylamine Anti-psychotic Quetiapine Aripiprazole Risperidone Olanzapine Ziprasidone Appendix Table A1
Notes: The five most frequent medications per therapeutic use by generic name are listed in decending order of
frequency. Medications are classified based on primary therapeutic use for mental health conditions from the First DataBank Enhanced Therapeutic Classification (ETC) system.
Control Mean Effect of Medicaid Coverage p-value Control Mean Effect of Medicaid Coverage p-value Control Mean Effect of Medicaid Coverage p-value (1) (2) (3) (4) (5) (6) (7) (8) (9) (10)
Doctor visits (12 months prior to interview)
Any doctor visit 64.55 16.59 0.000 76.36 19.94 0.001 58.18 15.73 0.002 0.602
(3.96) (6.07) (5.01)
Number of doctor's visits* 5.54 2.70 0.003 8.13 4.16 0.035 4.16 2.11 0.022 0.353
(11.58) (0.92) (14.33) (1.97) (9.51) (0.92)
ED visits (by September 2009)
Any ED visit** 35.84 7.49 0.047 45.33 11.83 0.088 30.86 5.28 0.229 0.424
(3.78) (6.93) (4.39)
Number of ED visits** 0.98 0.62 0.000 1.38 1.18 0.002 0.77 0.33 0.048 0.035
(2.41) (0.17) (3.04) (0.37) (1.98) (0.16)
Any ED visits for mood disorders 1.48 0.12 0.902 3.50 0.56 0.828 0.42 -0.09 0.892 0.807
(1.00) (2.58) (0.69)
Number of ED visits for mood disorders 0.03 -0.01 0.582 0.07 -0.04 0.494 0.01 0.00 0.702 0.456
(0.32) (0.02) (0.53) (0.06) (0.10) (0.01)
Hospitalizations (by September 2009)
Any hospitalization+ 6.91 2.63 0.159 9.30 8.26 0.035 5.63 0.05 0.979 0.067
(1.87) (3.92) (2.00)
Number of hospitalizations+ 0.12 0.05 0.260 0.16 0.19 0.029 0.10 -0.01 0.764 0.039
(0.72) (0.04) (0.70) (0.09) (0.73) (0.04)
Any hospitalizations for mood disorders 0.81 -0.09 0.879 1.92 -1.03 0.530 0.21 0.42 0.356 0.493
(0.62) (1.65) (0.45)
Num. of hospitalizations for mood disorders 0.01 0.00 0.788 0.03 -0.01 0.684 0.00 0.01 0.183 0.757
(0.17) (0.01) (0.27) (0.03) (0.05) (0.01)
(3.29) (6.82) (3.03)
Overall Resource Use
Total resource use ($) 2835 1250.28 0.002 3936.53 2942.38 0.000 2100.59 505.64 0.223 0.010
(5870) (411.35) ###### (841.96) (5133.67) (415.17)
++ An analysis of this outcome for the full Oregon Health Insurance Experiment sample (N=74922) was previously reported in Finkelstein et al. 2012. Here
we report the results limiting to survey respondents (N=12229). To calculate the implied annual spending effects associated with the estimated utilization effects we use data from the 2002-2007 (pooled) Medical Expenditure Panel Survey (MEPS) on expenditures of all nonelderly (19-64) adults below 100 percent of poverty who are publicly insured. This gives us a total sample of over 7,500 individuals. We use their expenditures (all inflated with the CPI-U to 2007 dollars) to calculate average expenditures per outpatient visit, average expenditures per ED visit, average expenditures per inpatient visit (for visits not related to childbirth). For medications, we calculate average spending per prescription drug by dividing total annual prescription drug costs by the total number of prescription drugs taken over the course of the year. All spending numbers are based on total expenditures (i.e. not just expenditures among the
Appendix Table A2: Healthcare Use
Samples for all measures except ED consist of all in-person interview respondents (N=12229), those with a pre-lottery diagnosis of depression (N=4166), and those without (N=8063). Samples for ED visits consist of the overlap between the ED sample and interview respondents (N=10178), and those in the overlap with a pre-lottery diagnosis of depression (N=3438) and without (N=6740).
Notes: For each sample, the first column reports the control mean of the dependent variable (with standard deviation for continuous outcomes in parentheses). The second column reports the estimated intent-to-treat effect of lottery selection (with standard error in parentheses). The third column reports the estimated local-average-treatment effect of Medicaid coverage (with standard error in parentheses). The fourth column reports the p-value of the estimated effects. See Appendix for estimating equations. All regressions include indicators for the number of household members on the lottery list and adjust standard errors for household clusters. The analyses of ED visits and hospitalizations also control for the pre-randomization version of the outcome. All analysis is weighted using survey weights.
+ An analysis of this outcome for the full Oregon Health Insurance Experiment sample (N=74922) was previously reported in Finkelstein et al. 2012. Here
we report the results limiting to survey respondents (N=12229).
All survey respondents Pre-lottery diagnosis of depression No pre-lottery diagnosis of depression p-value for hetero-geneity
*Results for all survey respondents previously reported in Baicker et al. 2013. **An analysis of this outcome for the full ED sample (N= 24646) was previously reported in Taubman et al. 2014. Here we report the results limiting to the overlap of the ED sample and interview respondents (N=10178).
Control Mean Effect of Medicaid Coverage p-value Control Mean Effect of Medicaid Coverage p-value Control Mean Effect of Medicaid Coverage p-value (1) (2) (3) (4) (5) (6) (7) (8) (9) (10) Diagnosis of Depression
Post-lottery diagnosis of depression (%) N/A N/A 7.39 5.50 0.049 (2.79)
Undiagnosed depression (%) N/A N/A 14.01 -6.76 0.047 (3.40)
Treatment
Talk Therapy (%) N/A 37.4 8.83 0.196 N/A (6.84)
Prescription Medications
Any mental health medication (%)1
20.7 8.77 0.008 44.8 14.53 0.041 7.7 7.58 0.005 0.362
(3.33) (7.10) (2.67)
Mental health medications [#]1 0.335 0.14 0.025 0.771 0.28 0.077 0.099 0.11 0.004 0.301
(0.77) (0.06) (1.07) (0.16) (0.38) (0.04) Share using any (%):
Anti-depressant* 16.8 5.49 0.071 37.5 9.87 0.152 5.7 4.76 0.033 0.484
(3.04) (6.88) (2.23)
SSRI 9.8 4.13 0.088 22.6 8.45 0.157 2.9 2.96 0.069 0.376
(2.42) (5.96) (1.62)
Tricyclic, MAOI, or Other 7.0 3.66 0.082 15.8 6.32 0.227 2.3 2.87 0.051 0.529
(2.10) (5.23) (1.47) Trazodone 3.4 -0.46 0.747 7.4 -2.70 0.457 1.2 0.96 0.342 0.329 (1.42) (3.62) (1.01) Anxiolytic 6.2 2.60 0.207 14.1 7.11 0.171 2.0 0.81 0.553 0.242 (2.06) (5.20) (1.37) Bipolar 5.5 0.39 0.834 12.8 1.89 0.690 1.5 -0.77 0.523 0.584 (1.85) (4.73) (1.21) Sedative 2.9 4.13 0.004 6.1 6.95 0.045 1.2 2.94 0.013 0.274 (1.43) (3.47) (1.18) Anti-psychotic 4.0 0.80 0.629 9.8 -0.61 0.887 0.8 1.81 0.075 0.582 (1.64) (4.28) (1.02) Untreated depression (%)^ 16.6 -10.50 0.001 20.1 -17.00 0.003 14.8 -6.80 0.053 0.128 (3.05) (5.74) (3.50)
Unmet need for mental health care (%) 24.41 -9.21 0.005 45.82 -12.31 0.071 12.87 -6.19 0.041 0.438
(3.29) (6.82) (3.03)
Appendix Table A3: Diagnosis and Treatment of Depression and Mental Health Conditions p-value for
difference between
(7) and (11)
Notes: For each sample, the first column reports the control mean of the dependent variable (with standard deviation for continuous outcomes in parentheses). The second column reports the estimated local-average-treatment effect of Medicaid coverage (with standard error in parentheses). See Appendix for estimating equation. All regressions include indicators for the number of household members on the lottery list and adjust standard errors for household clusters. The final column reports the p-value for a test for treatment effect heterogeneity by pre-lottery diagnosis of depression. All analysis is weighted using survey weights. Samples consist of all in-person interview respondents (N=12229), those with a pre-lottery diagnosis of depression (N=4166), and those without (N=8063).
*Aggregate result for all survey respondents previously reported in Baicker et al. 2013. ^This analysis was not prespecified. [1] Trazodone and branded equivalents are excluded from these summary measures.
Without pre-lottery diagnosis of depression All survey respondents With pre-lottery diagnosis
FIGURE A1: STUDY SAMPLE Submitted name for lottery (N=89,824) Included in Oregon Health Insurance Experiment (N = 74,922) • Treatments (N = 29,834; 8,462 enrolled, 21,372 not) • Controls (N = 45,088; 1,197 enrolled, 43,891 not) Excluded (N = 14,902) • Gave address outside of Oregon (N = 36) • Older than age 64 or younger than age 19 (N = 3,258) • Gave group or institutional address (N=5,161) • Signed up by unrelated third party (N=5,708) • Died prior to the notification date 9 (N=134) • Multiple active observations (N=605) In-Person Responders (N = 12,229) • Weighted response rate: 73% • Treatments (N = 6,387) • Controls (N = 5,842) In-Person Sample (N = 20,745) • Treatments (N = 10,405) • Controls (N = 10,340) Excluded for residing outside Portland area (N = 54,177) Pre-lottery diagnosis of depression (N = 4,166) • Treatments (N = 2,120) • Controls (N = 2,046) No pre-lottery diagnosis of depression (N = 8,063) • Treatments (N = 4,267) • Controls (N = 3,796) Non-respondents to the in-person survey (N = 8,516) Individuals with pre-lottery diagnosis of depression (N = 4,166) Individuals without pre-lottery diagnosis of depression (N = 8,063)