HAL Id: hal-03186538
https://hal.inrae.fr/hal-03186538
Submitted on 31 Mar 2021
HAL is a multi-disciplinary open access
archive for the deposit and dissemination of
sci-entific research documents, whether they are
pub-lished or not. The documents may come from
teaching and research institutions in France or
abroad, or from public or private research centers.
L’archive ouverte pluridisciplinaire HAL, est
destinée au dépôt et à la diffusion de documents
scientifiques de niveau recherche, publiés ou non,
émanant des établissements d’enseignement et de
recherche français ou étrangers, des laboratoires
publics ou privés.
Distributed under a Creative Commons Attribution - NonCommercial - NoDerivatives| 4.0
The ecological impact of pest-induced tree dieback on
insect biodiversity in Yunnan pine plantations, China
Wang Cai, Chunyan Yang, Xiaoyang Wang, Chunying Wu, Laurent Larrieu,
Carlos Lopez-Vaamonde, Qingzhong Wen, Douglas Yu
To cite this version:
Wang Cai, Chunyan Yang, Xiaoyang Wang, Chunying Wu, Laurent Larrieu, et al.. The ecological
impact of pest-induced tree dieback on insect biodiversity in Yunnan pine plantations, China. Forest
Ecology and Management, 2021, 491, pp.119173. �10.1016/j.foreco.2021.119173�. �hal-03186538�
Forest Ecology and Management 491 (2021) 119173
0378-1127/© 2021 Elsevier B.V. All rights reserved.
The ecological impact of pest-induced tree dieback on insect biodiversity in
Yunnan pine plantations, China
Wang Cai
a,1, Chunyan Yang
a,1, Xiaoyang Wang
a, Chunying Wu
a, Laurent Larrieu
e,f,
Carlos Lopez-Vaamonde
g,h, Qingzhong Wen
d, Douglas W. Yu
a,b,c,*aState Key Laboratory of Genetic Resources and Evolution, Kunming Institute of Zoology, Chinese Academy of Sciences, Kunming, China bSchool of Biological Sciences, University of East Anglia, Norwich Research Park, Norwich, UK
cCenter for Excellence in Animal Evolution and Genetics, Chinese Academy of Sciences, Kunming, China dYunnan Institute of Forest Inventory and Planning, Kunming, China
eUniversit´e de Toulouse, INRAE, UMR DYNAFOR, Castanet-Tolosan, France fCNPF-CRPF Occitanie, Tarbes, France
gINRAE, URZF, Orl´eans, France
hIRBI, UMR 7261, CNRS-Universit´e de Tours, Tours, France
A R T I C L E I N F O Keywords:
DNA metabarcoding Biodiversity Climate change Bark beetle outbreak Zeta diversity
Pinus yunnanensis
A B S T R A C T
China has recently announced a reform of forestry policy, with a major goal being to transform from plantation to heterogeneous forests, which have higher resistance to pests and disease and house more biodiversity. One driver of reform is increased intensity and frequency of pest-induced tree-dieback events. To inform management, we ask what effects these events have on insect biodiversity in Pinus yunnanensis monocultures in Yunnan province, the province with one of the highest proportions of forest cover in China. We sampled aerial arthropods (mostly insect) biodiversity along gradients of Pinus yunnanensis dieback severity using Malaise traps and used meta-barcoding to characterise the insect community. We used MS-GDM (‘multi-site generalized dissimilarity modelling of zeta diversity’), zeta-decline analysis, and iNEXT (‘Interpolation and extrapolation for species di-versity’) to assess community change as functions of forest-structure covariates. Metabarcoding of Malaise- trapped insects reveals that bark-beetle induced forest dieback does not result in detectable differences in spe-cies diversity but does result in compositional change, with the biggest turnover occurring between 0% and infested-0%-open-canopy forests and 20%-infested-20%-open-canopy forests. Zeta-decline analysis found that the insect community in low-infestation forests is characterized by a stochastic assembly, while in high- infestation forests, the community structure is consistent with niche assembly. Our results thus suggest that bark-beetle dieback mimics natural forest-gap dynamics, consistent with the interpretation of bark beetles as a keystone species in European conifer forests, where it has been proposed that forest heterogeneity can be created efficiently by allowing natural disturbances, including bark-beetle outbreaks, to proceed naturally, without being mitigated by deadwood removal and dense replanting. In Yunnan’s situation, and given predicted increases in bark-beetle dieback severity and frequency, this strategy should probably be supplemented with anthropogenic treatments, such as deadwood enhancement and planting of multiple tree species, to accelerate the succession of plantations into heterogeneous forests.
1. Introduction
The largest reforestation programmes in the world are China’s Nat-ural Forest Protection Program (NFPP) and Grain for Green Program (GFGP), which were implemented after widespread flooding in 1998
(Liu et al., 2008; Vina et al., 2016; Xu et al., 2006; Yin et al., 2009). The NFPP protects native forests in the upstream watersheds of the Yangtze and Yellow rivers (Liu et al., 2008; Ren et al., 2015), and the GFGP controls soil erosion by paying farmers to plant trees on sloping land that had been used for food production (Delang & Yuan, 2015; Liu et al.,
* Corresponding author at: State Key Laboratory of Genetic Resources and Evolution, Kunming Institute of Zoology, Chinese Academy of Sciences, Kunming, China.
E-mail address: dougwyu@mac.com (D.W. Yu).
1 These authors contributed equally to this paper.
Contents lists available at ScienceDirect
Forest Ecology and Management
journal homepage: www.elsevier.com/locate/foreco
https://doi.org/10.1016/j.foreco.2021.119173
2008; Ma et al., 2017; Xu et al., 2006; Zhai et al., 2014). The GFGP reforested 9.06 million ha of cropland between 1999 and 2014, and not surprisingly, the GFGP has primarily established low-diversity tree plantations (‘plantations’ hereafter), rather than restoring native forest (Hua et al., 2018, 2016; Zhai et al., 2014).
Studies have previously shown that these plantations support lower levels of bird, bee, and general insect diversity than do native forests in the same locations (Hua et al., 2016; Wang et al., 2019). These findings complement those of Cao et al. (2019), who recently calculated that plantations in China return a lower net value of ecosystem services relative to native forests, even after counting income from timber sales. Plantations require a high initial outlay for tree planting, some non- native tree species like Eucalyptus require more water input than do native tree species, and more management effort is required to protect plantations from pest attack (Brockerhoff et al., 2013). In contrast, in-come from timber sales is low. Thus, to better protect and restore terrestrial biodiversity, studies have recommended that reforestation policy in China should prioritize the conservation and restoration of native forest over plantations (Hua et al., 2016; Wang et al., 2019).
These initial results in China are consistent with those from a larger body of research on forest biodiversity and ecosystem functioning in Central Europe, where professional silviculture has long promoted plantations, which have now grown to be dominated by dense tree stands with few canopy gaps and low volumes of deadwood (Doerfler et al., 2018; Thorn et al., 2018, 2019). Such forests support a low di-versity of plants and animals, especially of saproxylic species (Thorn et al., 2018, 2019) and are more vulnerable to large-scale bark-beetle (Curculionidae, Scolytinae) outbreaks because the forests are even-aged and thus grow to provide an extensive and continuous cover of the large trees that are ideal hosts for bark beetles (Seidl et al., 2016).
Bark-beetle outbreaks are now a primary killer of coniferous forest in central Europe (Thorn et al., 2019), as well as North America (Robertson et al., 2009) and China (Gan, 2015; He & Zhang, 2004). Moreover, climate change is increasing the frequency of bark-beetle outbreaks (Carroll et al., 2004; Esper et al., 2007; Sambaraju et al., 2012; Seidl et al., 2017). For instance, more frequent and severe droughts and high temperatures impede pines from producing enough toxic resin to disable attacking beetles (Erbilgin et al., 2017; Kichas et al., 2020; Raffa & Berryman, 1983), and consequently, bark-beetle populations can more easily grow to outbreak levels (Cullingham et al., 2011).
Bark-beetle outbreaks leave many standing dead trees, leading to an overall increase in deadwood amount and stand structural heterogenity (Swanson et al., 2011). Forest managers often carry out salvage logging by removing infected trees in order to stop the expansion of the beetles (Stadelmann et al., 2013) and to recover the economic value of wood (Lindenmayer et al., 2008). The removal of infected trees has a negative impact not only on bark beetles but also on other species associated with dead wood (Thorn et al., 2018) but can have positive effects by on species that are normally associated with open areas (Rost & Clavero, 2012).
Our study region of Yunnan province, southwestern China, has one of the highest proportions of forest cover in China (Ren et al., 2015; SFA, 2016), and Pinus yunnanensis plantations account for 28.2% of this forest cover (YNFA, 2018), 80% of which is monoculture (Cai et al., 2006). Most of the Pinus yunnanensis forest has grown up on land where primary evergreen broadleaved forests had been destroyed (Deng et al., 2014). The provincial forestry bureau carries out salvage logging by cutting and removing ‘snags’ (upright dead trees) to control local outbreaks of three species of pine shoot beetles of genus Tomicus (Coleoptera: Curculioni-dae: Scolytinae) (Gan, 2015; Kirkendall et al., 2008; Lu & Zhang, 2000; Lu et al., 2014; Wang et al., 2015). In addition, locals remove logs for firewood, leading to very low volumes of dead wood in Pinus yunnanensis plantations, despite massive shoot beetle outbreaks affecting over 200,000 ha of pine plantations in Yunnan (Ji et al., 2007; Lieutier et al., 2003). This combination in Yunnan of GFGP-financed plantation dominance, Tomicus outbreaks, and salvage logging results in conifer
forests similar to those in Central Europe: structurally simple, even-aged tree cover that, despite cut-and-removal of infested trees, remains vulnerable to bark-beetle outbreaks (Cai et al., 2006) and supports low levels of native biodiversity compared to native forest.
However, China announced its intention to implement a new forest restoration plan in 2019 (Xinhua News Agency, 2019), with a major policy goal being to transform plantations into heterogeneous forests that have higher resistance to pests and disease.
In this study, we used Malaise traps to sample aerial insect biodi-versity (dominated by Diptera and Hymenoptera) along gradients of
Pinus yunnanensis dieback severity. The initial goal of our study was to
study the ecological impact of bark-beetle-induced dieback on flying insect diversity. In particular, we were interested in whether patterns of forest insect diversity in Yunnan plantations are similar to those in Central Europe, where impacts of tree-dieback on habitat structure and salvage logging have been extensively studied (Doerfler et al., 2018; Hilmers et al., 2018; Müller et al., 2010; Seibold et al., 2016a, 2016b, 2018; Thorn et al., 2018). If similar, then this increases our confidence in applying lessons learned there to Yunnan and neighboring provinces (e. g. the efficacy of deadwood enrichment as a means of promoting sap-roxylic taxa; Doerfler et al., 2018; Seibold et al., 2016a, 2016b). Sec-ondly, given China’s recent forest-policy reform announcement, our results serve as a baseline survey of aerial insect biodiversity in Yunn-an’s Pinus yunnanensis plantations, to allow comparison with future forests in which, we presume, China will promote, or at least allow, the accumulation of greater structural and age heterogeneity and more deadwood.
We characterized the Malaise-trap samples using DNA metabarcod-ing, which combines DNA barcoding with high-throughput DNA sequencing to generate large sample X species tables that can be used to test the effects of candidate environmental variables on biodiversity. We did not specifically collect saproxylic taxa because the current cut-and- remove policy means that there are no Pinus yunnanensis forests in Yunnan with high volumes of deadwood to act as a contrast. Meta-barcoding has been tested against morphologically identified samples and been shown to be a reliable and efficient method of characterizing the species compositions of bulk samples of insects and invertebrates generally (Aylagas et al., 2018; Cordier et al., 2017; Edwards et al., 2014; Ji et al., 2013; Lejzerowicz et al., 2015; Pawlowski et al., 2016; Wang et al., 2019; Yu et al., 2012). Accessible explanations of meta-barcoding are available in Bush et al. (2017), Ji et al. (2013), Piper et al. (2019), Yang et al. (2020), and Zinger et al. (2019).
2. Methods
2.1. Field sampling and environmental variables
Following the distribution of Pinus yunnanensis in Yunnan province, southwest China, we sampled in five counties across the elevational range of optimal growth (1800–3000 m, Table 1) (Deng et al., 2013). In each county, we sampled in six P. yunnanensis-dominated forest stands of at least 1 Ha extent along a gradient of bark-beetle-induced dieback severity: two sites each in low, medium, and high severity (Fig. 1) (sampling locations and elevations in Table S1). Severity was judged by local forestry officials, who are charged with responding to bark-beetle outbreaks, using a method defined in 2006 by the then-State Adminis-tration of Forestry (now National Forestry and Grassland Administra-tion) (SFA, 2006). All sampling plots are reported to have been attacked the first time in the 1980s (Zhao & Långstr¨om, 2012). Our goal with this initial blocking was only to maximize coverage of the local gradient of dieback severity.
We set out and retrieved Malaise traps during 4–14 July 2016, placing two traps 10 m apart in each forest site (pairs were pooled at DNA extraction before downstream processing) for a total of 60 samples (5 counties X 6 sites/county X 2 traps/site). We used absolute ethanol as the killing and preserving agent, and the traps were left out for seven
days each. For efficiency, we set out all traps in one county and then moved the next day to another county. Retrieval followed the same schedule, and we replaced the ethanol in each trap with fresh ethanol for transport at ambient temperature to our laboratory, where samples were stored at − 80 ◦C until DNA extraction. In addition, in each of the 30
sampling sites, we centered a 30 X 30 m quadrat over the Malaise traps
and measured six environmental covariates: elevation, mean tree height, mean diameter at breast height (DBH), percentage canopy openness, mean infestation rate (the percentage of trees with one or more bark beetle emergence holes on all four cardinal sides), and stump number (details in Table 1).
2.2. DNA extraction and PCRs
Before DNA extraction, the storage ethanol was decanted, and the sample was air-dried on single-use filter papers. To reduce PCR domi-nance by large-biomass individuals (Elbrecht et al., 2017), we used two legs from all individuals larger than a housefly and whole bodies of everything smaller. Tissue was digested using a modified non- destructive protocol from Gilbert et al. (2007) and Nielsen et al. (2019) in one 50-ml falcon tube per sample, followed by DNA extraction with the DNEasy Blood & Tissue Kit (Qiagen GmbH, Germany). After extraction, we pooled the DNA from the paired Malaise traps, leaving us with 30 samples, one per site.
We used mlCOIintF–Fol-degen-rev primers (Leray et al., 2013; Yu et al., 2012), which amplify a 313-bp fragment of the COI barcode, and we followed the DAMe metabarcoding protocol (Alberdi et al., 2018; Bohmann et al., 2018; Zepeda-Mendoza et al., 2016), which is a co- designed wet-lab and bioinformatic pipeline that combines qPCR- optimized PCR conditions, multiple, independent PCR replicates per sample, twin-tagging, and negative and positive controls to (i) remove sequence-to-sample misassignment due to tag-jumping (Schnell et al., 2015), (ii) reduce sequence dropout and taxonomic bias in amplifica-tion, and (iii) reduce erroneous sequences. Twin-tagging means that the same tag is used on both the forward and reverse primers in a reaction
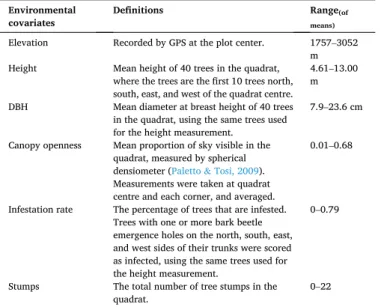
Table 1
Environmental covariates and definitions.
Environmental
covariates Definitions Range(of means)
Elevation Recorded by GPS at the plot center. 1757–3052 m Height Mean height of 40 trees in the quadrat,
where the trees are the first 10 trees north, south, east, and west of the quadrat centre.
4.61–13.00 m DBH Mean diameter at breast height of 40 trees
in the quadrat, using the same trees used for the height measurement.
7.9–23.6 cm Canopy openness Mean proportion of sky visible in the
quadrat, measured by spherical densiometer (Paletto & Tosi, 2009). Measurements were taken at quadrat centre and each corner, and averaged.
0.01–0.68
Infestation rate The percentage of trees that are infested. Trees with one or more bark beetle emergence holes on the north, south, east, and west sides of their trunks were scored as infected, using the same trees used for the height measurement.
0–0.79
Stumps The total number of tree stumps in the
quadrat. 0–22
Fig. 1. Map of study area, Yunnan province, southwest China. Blue insets are the five sampled counties. Green squares indicate Pinus yunnanensis forest distribution.
Coloured circles indicate sampling sites, stratified by severity of bark-beetle outbreak, as judged subjectively by local forestry officials. (For interpretation of the references to color in this figure legend, the reader is referred to the web version of this article.)
(F1-R1, F2-R2,…), and multiple, independent PCR replicates per sample means that a different twin tag is used for each of the six PCRs per sample, which lets them be distinguished in bioinformatic processing. The DAMe logic is that tag-jump events can be filtered out by removing reads carrying non-twinned tags (e.g. F1-F2, F3-F5) and that nearly all erroneous sequences (indels, substitutions, chimeras) can be filtered out by removing sequences that appear in only one (or a low number of) PCR replicate(s) at a low copy number, while true sequences are more likely to appear in multiple PCRs at higher copy numbers. Extensive testing with a recently updated version of DAMe (now called Begum) using mock samples finds that erroneous sequences can be nearly eliminated at the cost of only a small rise in drop-outs, and a detailed explanation of the protocol can be found there (Yang et al., 2020).
We used qPCR on a subset of samples to optimize PCR annealing temperature, cycle number, and initial DNA template concentration, as recommended by Murray et al. (2015) and Bohmann et al. (2018). Af-terwards, for each sample, we ran 6 independent PCRs with 6 different twin-tags, under the following qPCR-optimised conditions: initial denaturation 95 ◦C for 5 min, followed by 27 cycles of 95 ◦C for 10 s,
45.5 ◦C for 45 s, 72 ◦C for 1 min, and finishing at 72 ◦C for 10 mins. All
PCRs were performed in 20 µl reactions containing 0.6 U Ex Taq HS DNA polymerase, 1 X Ex Taq Buffer (Mg2+plus), 0.2 mM dNTP Mixture
(TaKaRa, Biotechnology Co. Ltd, Dalian, China), 0.4 µM of each primer, 1 µl DMSO, 0.1 µg/µl BSA (Bovine Serum Albumin Solution, TaKaRa Biotechnology Co. Ltd, Dalian, China), and 2 µl genomic DNA. We visualized the PCR products on 2% agarose gels. The PCR plate also included three extraction blanks and a row of PCR blanks. Finally, we included a positive control containing seven insect species from France. The 30 samples were combined into six, approximately equimolar pools for bead purification (Agencourt AMPure XP kit, Beckman Coulter, Inc., USA) and subsequent library preparation using the NEXTflex Rapid DNA-Seq Kit for Illumina (Bioo Scientific Corp., Austin, USA). The six libraries were sequenced on the Illumina MiSeq platform (300PE) at the Southwest Biodiversity Institute Regional Instrument Center in Kunming.
2.3. Bioinformatic processing
Raw MiSeq data were first trimmed for remnant Illumina adapters with AdapterRemoval 2.2.0 (Schubert et al., 2016), followed by Schirmer et al.’s (2015) recommended pipeline: we trimmed low-quality ends using sickle 1.33 (Joshi & Fass, 2011), denoised reads using the
Bayes-Hammer module in SPAdes 3.10.1 (Nikolenko et al., 2013), and merged read pairs using PandaSeq 2.11 (Masella et al., 2012). In all cases, we used default parameters.
Sequence were demultiplexed to sample and filtered for tag-jumps using a modified version of DAMe that ignores heterogeneity spacers in the primers (github.com/shyamsg/DAMe, accessed 10 October 2020). We then filtered out putatively erroneous sequences by keeping only those that appeared in > 2 of the 6 PCRs per sample, at a minimum copy number of 30 per PCR, which is the stringency level that minimized false negatives and maximized true positives in the positive control. We further filtered by removing sequences ≤ 300 bp length and using the de
novo chimera search function in vsearch 2.4.3 (Rognes et al., 2016). After filtering, sequences were clustered into 97% similarity Operational Taxonomic Units (OTUs) using SUMACLUST 1.0.20 (Mercier et al., 2013), from which we created a Sample X OTU table, and we used the R package ‘lulu’ 0.1.0 (Frøslev et al., 2017) with default parameters to combine likely ‘parent’ and ‘child’ OTUs that had failed to cluster. Finally, we assigned taxonomies to the remaining OTUs with the RDP Classifier function (Wang et al., 2007) on the Midori metazoan mito-chondrial gene website (Leray et al., 2018). OTUs assigned to Arthro-poda with < 80% probability were removed. No OTUs remained in the extraction-blank and PCR negative controls, and the positive control and samples shared no OTUs. We also tried assigning taxonomies on BOLD (Ratnasingham & Hebert, 2007), but only a few OTUs received hits, due
to a lack of samples from this region.
2.4. Statistical analyses
All statistical analyses were carried out in R 3.6.3. Read numbers per OTU per sample were transformed to presence/absence (1/0). We first used the ‘boral’ 1.6.1 R package (Hui, 2016) to cluster sites by com-munity composition. Boral is a Bayesian, model-based ordination method that allows the selection of an appropriate error distribution. We used a binomial error distribution and no row effect to fit the model since we were using presence/absence data. For the same reason, we used ‘mvabund’ 3.12.3 (Wang et al., 2012) to test for the effects of environmental covariates on community composition.
Because the boral ordination showed that the dominant driver of change in community composition is geographic distance, which is not surprising given the large spatial extent of our sampling (Fig. 1), we followed up with Multi-Site Generalized Dissimilarity Modelling (MS- GDM), using the ‘zetadiv’ 1.2.0 package (Latombe et al., 2017). Classical GDMs try to identify the dominant drivers of change in community composition by using a combination of pairwise (i.e. between-two-sites) differences in geographic distance and in environmental-covariate values to explain pairwise differences in community composition ( Fer-rier et al., 2007). However, pairwise differences in composition (e.g. 1- Jaccard) are dominated by the contributions of the many species that are present in just two samples (i.e. rare species), resulting in GDMs that more heavily weight the variables that explain turnover in rare species, such as geographic distance.
To identify the environmental variables that are more important for explaining the distributions of widespread species (i.e. those present in multiple samples), Latombe et al. (2017) combined GDMs with the concept of zeta diversity (Hui & McGeoch, 2014) to create MS-GDMs. Zeta diversity is a generalization of pairwise beta diversity and is the mean number of species shared by i number of sites, where i is known as the zeta order. Zeta diversity order 4, for instance, is the mean number of species shared by 4 sites (in a dataset of 100 sites, there are ~ 3.9 million combinations of 4 sites). Zeta diversities can be converted to multi-site equivalents of the pairwise Jaccard dissimilarity and used as response variables in an MS-GDM (Latombe et al., 2017, 2019), with the six environmental covariates as candidate predictors (Table 1), rescaled between 0 and 1. We also used zeta diversity to ask if the insect com-munities in low- and high-infestation forests show evidence for different assembly mechanisms, by using the ‘zetadiv’ package to calculate zeta diversity decline and species retention rates for low- and for high- infestation forests. Finally, we partitioned variation in zeta diversity into environmental, distance, indistinguishable, and unexplained components.
To compare alpha diversity across infestation levels (Species rich-ness, Shannon and Simpson diversities), we used the sample-based rarefaction-extrapolation approach in the ‘iNEXT’ 2.0.12 package (Hsieh et al., 2016). Significant differences in estimated alpha diversity were judged by non-overlapping confidence intervals, which is consid-ered slightly conservative (MacGregor-Fors & Payton, 2013). In case we had oversplit some biological species into multiple OTUs, leading to artefactual differences in species richness, we also carried out a phylogenetic-diversity (PD) analysis because a single species split into multiple OTUs should cluster on a phylogenetic tree and thus contribute less to PD than two OTUs from two different biological species. Our protocol followed that of Wang et al. (2019), in which we aligned the OTU sequences, built a maximum-likelihood (ML) phylogenetic tree (details in S2), and estimated PD with the ‘iNextPD’ 0.3.2 package (Hsieh & Chao, 2017). We omitted two OTUs because they produced long branches.
3. Results
3.1. Bioinformatic processing and taxonomic composition
The six libraries yielded 11,128,217 paired-end reads. After removing a very large number of tag-jumped, paired-end reads (7,526,449), followed by DAMe filtering (retaining 1,217,449 sequences in ≥ 2 of the 6 PCRs per sample at ≥ 30 copies per PCR), and removal of chimeras and OTUs not assigned to Arthropoda, we ended up with 1,107,100 reads, clustered into 880 97% OTUs, for downstream anal-ysis. Mean reads per OTU was 1,258 (Range = 66–54,775; SD = 2930), and mean reads per sample was 36,903 (n = 30; range 3,881–72,575; SD = 17,396). These 880 OTUs were assigned to 35.8% Diptera, 21.7% Lepidoptera, 19.1% Hymenoptera, 9.7% Coleoptera, 7% Hemiptera, and 6.7% other orders.
Read depth varied across samples (Fig. S3A), and we found a positive correlation between read depth and species richness (Pearson, p < 0.001). Thus, to test the robustness of our results, we removed eight samples that had < 25,000 reads, which removed the positive correla-tion (Pearson, p = 0.68, Fig. S3B), reran the analyses below (3.2–3.5), and as we report below and in Supplementary Information (S4, S6, S9, S10), found essentially the same results. We report the full-dataset re-sults in the Main Text.
3.2. Boral ordination
Boral ordination (Fig. 2) clustered the 30 sites by the five counties in
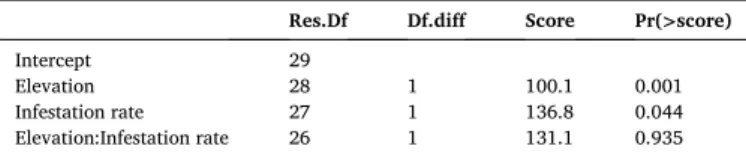
which we sampled (Fig. 1) and arranged the clusters by elevation (latent variable 1) and tree-infestation rate (latent variable 2). Mvabund anal-ysis confirmed the same effects (Table 2) and found no evidence for an interaction effect. Boral results without low-read-depth samples in
Fig. S4.
3.3. Multi-site generalized dissimilarity modelling
We carried out MS-GDM to identify the main drivers of change in community composition after controlling for geographical distance. Initially, we ran the model with five environmental covariates from
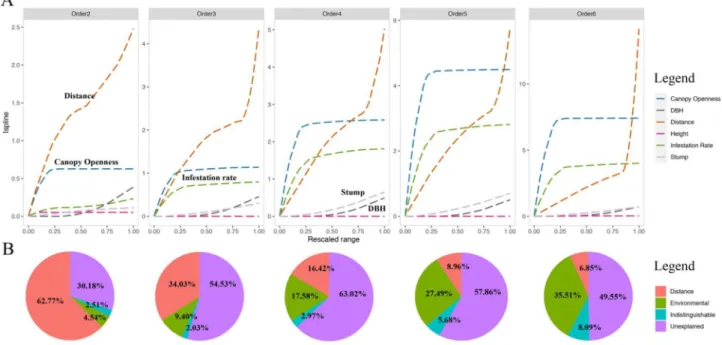
Table 1 (omitting elevation), plus geographic distances between sites, because geographic distance and elevation are correlated. At zeta order 2 (equivalent to the Jaccard index, which is pairwise and thus domi-nated by rare species), distance is the dominant driver of compositional turnover, followed by the local environmental variables canopy open-ness and DBH (Fig. 3A, Order2). Distance is largely linear in its effects,
Fig. 2. ‘Boral’ ordination of beta diversity by disturbance type. Color codes for outbreak severity as in Fig. 1. Symbols (and surrounding ovals) indicate the five counties, and points represent samples. Latent variable 1 predicts elevation (2296.43–169.31*LV1, R2 =88.0%, df = 28, p = 4.42e-15), and latent variable 2 predicts
tree-infestation rate (0.31–0.07*LV2, R2 =31.5%, df = 28, p = 0.0007). Boral residuals in Fig. S5. Table 2
Mvabund analysis. Testing for the effects of Elevation, Infestation rate, and their interaction on community composition.
Res.Df Df.diff Score Pr(>score)
Intercept 29
Elevation 28 1 100.1 0.001 Infestation rate 27 1 136.8 0.044 Elevation:Infestation rate 26 1 131.1 0.935
meaning that changes in community composition occur along the full range of distance, as rare species turnover from site to site and county to county. In contrast, for canopy openness, most compositional turnover occurs in the first 20% of its range, in the transition from closed to partially open-canopy forest, and for DBH, most change occurs in the last 20% of its range, in the transition to sites with the largest trees. MS-GDM with low-read-depth samples removed in Fig. S6.
By definition, as zeta order rises, common species increasingly dominate the analysis, and starting at zeta order 4 (Fig. 3A, Order4), the distance variable starts to be less important than the local variables of infestation rate and canopy openness, which both exert their effects primarily in the first ~ 20% of their ranges. That is, most of the compositional change occurs in the transition from 0% to infested-0%- open-canopy forests to 20%-infested-20%-open-canopy forests. At higher zeta orders, distance explains even less of the change in composition, except at very large distances, since common species are by definition more widespread.
We then re-ran the MS-GDM with elevation included, which returned similar results: as zeta order increases, the five environmental covariates other than elevation (Table 1) explain an increasingly larger proportion of total variation, while distance and elevation become less important (Fig. S7).
3.4. Zeta diversity decline and retention ratios
Another application of zeta diversity is to infer the relative roles of niche partitioning and stochastic assembly in community assembly (McGeoch et al., 2019). Zeta diversity declines as zeta order increases, since fewer and fewer species are shared amongst more and more sites. Steeper rates of decline indicate greater numbers of rarer species over more common species. Here, we asked how infestation affects commu-nity assembly over the infestation-rate gradient. To simplify the com-parison, we divided the sites roughly evenly into ‘low’ (≤0.25, n = 14) and ‘high’ (>0.25, n = 16) infestation-rate categories (Figs. 4 and S8), and tested the goodness of zeta-diversity decline functional forms using
the Akaike information criterion (AIC).
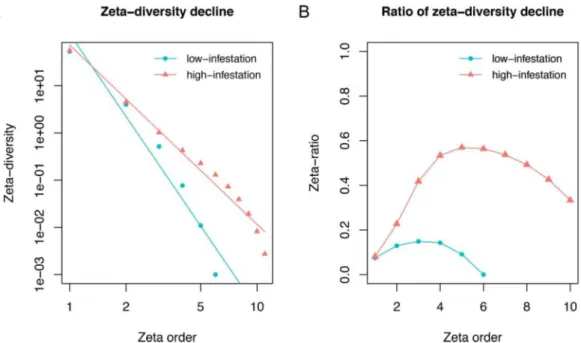
In the low-infestation forests, zeta-diversity decline is both steeper and better fit by an exponential function than by a power-law function (− 7.54AIC_exp < 10.67AIC_pl) (Fig. 4A). This is consistent with low-
infestation forests being characterized by a stochastic assembly pro-cess. In the extreme form, there is no niche partitioning; all the species have equal probability of occurring at any given site despite environ-mental variation across sites, and across-species variation in occupancy and turnover arises only stochastically, due to, for instance, random dispersal governing establishment (Hui & McGeoch, 2014; McGeoch et al., 2019). Consistent with this, the zeta-ratio analysis shows fewer common species and generally low retention of species when a new site is sampled (McGeoch et al. 2019, Fig. 4B).
In contrast, in the high-infestation forests, zeta-diversity decline is relatively shallower and better fit by power-law function (8.52AIC_exp >
0.80AIC_pl) (Fig. 4A), which obtains when the probability that a species
occurs in a newly sampled site increases with that species’ overall oc-cupancy, which in turn is consistent with community assembly being driven by niche differentiation. Each OTU has a species-specific proba-bility of occurring at a site due to environmental conditions at that site (Hui & McGeoch, 2014; McGeoch et al., 2019). The zeta-ratio analysis shows that species in the high-infestation forests generally have higher occupancy, even beyond order 6 (Fig. 4B), which is the number of sites per county (Fig. 2) and which thus shows that high-infestation forests share species across large geographic distances, apparently because of shared environmental conditions (Fig. 3A). (See Fig. S9 for the same analysis with low-read-depth samples removed).
3.5. Alpha diversity
The iNEXT and iNextPD analyses found no evidence for a difference in species or phylogenetic diversity between low- and high-infestation forests (Fig. 5, iNEXT analyses with low-read-depth samples removed in Fig. S10).
Fig. 3. Multi Site Generalised Dissimilarity Modelling (MS-GDM) analysis. A. Contributions of five environmental covariates and distance to explaining zeta diversity
and B. and variation partitioning. Environmental covariates were rescaled between 0 and 1. The vertical axes indicate the relative contributions of each environ-mental variable, at each zeta order. Geographic distance is most important at low zeta orders, which are dominated by rare species, and as zeta order increases (increasing the importance of common species), canopy openness and then infestation rate become increasingly more important, with most of the compositional change occurring in the first 20% of change in those two covariates. Overall when zeta order > 4, environmental covariates explain more compositional change than distance.
4. Discussion
Metabarcoding of Malaise-trapped insects reveals that bark-beetle induced forest dieback does not result in detectable differences in spe-cies richness or phylogenetic diversity (Fig. 5) but does result in compositional change (Figs. 2 and 3). For rarer species, MS-GDM and boral ordination explain this turnover with distance and elevation (Figs. 2 and 3), which are correlated in our sampling design (Fig. 1). For more common species, local-forest environmental variables explain relatively more of the compositional differences, with the biggest compositional change occurring between 0% and infested-0%-open- canopy forests and 20%-infested-20%-open-canopy forests (Figs. 3 and S7). Bark-beetle dieback thus appears to affect the larger insect
community (at least the portion that can be sampled by Malaise traps) by mimicking the transition between closed-canopy forest and structurally heterogeneous forest. That said, at higher zeta orders, just over half of compositional variation across sites remains unexplained (Fig. 3).
The zeta-decline analysis found that low-infestation sites showed evidence of stochastic assembly, while high-infestation forest sites showed evidence of niche partitioning as the dominant community as-sembly mechanism (Fig. 4). This suggests that the species which colo-nize the higher-infestation-rate (and higher-energy-availability) sites are adapted to these conditions.
Interestingly, Müller et al. (2010) have also reported that saproxylic beetle composition changes nonlinearly with canopy openness (measured as LiDAR penetration), with rapid compositional change
Fig. 4. Community assembly mechanism. A. Comparison of zeta diversity decline and B. retention rate between low- and high-infestation forests. Zeta orders 1 to 11
are shown, as zeta diversity equals zero for orders > 11. High-infestation sites A. are characterized by a power-law decline and B. share more common species, consistent with a niche-differentiated community. Low-infestation sites A. are characterized by an exponential zeta decline and B. share fewer common species, consistent with a stochastic community-assembly process.
Fig. 5. Alpha diversity analysis by A. iNEXT and B. iNextPD. Sample-size-based rarefaction (solid lines) and extrapolation (dashed lines) sampling curves for three
measures of A. species diversity and B. phylogenetic diversity in low-infestation and high-infestation forests. Shaded areas represent 95% confidence intervals. Symbols indicate sample size per forest type. Overlapping confidence intervals indicate no evidence for difference between forest types.
occurring from closed canopy up to 23% penetration (11–49% 95% CI), after which composition changes slowly. Our results are thus remark-ably similar (Figs. 3 and S7), despite differences in geography, dominant tree species, and focal taxa, and we speculate that the driving mecha-nism is the effect of light availability on understorey vegetation and microclimate. Seibold et al. (2016a) have also reported that canopy openness is a major driver of species assemblage composition of non- saproxylic epigeal arthropods after intensive logging (see also Bishop et al., 2009; Bouget et al., 2013; Franc et al., 2007). Unfortunately, unlike Müller et al. (2010), we were unable to measure the biodiversity effects of deadwood volume (and thus, the effect of deadwood removal), given that, to our knowledge, there are no Pinus yunnanensis sites in Yunnan with high amounts of deadwood to contrast with low- deadwood-volume sites. If possible, there would be value in running deadwood enrichment experiments in Yunnan, in order to test the pre-diction that saproxylic animal and fungal species will benefit (Doerfler et al., 2018; Seibold et al., 2015, 2018). With that important omission, our results in Yunnan seem consistent with Thorn et al.’s (2020) diag-nosis of biodiversity decline in European forests, which they attribute to the loss of tree species diversity and the loss of age and structural het-erogeneity, which together provide microhabitats for light-demanding plant and insect species. Species, age, and structural heterogeneity also likely contribute to resilience against large-scale bark-beetle out-breaks (Seidl et al., 2016). On the other hand, Trzcinski & Reid (2008)
argue that deadwood removal could be effective at preventing the long- distance spread of bark-beetle outbreaks.
Given China’s recent announcement that afforestation and refores-tation efforts should now aim to create heterogeneous forests that are higher in biodiversity and more resilient to disease and pests, what is the best way to achieve this? Part of the solution is to allow natural dis-turbances to create forest structural and age heterogeneity, which in turn will benefit light-demanding plants and animals and also provide deadwood volume for saproxylic taxa (Thorn et al., 2020). These natural disturbances include windstorms, bark-beetle outbreaks, and drought- induced diebacks, as long as dead trees are not subsequently removed and open areas not replanted with plantation trees (Thorn et al., 2020). In particular, bark beetles can be seen as a keystone species (Müller et al., 2008), with their attacks on weak and old trees accelerating the succession of monoculture forests into heterogeneous forests (Cai et al., 2006; Yue et al., 2011). However, extreme climate events are predicted to increase, resulting in a greater rate and severity of natural distur-bances (Allen et al., 2010, 2015; Thom et al., 2017; Thom & Seidl, 2016), including an expansion of bark beetles to higher latitudes and elevations (Bentz et al., 2010; Hl´asny et al., 2011), which raises the short-term costs of allowing bark beetle outbreaks to proceed unim-peded. Thus, in many areas, anthropogenic treatments could be imple-mented to accelerate the succession of plantation forests into heterogeneous forests (Baeten et al., 2019; Felipe-Lucia et al., 2018; Schall et al., 2018; Yue et al., 2011), especially given that Pinus
yunna-nensis covers large areas of poor soil, where tree growth is generally slow
and seed sources of other tree species distant.
Methodological considerations. – The combination of metabarcoding
and Malaise traps, which preferentially capture species-rich Hymenop-tera and DipHymenop-tera, naturally produces datasets with a large proportion of low-prevalence species. In consequence, we used zeta diversity and MS- GDM to analyse community subsets of increasingly more common spe-cies, which showed that local environmental covariates were more important for explaining species distributions at higher orders (Fig. 3). Zeta-decline analysis showed that high-infestation and low-infestation sites differed in their community assembly mechanisms (Fig. 4). In short, removal of the lowest-prevalence species made clearer the effects of forest structure on community composition. In contrast, we failed to find any differences in alpha diversity across low- and high-infestation forests, even for the measures that clearly reached an asymptote: Simpson diversity, Phylogenetic entropy, and Rao’s quadratic entropy (Fig. 5). That said, our study is underpowered for comparing alpha
diversities, and we draw only a tentative conclusion on this front. Finally, to test robustness, we reran all analyses after removing the eight lowest-read-depth samples, which removed the correlation between read-depth and species richness, and we recovered the same results (S4, S6, S9, S10).
Another aspect of metabarcoding is that it can be applied to samples from locations where taxonomic coverage is poor, such as arthropods from Southwest China. The resulting OTU dataset, identified only to higher taxonomic ranks, can be used to visualise biodiversity patterns. However, with limited taxonomic information, we are unable to carry out functional (trait-based) analyses to try to explain why particular taxa are favoured or disfavoured under different silvicultural regimes (e.g.
Cours et al., 2020; Thorn et al., 2018). We also note that our dataset represents only a single time point, while temporal turnover of forest arthropod communities appears to be high (Barsoum et al., 2019). However, we have shown elsewhere (Zhang et al., 2016) that meta-barcoding sample sets taken in rainy season and in dry season are equally able to differentiate forest disturbance gradients, and we have shown in two large studies that Malaise-trapped invertebrates show similar responses to several other methods and taxa in their responses to forest structure and disturbance (Ji et al., 2013; Edwards et al., 2014).
Thorn et al. (2018) also found taxonomic congruence in biodiversity response to salvage logging. In the future, one partial way around the lack of taxonomic information for functional inference is to apply joint species distribution modelling to DNA-based time series datasets to infer the relative contributions of environmental covariates and species in-teractions to changes in species abundances (Abrego et al., 2021).
Conclusion. – Long-term monitoring will be necessary for tracking the
biodiversity consequences of conversion from simple to heterogeneous forests and for comparing different anthropogenic treatments. Studies in China, the UK, and Borneo have shown that DNA metabarcoding is an efficient and standardizable tool for measuring how animal biodiversity in forests varies as a function of management and inherent condition (Barsoum et al., 2019; Edwards et al., 2014; Hua et al., 2016; Ji et al., 2013, 2020; Wang et al., 2019; Yang et al., 2014; Yang et al., 2016; Zhang et al., 2016). We also think that there is considerable scope for using remotely sensed measures (multispectral and LiDAR) to efficiently generate environmental covariates for the large-scale mapping and monitoring of pest outbreaks like bark beetles in particular (Ji et al., 2007; Wang et al., 2015) and terrestrial biodiversity in general (Bush et al., 2017).
CRediT authorship contribution statement: D.W.Y., C.LV.
designed the study. L.L. and C.LV. designed the environmental covariate measurements. C.Y.Y. and W.C. collected samples and made the envi-ronmental covariate measurements. W.C., C.Y.W. and C.Y.Y. performed the molecular experiments. W.C. and X.Y.W. performed the bio-informatic and statistical analyses. D.W.Y., W.C. and Q.Z.W. contributed to the manuscript.
Declaration of Competing Interest
The authors declare the following financial interests/personal re-lationships which may be considered as potential competing interests: D. W.Y. is a co-founder of NatureMetrics (www.naturemetrics.co.uk), which provides commercial metabarcoding services.
Acknowledgements
We are grateful to Michael Monaghan, Lucas Sire and Paul Schmidt Y´a˜nez for study design discussion and to Ze Sangzi and Luo Jiashan for helping with sample collection. This research is part of the international project CLIMTREE “Ecological and Socioeconomic Impacts of Climate- Induced Tree Diebacks in Highland Forests » within the Belmont Forum Call: Mountains as Sentinels of Change”. C.LV. and L.L. were supported by the French National Research Agency (ANR) (ANR-15- MASC-002-01). Q.Z.W. was supported by Research and Application
Demonstration on Key Technology of Primary Forest Resources Inves-tigation and Monitoring in Yunnan Province (2013CA004). W.C., C.Y.Y., D.W.Y., W.X.Y., C.Y.W. were supported by the Strategic Priority Research Program of the Chinese Academy of Sciences (XDA20050202), the National Natural Science Foundation of China (41661144002, 31670536, 31400470, 31500305), the Key Research Program of Fron-tier Sciences, CAS (QYZDY-SSW-SMC024), the Bureau of International Cooperation (GJHZ1754), the Ministry of Science and Technology of China (2012FY110800), the State Key Laboratory of Genetic Resources and Evolution (GREKF18-04) at the Kunming Institute of Zoology, the University of East Anglia, and the University of Chinese Academy of Sciences.
Data accessibility statement
Sequence data are under GenBank accession number PRJNA668449. Bioinformatic scripts, R scripts are available at https://github.com/ CaiWang0503/climtree_China.
Appendix A. Supplementary material
Supplementary data to this article can be found online at https://doi. org/10.1016/j.foreco.2021.119173.
References
Abrego, N., Roslin, T., Huotari, T., Ji, Y.Q., Schmidt, N.M., Wang, J.X., Yu, D.W., Ovaskainen, O., (in press) Accounting for trophic interactions is necessary for predicting how arctic arthropods respond to climate warming. Ecography. Alberdi, A., Aizpurua, O., Gilbert, M.T.P., Bohmann, K., 2018. Scrutinizing key steps for
reliable metabarcoding of environmental samples. Methods Ecol. Evol. 9, 134–147.
https://doi.org/10.1111/2041-210X.12849.
Allen, C.D., Breshears, D.D., McDowell, N.G., 2015. On underestimation of global vulnerability to tree mortality and forest die-off from hotter drought in the Anthropocene. Ecosphere 6, 1–55. https://doi.org/10.1890/ES15-00203.1. Allen, C.D., Macalady, A.K., Chenchouni, H., Bachelet, D., McDowell, N., Vennetier, M.,
Kitzberger, T., Rigling, A., Breshears, D.D., Hogg, E.H.Ted., Gonzalez, P., Fensham, R., Zhang, Z., Castro, J., Demidova, N., Lim, J.H., Allard, G., Running, S. W., Semerci, A., Cobb, N., 2010. A global overview of drought and heat-induced tree mortality reveals emerging climate change risks for forests. For. Ecol. Manage. 259, 660–684. https://doi.org/10.1016/j.foreco.2009.09.001.
Aylagas, E., Borja, ´A., Muxika, I., Rodríguez-Ezpeleta, N., 2018. Adapting
metabarcoding-based benthic biomonitoring into routine marine ecological status assessment networks. Ecol. Ind. 95, 194–202. https://doi.org/10.1016/j. ecolind.2018.07.044.
Baeten, L., Bruelheide, H., van der Plas, F., Kambach, S., Ratcliffe, S., Jucker, T., Allan, E., Ampoorter, E., Barbaro, L., Bastias, C.C., Bauhus, J., Benavides, R., Bonal, D., Bouriaud, O., Bussotti, F., Carnol, M., Castagneyrol, B., Charbonnier, Y., Che´cko, E., Scherer-Lorenzen, M., 2019. Identifying the tree species compositions that maximize ecosystem functioning in European forests. J. Appl. Ecol. 56, 733–744. https://doi.org/10.1111/1365-2664.13308.
Barsoum, N., Bruce, C., Forster, J., Ji, Y.Q., Yu, D.W., 2019. The devil is in the detail: Metabarcoding of arthropods provides a sensitive measure of biodiversity response to forest stand composition compared with surrogate measures of biodiversity. Ecol. Ind. 101, 313–323. https://doi.org/10.1016/j.ecolind.2019.01.023.
Bentz, B.J., Rgnire, J., Fettig, C.J., Hansen, E.M., Hayes, J.L., Hicke, J.A., Kelsey, R.G., Negron, J.F., Seybold, S.J., 2010. Climate change and bark beetles of the western United States and Canada: Direct and indirect effects. Bioscience 60, 602–613.
https://doi.org/10.1525/bio.2010.60.8.6.
Bishop, D.L.J., Majka, C.G., Bondrup-Nielsen, S., Peck, S.B., 2009. Deadwood and saproxylic beetle diversity in naturally disturbed and managed spruce forests in Nova Scotia. ZooKeys 22, 309–340. https://doi.org/10.3897/zookeys.22.144. Bohmann, K., Gopalakrishnan, S., Nielsen, M., Nielsen, L.dos S.B., Jones, G., Streicker, D.
G., Gilbert, M.T.P., 2018. Using DNA metabarcoding for simultaneous inference of common vampire bat diet and population structure. Mol. Ecol. Resour. 18, 1050–1063. https://doi.org/10.1111/1755-0998.12891.
Bouget, C., Larrieu, L., Nusillard, B., Parmain, G., 2013. In search of the best local habitat drivers for saproxylic beetle diversity in temperate deciduous forests. Biodivers. Conserv. 22, 2111–2130. https://doi.org/10.1007/s10531-013-0531-3. Brockerhoff, E.G., Jactel, H., Parrotta, J.A., Ferraz, S.F.B., 2013. Role of eucalypt and
other planted forests in biodiversity conservation and the provision of biodiversity- related ecosystem services. For. Ecol. Manage. 301, 43–50. https://doi.org/10.1016/ j.foreco.2012.09.018.
Bush, A., Sollmann, R., Wilting, A., Bohmann, K., Cole, B., Balzter, H., Martius, C., Zlinszky, A., Calvignac-Spencer, S., Cobbold, C.A., Dawson, T.P., Emerson, B.C., Ferrier, S., Gilbert, M.T.P., Herold, M., Jones, L., Leendertz, F.H., Matthews, L., Millington, J.D.A., Yu, D.W., 2017. Connecting Earth observation to high-throughput
biodiversity data. Nat. Ecol. Evol. 1, 0176. https://doi.org/10.1038/s41559-017- 0176.
Cai, N.H., Li, G.Q., Lu, Y.C., 2006. Discussion on the approaching nature forestry management of Pinus yunnanensis pure forest. J. North West Forestry Univ. 21, 85–88 +120.
Carroll, A.L., Taylor, S.W., Regniere, J., Safranyik, L., 2004. In: Effects of climate and climate change on the mountain pine beetle. Information Report BC-X-399, Kelowna, British Columbia, Canada. Natural Resources Canada, Canadian Forest Service, Pacific Forestry Centre, Victoria, BC, pp. 21–32.
Cao, S., Zhang, J., Su, W., 2019. Difference in the net value of ecological services between natural and artificial forests in China. Conserv. Biol. 33, 1076–1083.
https://doi.org/10.1111/cobi.13293.
Cordier, T., Esling, P., Lejzerowicz, F., Visco, J., Ouadahi, A., Martins, C., Cedhagen, T., Pawlowski, J., 2017. Predicting the ecological quality status of marine environments from eDNA metabarcoding data using supervised machine learning. Environ. Sci. Technol. 51, 9118–9126. https://doi.org/10.1021/acs.est.7b01518.
Cours, J., Larrieu, L., Lopez-Vaamonde, C., Müller, J., Parmain, G., Thorn, S., Bouget, C., 2021. Contrasting responses of habitat conditions and insect biodiversity to pest- or climate-in. For. Ecol. Manage. 482, 118811 https://doi.org/10.1016/j.
foreco.2020.118811.
Cullingham, C.I., Cooke, J.E.K., Dang, S., Davis, C.S., Cooke, B.J., Coltman, D.W., 2011. Mountain pine beetle host-range expansion threatens the boreal forest. Mol. Ecol. 20, 2157–2171. https://doi.org/10.1111/j.1365-294X.2011.05086.x.
Delang, C.O., Yuan, Z., 2015. China’s grain for green program. Springer International Publishing, Switzerland.
Deng, X.Q., Huang, B.L., Wen, Q.Z., Hua, C.L., Tao, J., 2013. A research on the distribution of Pinus yunnanensis forest in Yunnan Province. J. Yunnan Univ. 35, 843–848. https://doi.org/10.7540/j.yun.20130114.
Deng, X.Q., Huang, B.L., Wen, Q.Z., Hua, C.L., Tao, J., Zhang, J.H., 2014. Dynamic of
Pinus yunnanensis forest resources in Yunnan. J. Natl. Resour. 29, 1411–1419. http s://doi.org/10.11849/zrzyxb.2014.08.013.
Doerfler, I., Gossner, M.M., Müller, J., Seibold, S., Weisser, W.W., 2018. Deadwood enrichment combining integrative and segregative conservation elements enhances biodiversity of multiple taxa in managed forests. Biol. Conserv. 228, 70–78. https:// doi.org/10.1016/j.biocon.2018.10.013.
Edwards, D.P., Magrach, A., Woodcock, P., Ji, Y., Lim, N.T.L., Edwards, F.A., Larsen, T. H., Hsu, W.W., Benedick, S., Khen, C.V., Chung, A.Y.C., Reynolds, G., Fisher, B., Laurance, W.F., Wilcove, D.S., Hamer, K.C., Yu, D.W., 2014. Selective-logging and oil palm: Multitaxon impacts, biodiversity indicators, and trade-offs for conservation planning. Ecol. Appl. 24, 2029–2049. https://doi.org/10.1890/14-0010.1. Elbrecht, V., Peinert, B., Leese, F., 2017. Sorting things out: Assessing effects of unequal
specimen biomass on DNA metabarcoding. Ecol. Evol. 7, 6918–6926. https://doi. org/10.1002/ece3.3192.
Erbilgin, N., Cale, J.A., Lusebrink, I., Najar, A., Klutsch, J.G., Sherwood, P., Bonello, P.E., Evenden, M.L., 2017. Water-deficit and fungal infection can differentially affect the production of different classes of defense compounds in two host pines of mountain pine beetle. Tree Physiol. 37, 338–350. https://doi.org/10.1093/treephys/tpw105. Esper, J., Büntgen, U., Frank, D.C., Nievergelt, D., Liebhold, A., 2007. 1200 years of
regular outbreaks in alpine insects. Proc. Royal Soc. B: Biol. Sci. 274, 671–679.
https://doi.org/10.1098/rspb.2006.0191.
Felipe-Lucia, M.R., Soliveres, S., Penone, C., Manning, P., van der Plas, F., Boch, S., Prati, D., Ammer, C., Schall, P., Gossner, M.M., Bauhus, J., Buscot, F., Blaser, S., Blüthgen, N., de Frutos, A., Ehbrecht, M., Frank, K., Goldmann, K., H¨ansel, F., Allan, E., 2018. Multiple forest attributes underpin the supply of multiple ecosystem services. Nat. Commun. 9, 4839. https://doi.org/10.1038/s41467-018-07082-4. Ferrier, S., Manion, G., Elith, J., Richardson, K., 2007. Using generalized dissimilarity
modelling to analyse and predict patterns of beta diversity in regional biodiversity assessment. Divers. Distrib. 13, 252–264. https://doi.org/10.1111/j.1472- 4642.2007.00341.x.
Franc, N., G¨otmark, F., Økland, B., Nord´en, B., Paltto, H., 2007. Factors and scales potentially important for saproxylic beetles in temperate mixed oak forest. Biol. Conserv. 135, 86–98. https://doi.org/10.1016/j.biocon.2006.09.021.
Frøslev, T.G., Kjøller, R., Bruun, H.H., Ejrnæs, R., Brunbjerg, A.K., Pietroni, C., Hansen, A. J., 2017. Algorithm for post-clustering curation of DNA amplicon data yields reliable biodiversity estimates. Nat. Commun. 8, 1188. https://doi.org/10.1038/s41467- 017-01312-x.
Gan, L.R., 2015. A battle for the life of pine forests with bark beetles. Yunnan forestry 36 (5), 31–33.
Gilbert, M.T.P., Moore, W., Melchior, L., Worebey, M., 2007. DNA extraction from dry museum beetles without conferring external morphological damage. PLoS ONE 2, e272. https://doi.org/10.1371/journal.pone.0000272.
He, D.M., Zhang, F.Q., 2004. Conservation and control of bark beetles in Yunnan Province. Forest Inventory and Planning 5, 251–253.
Hilmers, T., Friess, N., B¨assler, C., Heurich, M., Brandl, R., Pretzsch, H., Seidl, R., Müller, J., 2018. Biodiversity along temperate forest succession. J. Appl. Ecol. 55, 2756–2766. https://doi.org/10.1111/1365-2664.13238.
Hl´asny, T., Zajíˇckov´a, L., Turˇc´ani, M., Holuˇsa, J., Sitkov´a, Z., 2011. Geographical variability of spruce bark beetle development under climate change in the Czech Republic. J. Forest Sci. 57, 242–249. https://doi.org/10.17221/104/2010-jfs. Hsieh, T.C., Chao, A., 2017. Rarefaction and extrapolation: Making fair comparison of
abundance-sensitive phylogenetic diversity among multiple assemblages. Syst. Biol. 66, 100–111. https://doi.org/10.1093/sysbio/syw073.
Hsieh, T.C., Ma, K.H., Chao, A., 2016. iNEXT: an R package for rarefaction and extrapolation of species diversity (Hill numbers). Methods Ecol. Evol. 7, 1451–1456.
Hua, F., Wang, L., Fisher, B., Zheng, X., Wang, X., Yu, D.W., Tang, Y., Zhu, J., Wilcove, D. S., 2018. Tree plantations displacing native forests: The nature and drivers of apparent forest recovery on former croplands in Southwestern China from 2000 to 2015. Biol. Conserv. 222, 113–124. https://doi.org/10.1016/j.biocon.2018.03.034. Hua, F., Wang, X., Zheng, X., Fisher, B., Wang, L., Zhu, J., Tang, Y., Yu, D.W., Wilcove, D. S., 2016. Opportunities for biodiversity gains under the world’s largest reforestation programme. Nat. Commun. 7, 1–11. https://doi.org/10.1038/ncomms12717. Hui, C., McGeoch, M.A., 2014. Zeta diversity as a concept and metric that unifies incidence-based biodiversity patterns. Am. Nat. 184, 684–694. https://doi.org/ 10.1086/678125.
Hui, F.K.C., 2016. boral – Bayesian Ordination and Regression Analysis of Multivariate Abundance Data in r. Methods Ecol. Evol. 7, 744–750. https://doi.org/10.1111/ 2041-210X.12514.
Ji, M., Xie-qiong, D., Hong-ping, L., Li-shai, L., Hong, X., Xiao-peng, Y., Haoran, L., Sang- zi, Z., 2007. Preliminary study on remote sensing detection of Yunnan pine forest damaged by Tomicus piniperda. J. West China Forestry Sci. 36, 87–90.
Ji, Y., Ashton, L., Pedley, S.M., Edwards, D.P., Tang, Y., Nakamura, A., Kitching, R., Dolman, P.M., Woodcock, P., Edwards, F.A., Larsen, T.H., Hsu, W.W., Benedick, S., Hamer, K.C., Wilcove, D.S., Bruce, C., Wang, X., Levi, T., Lott, M., Yu, D.W., 2013. Reliable, verifiable and efficient monitoring of biodiversity via metabarcoding. Ecol. Lett. 16, 1245–1257. https://doi.org/10.1111/ele.12162.
Ji, Y., Baker, C. C., Li, Y., Popescu, V., Wang, Z., Wang, J., Wang, L., Wu, C., Hua, C., Yang, Z., Yang, C., Xu, C. C., Wen, Q., Pierce, N., & Yu, D. (2020). Large-scale Quantification of Vertebrate Biodiversity in Ailaoshan Nature Reserve from Leech iDNA. bioRχiv. https://doi.org/10.1101/2020.02.10.941336.
Joshi, N. A., & Fass, J. N. (2011). Sickle: A sliding-window, adaptive, quality-based trimming tool for FastQ files (Version 1.33) [Software]. Available at https://github. com/najoshi/sickle.
Kichas, N.E., Hood, S.M., Pederson, G.T., Everett, R.G., McWethy, D.B., 2020. Whitebark pine (Pinus albicaulis) growth and defense in response to mountain pine beetle outbreaks. For. Ecol. Manage. 457, 117736 https://doi.org/10.1016/j. foreco.2019.117736.
Kirkendall, L., Faccoli, M., Ye, H., 2008. Description of the Yunnan shoot borer, Tomicus
yunnanensis Kirkendall & Faccoli sp. n. (Curculionidae, Scolytinae), an unusually
aggressive pine shoot beetle from southern China, with a key to the species of
Tomicus. Zootaxa 1819, 25–39. https://doi.org/10.5281/zenodo.182961. Latombe, G., Hui, C., McGeoch, M.A., 2017. Multi-site generalised dissimilarity
modelling: using zeta diversity to differentiate drivers of turnover in rare and widespread species. Methods Ecol. Evol. 8, 431–442. https://doi.org/10.1111/2041- 210X.12756.
Latombe, G., Roura-Pascual, N., Hui, C., 2019. Similar compositional turnover but distinct insular environmental and geographical drivers of native and exotic ants in two oceans. J. Biogeogr. 46, 2299–2310. https://doi.org/10.1111/jbi.13671. Lejzerowicz, F., Esling, P., Pillet, L., Wilding, T.A., Black, K.D., Pawlowski, J., 2015.
High-throughput sequencing and morphology perform equally well for benthic monitoring of marine ecosystems. Sci. Rep. 5, 13932. https://doi.org/10.1038/ srep13932.
Leray, M., Ho, S.L., Lin, I.J., Machida, R.J., 2018. MIDORI server: a webserver for taxonomic assignment of unknown metazoan mitochondrial-encoded sequences using a curated database. Bioinformatics 34, 3753–3754. https://doi.org/10.1093/ bioinformatics/bty454.
Leray, M., Yang, J.Y., Meyer, C.P., Mills, S.C., Agudelo, N., Ranwez, V., Boehm, J.T., Machida, R.J., 2013. A new versatile primer set targeting a short fragment of the mitochondrial COI region for metabarcoding metazoan diversity: Application for characterizing coral reef fish gut contents. Front. Zool. 10, 1–14. https://doi.org/ 10.1186/1742-9994-10-34.
Lieutier, F., Ye, H., Yart, A., 2003. Shoot damage by Tomicus sp. (Coleoptera: Scolytidae) and effect on Pinus yunnanensis resistance to subsequent reproductive attacks in the stem. Agric. For. Entomol. 5, 227–233. https://doi.org/10.1046/j.1461- 9563.2003.00182.x.
Lindenmayer, D.B., Burton, P.J., Franklin, J.F., 2008. Salvage logging and its ecological consequences. Island Press.
Liu, J., Li, S., Ouyang, Z., Tam, C., Chen, X., 2008. Ecological and socioeconomic effects of China’s policies for ecosystem services. PNAS 105, 9477–9482. https://doi.org/ 10.1073/pnas.0706436105.
Lü, J., Hu, S.J., Ma, X.Y., Chen, J.M., Li, Q.Q., Ye, H., 2014. Origin and expansion of the Yunnan shoot borer, Tomicus Yunnanensis (Coleoptera: Scolytinae): A mixture of historical natural expansion and contemporary human-mediated relocation. PLoS ONE 9, e111940. https://doi.org/10.1371/journal.pone.0111940.
Lu, N., Zhang, X., 2000. Techniques of cleaning Tomicus piniperda damaged woods in
Pinus yunnanensis stand. Yunnan Forestry Sci. Technol. 91, 43–45. https://doi.org/ 10.16473/j.cnki.xblykx1972.2000.02.011.
Ma, K., Shen, X., Grumbine, R.E., Corlett, R., 2017. China’s biodiversity conservation research in progress. Biol. Conserv. 210, 1–2. https://doi.org/10.1016/j. biocon.2017.05.029.
MacGregor-Fors, I., Payton, M.E., 2013. Contrasting diversity values: statistical inferences based on overlapping confidence intervals. PLoS ONE 8, 8–11. https:// doi.org/10.1371/journal.pone.0056794.
Masella, A.P., Bartram, A.K., Truszkowski, J.M., Brown, D.G., Neufeld, J.D., 2012. PANDAseq: Paired-end assembler for illumina sequences. BMC Bioinf. 13, 31–37.
https://doi.org/10.1186/1471-2105-13-31.
McGeoch, M.A., Latombe, G., Andrew, N.R., Nakagawa, S., Nipperess, D.A., Roig´e, M., Marzinelli, E.M., Campbell, A.H., Verg´es, A., Thomas, T., Steinberg, P.D., Selwood, K.E., Henriksen, M.V., Hui, C., 2019. Measuring continuous compositional change using decline and decay in zeta diversity. Ecology 100, e02832. https://doi. org/10.1002/ecy.2832.
Mercier, C., Boyer, F., Bonin, A., & Coissac, E., 2013. SUMATRA and SUMACLUST: fast and exact comparison and clustering of sequences. In Programs and Abstracts of the SeqBio 2013 workshop. Abstract. https://doi.org/10.1109/RCIS.2013.6577673. Müller, J., Bußler, H., Goßner, M., Rettelbach, T., Duelli, P., 2008. The European spruce
bark beetle Ips typographus in a national park: From pest to keystone species. Biodivers. Conserv. 17, 2979–3001. https://doi.org/10.1007/s10531-008-9409-1. Müller, J., Noss, R.F., Bussler, H., Brandl, R., 2010. Learning from a “ benign neglect
strategy” in a national park: Response of saproxylic beetles to dead wood accumulation. Biol. Conserv. 143, 2559–2569. https://doi.org/10.1016/j. biocon.2010.06.024.
Murray, D.C., Coghlan, M.L., Bunce, M., 2015. From benchtop to desktop: Important considerations when designing amplicon sequencing workflows. PLoS ONE 10, 1–21.
https://doi.org/10.1371/journal.pone.0124671.
Nielsen, M., Gilbert, M.T.P., Pape, T., Bohmann, K., 2019. A simplified DNA extraction protocol for unsorted bulk arthropod samples that maintains exoskeletal integrity. Environmental DNA 1, 144–154. https://doi.org/10.1002/edn3.16.
Nikolenko, S.I., Korobeynikov, A.I., Alekseyev, M.A., 2013. BayesHammer: Bayesian clustering for error correction in single-cell sequencing. BMC Genomics 14, 1–11.
https://doi.org/10.1186/1471-2164-14-S1-S7.
Paletto, A., Tosi, V., 2009. Forest canopy cover and canopy closure: Comparison of assessment techniques. Eur. J. Forest Res. 128, 265–272. https://doi.org/10.1007/ s10342-009-0262-x.
Pawlowski, J., Esling, P., Lejzerowicz, F., Cordier, T., Visco, J.A., Martins, C.I.M., Kvalvik, A., Staven, K., Cedhagen, T., 2016. Benthic monitoring of salmon farms in Norway using foraminiferal metabarcoding. Aquaculture Environ. Interactions 8, 371–386. https://doi.org/10.3354/AEI00182.
Piper, A.M., Batovska, J., Cogan, N.O.I., Weiss, J., Cunningham, J.P., Rodoni, B.C., Blacket, M.J., 2019. Prospects and challenges of implementing DNA metabarcoding for high-throughput insect surveillance. GigaScience 8, 1–22. https://doi.org/ 10.1093/gigascience/giz092.
Raffa, K.F., Berryman, A.A., 1983. The role of host plant resistance in the colonization behavior and ecology of bark beetles (coleoptera: scolytidae). Ecol. Monogr. 53, 27–49. https://doi.org/10.2307/1942586.
Ratnasingham, S., Hebert, P.D.N., 2007. The barcode of life data system. Mol. Ecol. Notes 7, 355–364. https://doi.org/10.1111/j.1471-8286.2006.01678.x.
Ren, G., Young, S.S., Wang, L., Wang, W., Long, Y., Wu, R., Li, J., Zhu, J., Yu, D.W., 2015. Effectiveness of China’s National Forest Protection Program and nature reserves. Conserv. Biol. 29, 1368–1377. https://doi.org/10.1111/cobi.12561.
Robertson, C., Farmer, C.J.Q., Nelson, T.A., MacKenzie, I.K., Wulder, M.A., White, J.C., 2009. Determination of the compositional change (1999–2006) in the pine forests of British Columbia due to mountain pine beetle infestation. Environ. Monit. Assess. 158, 593–608. https://doi.org/10.1007/s10661-008-0607-9.
Rognes, T., Flouri, T., Nichols, B., Quince, C., Mah´e, F., 2016. VSEARCH: A versatile open source tool for metagenomics. PeerJ 2016, 1–22. https://doi.org/10.7717/ peerj.2584.
Rost, J., Clavero, M., Brotons, L., Pons, P., 2012. The effect of postfire salvage logging on bird communities in Mediterranean pine forests: The benefits for declining species. J. Appl. Ecol. 49, 644–651. https://doi.org/10.1111/j.1365-2664.2012.02127.x. Sambaraju, K.R., Carroll, A.L., Zhu, J., Stahl, K., Moore, R.D., Aukema, B.H., 2012.
Climate change could alter the distribution of mountain pine beetle outbreaks in western Canada. Ecography 35, 211–223. https://doi.org/10.1111/j.1600- 0587.2011.06847.x.
Schall, P., Gossner, M.M., Heinrichs, S., Fischer, M., Boch, S., Prati, D., Jung, K., Baumgartner, V., Blaser, S., B¨ohm, S., Buscot, F., Daniel, R., Goldmann, K., Kaiser, K., Kahl, T., Lange, M., Müller, J., Overmann, J., Renner, S.C., Ammer, C., 2018. The impact of even-aged and uneven-aged forest management on regional biodiversity of multiple taxa in European beech forests. J. Appl. Ecol. 55, 267–278.
https://doi.org/10.1111/1365-2664.12950.
Schirmer, M., Ijaz, U.Z., D’Amore, R., Hall, N., Sloan, W.T., Quince, C., 2015. Insight into biases and sequencing errors for amplicon sequencing with the Illumina MiSeq platform. Nucleic Acids Res. 43, e37 https://doi.org/10.1093/nar/gku1341. Schnell, I.B., Bohmann, K., Gilbert, M.T.P., 2015. Tag jumps illuminated-reducing
sequence-to-sample misidentifications in metabarcoding studies. Mol. Ecol. Resour. 15, 1289–1303. https://doi.org/10.1111/1755-0998.12402.
Schubert, M., Lindgreen, S., Orlando, L., 2016. AdapterRemoval v2: Rapid adapter trimming, identification, and read merging. BMC Res. Notes 9, 1–7. https://doi.org/ 10.1186/s13104-016-1900-2.
Seibold, S., B¨assler, C., Baldrian, P., Reinhard, L., Thorn, S., Ulyshen, M.D., Weiß, I., Müller, J., 2016a. Dead-wood addition promotes non-saproxylic epigeal arthropods but effects are mediated by canopy openness. Biol. Conserv. 204, 181–188. https:// doi.org/10.1016/j.biocon.2016.09.031.
Seibold, S., B¨assler, C., Brandl, R., Büche, B., Szallies, A., Thorn, S., Ulyshen, M.D., Müller, J., 2016b. Microclimate and habitat heterogeneity as the major drivers of beetle diversity in dead wood. J. Appl. Ecol. 53, 934–943. https://doi.org/10.1111/ 1365-2664.12607.
Seibold, S., Hagge, J., Müller, J., Gruppe, A., Brandl, R., B¨assler, C., Thorn, S., 2018. Experiments with dead wood reveal the importance of dead branches in the canopy for saproxylic beetle conservation. For. Ecol. Manage. 409, 564–570. https://doi. org/10.1016/j.foreco.2017.11.052.
Seidl, R., Donato, D.C., Raffa, K.F., Turner, M.G., 2016. Spatial variability in tree regeneration after wildfire delays and dampens future bark beetle outbreaks. PNAS 113, 13075–13080. https://doi.org/10.1073/pnas.1615263113.
Seidl, R., Thom, D., Kautz, M., Martin-Benito, D., Peltoniemi, M., Vacchiano, G., Wild, J., Ascoli, D., Petr, M., Honkaniemi, J., Lexer, M.J., Trotsiuk, V., Mairota, P., Svoboda, M., Fabrika, M., Nagel, T.A., Reyer, C.P.O., 2017. Forest disturbances