HAL Id: halshs-00557220
https://halshs.archives-ouvertes.fr/halshs-00557220
Preprint submitted on 18 Jan 2011
HAL is a multi-disciplinary open access archive for the deposit and dissemination of sci-entific research documents, whether they are pub-lished or not. The documents may come from teaching and research institutions in France or abroad, or from public or private research centers.
L’archive ouverte pluridisciplinaire HAL, est destinée au dépôt et à la diffusion de documents scientifiques de niveau recherche, publiés ou non, émanant des établissements d’enseignement et de recherche français ou étrangers, des laboratoires publics ou privés.
towards Industrialized Countries
Ping Hua
To cite this version:
Ping Hua. Real Exchange Rates and China’s Bilateral Exports towards Industrialized Countries. 2011. �halshs-00557220�
Document de travail de la série Etudes et Documents
Ec 2006.29
Real Exchange Rates and China’s Bilateral Exports towards Industrialized Countries
Ping HUA*
CERDI, CNRS, Université d’Auvergne 65, Boulevard François Mitterrand
63000 Clermont-Ferrand, France Tel : 04 73 17 74 05 Fax : 04 73 17 74 28 Email: P.Hua@u-clermont1.fr. *
The author is grateful to Agnès Bénassy-Quéré and Colette Herzog for Chelem database of CEPII, Guillaume Gaulier for China’s export price indices, Sylviane Guillaumont Jeanneney and two anonymous referees for their comments and suggestions.
Abstract
A bilateral export demand function is developed to study the effects on the Chinese bilateral exports of three real exchange rates, corresponding respectively to the price-competitiveness of Chinese products on the market of the considered import country (traditional effect), on China’s other export markets (pricing-to-market effect), and to the price-competitiveness of Chinese competitors on the market of the considered import country (third-export-country effect). This function is then applied for Chinese real bilateral exports towards eleven industrialized countries over the period from 1991 to 2004. The econometric results confirm the effects of the three real exchange rates on the Chinese bilateral exports.
Résumé
Une fonction de demande des exportations bilatérales est développée pour analyser les effets sur les exportations bilatérales chinoises des trois taux de change réels, correspondant respectivement à la compétitivité-prix des produits chinois sur le marché d’un pays importateur considéré (effet traditionnel), sur les autres marchés d’exportations chinoises (effet de la fixation des prix en fonction des marches) et aux compétitivité-prix de ses pays concurrents sur le même marché du pays importateur considéré (effet des autres exportateurs concurrents). Cette fonction est appliquée aux exportations bilatérales chinoises envers les onze pays industrialisés pour la période de 1991 à 2004. Les résultats économétriques confirment les effets des trois taux de change sur les exportations bilatérales chinoises.
Keywords: bilateral exports, China, real exchange rates
1. Introduction
Currently, there are two debates on exchange rates, one concerning the parity between the American dollar and the renminbi1, the other on the parity between the American dollar and the Euro.
On the one hand, during last two decades, China has quickly increased its exports towards industrialized countries. In fact, the annual average growth of the Chinese exports towards the eleven most important industrialized countries,2 expressed in current dollars, is 20%3 for the period from 1985 to 2004, compared to 18% for total exports during the same period.The part of the Chinese exports towards these countries thus passed from 50% in 1985 to 67% in 2004. The geographical distribution of these exports has itself changed considerably. Although the United-States and Japan remain the two most important markets for Chinese products, Chinese exports towards the United-States increased much more quickly than those towards Japan (with annual average growth of 22% and 16 % respectively), so that the respective shares of these two countries have been reversed. The share of Chinese exports towards the United-States relative to its total exports towards the eleven industrialized countries increased from 29 % in 1985 to 43 % in 2004, while that towards Japan decreased from 50 % to 21 % during the same period.
Facing to these increasing exports, the industrialized countries, in particular the United-States exert a strong pressure in favor of the re-evaluation of the renminbi and the flexibility of China’s exchange rate regime (Goldstein M., Lardy N., 2003a, 2003b; U.S.-China Economic and Security Review Commission, 2003, Hufbauer et al., 2006). In fact, the stability parity between the renminbi and the American dollar (around 8.27 yuans/dollar since 1998 after a light appreciation of 4% following to the unification of exchange rates in 1994) is considered as a price advantage for the Chinese products on the American market. China is accused to export its deflation towards the industrialized world (Hu, 2003). Several American politicians and entrepreneurs think that this parity stability is responsible of the increasing American trade deficit towards China (which is estimated to 43 billion US dollars in 2002) and of the unemployment (which is estimated to 2.7 millions for the period from 2001 to 2003) in the manufactured sector.
1 The Chinese currency is the renminbi and its unity is the yuan.
2 The United-States, Japan, Germany, France, Canada, the United-Kingdom, Italy, the Netherlands, Australia, Spain, Belgium.
3
According to CHELEM data, i.e. Harmonized Accounts on Trade and World Economy developed by CEPII. For more details, see http://www.cepii.fr/anglaisgraph/bdd/chelem.htm. See 2.1. section for the discussion on the choice of Chelem data.
On the other hand, we know well the strong instabilities of bilateral exchange rates between industrialized countries, in particular the strong appreciation of the American dollar during the early eighties and the later nineties. The appreciation of real effective exchange rate of the dollar in terms of the currencies of the other ten industrialized countries is 37% over the period from 1980 to 1985, followed by a real depreciation of 46% from 1985 to 1995 and finally by a real appreciation of 45% from 1995 to 2002. Since then, the Euro appreciates against the dollar. The parity between the American dollar and the Euro passed from 1.12 Euros/dollar in 2001 to 0.80 in 2005. This depreciation of the American dollar relative to the Euro is furthermore a current discussion between the United-States and the countries of the Euro zone. As the renminbi was pegged on the American dollar4, the fluctuation of bilateral exchange rates between the United-States and the other industrialized countries leads mechanically the fluctuation of the renminbi vis-à-vis the currencies of these other countries.
Finally, since the middle of 1980s, because of the appreciation of their currencies, the Asian countries5 lost their price competitiveness on the markets of the eleven industrialized countries. Their export shares towards these countries relative to the total exports decreased from 65 % in 1985 to 50 % in 1997. Most of these Asian countries have strongly devalued their currencies following to the Asian Financial crisis. In 1998, the nominal devaluations of the currencies of these countries relative to the American dollar were 224 % for Indonesia, 47 % for the South Korea, 39 % for Malaysia and the Philippines, and 32 % for Thailand. However, the currencies of these countries appreciated again since 2001 and their export share towards the industrialized countries in the total exports decreased furthermore to 44% in 2004.
The size of the variation in the real value of these currencies can be inferred from the evolution of real exchange rates which are generally considered as price-competitiveness indicators. The objective of this paper is to understand the role of real exchange rates in the important change of the Chinese bilateral exports towards the eleven industrialized countries. We develop an export demand function to explain these bilateral exports, in which the economic activities of the considered import industrialized country are employed as explanatory variable, as well as three variables of relative prices between countries, or real exchange rates, corresponding to three different kinds of competitiveness. 1) The price competitiveness between domestic products of the import industrialized country considered
4
and Chinese products, measured by the real bilateral exchange rate of this same country against China (traditional price effect). A real depreciation of the renminbi improves Chinese competitiveness and allows to win its market share in this import country. 2) The relative price between domestic products of the ten other industrialized countries and Chinese products, measured by the real effective exchange rate of these other import countries against China (third-import-country effect). It captures pricing-to-market behavior of the Chinese exporters. 3) The price competitiveness of other developing countries exporting towards the same importing industrialized country, measured by the real effective exchange rate of this import country in terms of these developing countries (third-export-country effect). A price competitiveness deterioration of these developing countries allows China to win its market share on the considered import country. Finally, in order to capture the implemented structural reforms of China, a time trend variable is added into the function6.
From a methodological point of view, this paper has a double originality. Most works on China have studied the total of Chinese exports without taking into account their geographical destination (Cerro and Dayal-Gulati, 1999; Dées, 2002; Guillaumont and Hua, 1995; Hua, 1996; Song, 2000). Other studies relative to industrialized countries, in particular to the United-States and Japan, have explained the geographical destination of their trade, but few of them have taken into account the different kinds of competitiveness, which are just recalled (Cushman, 1987 and 1990; Haynes, 1996; Sukar and Zoubi, 1996; Summary, 1989). One exception is however that of Bayoumi (1999) relative to bilateral trade between industrialized countries.
This article is organized as follows. The second section presents the evolution of the geographical distribution of Chinese bilateral exports on the markets of industrialized countries and compare them to those of other Asian countries, to show the price-competitiveness that Chinese exports meet on the market of industrialized countries. The third section presents the evolution of three real exchange rates. The forth section presents an export demand function which analyzes the effect of three real exchange rates on the geographical distribution of Chinese exports; and its estimation for the period from 1991 to 20047 is presented in the last section. The econometric results show that Chinese bilateral
5 Asian countries studied in this paper are four newly industrialized countries (Hong Kong, Korea, Singapore, Taiwan) and four ASEAN countries (Indonesia, Malaysia, Philippines and Thailand). See 2.3. section for the discussion on the choice of these countries.
6
I think to one anonymous referee to suggest the introduction of this time trend variable. 7
Following to the comments of one anonymous referee, the estimation period has been shorten to the 1991-2004 period, relative to the first version of this paper for two raisons. 1). CEPII calculates China’s export price index
exports are positively influenced by a real depreciation of the Renminbi in terms of the currency of the considered import country, a real appreciation of the Renminbi against the currencies of other industrialized import countries and a real appreciation of the currencies of Asian countries competing with China.
2. Evolution of Chinese exports towards industrialized countries and comparison with those of other Asian countries
2.1. Choice of Chelem database
China’s bilateral export data towards its principal industrialized partners are the subject of regular discussion, particularly for the case between China and the United-States (Arora et al., 1995; Feenstra et al., 1998; Fung et al., 2001; Schindler et al., 2005).
The discrepancy between the statistical sources reported by export countries and import ones comes from firstly regulation, which consists that imports are measured in c.i.f. while exports in f.o.b. (free on board). This regulation introduces automatically a gap between the statistics published by export country and imports by import country, which is not specific to Chinese exports towards industrialized countries. The second and principal source of discrepancy comes from the re-exports of Chinese products via Hong Kong (Schindler et al., 2005). These re-exports towards the United-States represent more than the half of its exports. China and its trade partners measure differently these re-exports. The import countries consider all Chinese products via Hong Kong as their imports from China, while China includes them in its exports only since the beginning of 1990s when international harmonized system is adopted. The third source of discrepancy comes from the fact that Hong Kong adds markups on the Chinese products it re-exports. This leads a gap between the values of the Chinese products exported by China and those of products imported by the country of final destination. Moreover, the estimation of these markups by Hong Kong is often approximate.
CHELEM database corrects the effect of Chinese re-exports via Hong Kong by using the statistics recorded by China’s trade partners and those provided by the Hong Kong Administration (Dramé, 1994). They also correct the errors and incoherence of official statistics collected by international organizations. Finally, they published the data for Taiwan, while international organizations do not. In order to use harmonized data for the whole period, we use here CHELEM statistics, not those published by China, its import countries and its competitors.
only since the beginning of 1990s (Gaulier et al., 2006). 2). China’s foreign trade regime is much more liberalized and the Chinese economy reacts more to price signs (Guillaumont Jeanneney and Hua, 2002).
2.2. Evolution of Chinese exports towards eleven industrialized countries
The Chinese exports (in current prices) towards eleven industrialized countries increased from 12 billion US dollars in 1985 to 427 billion dollars in 2004 (figure 1), i.e. an average annual growth rate of 20 %, relative to 18% for total exports during the same period. Their share in China’s total exports increased from 50 % in 1985 to 72 % in 1999, and then decreased to 67 % in 2004. The Chinese exports towards the eleven developed countries increased much more quickly (with annual average growth rate of 25 %) over the period from 1985 to 1994 when the renminbi depreciated strongly, than that for the period from 1994 to 2004 (15.6 %) when the renminbi appreciated8.
Table 1 shows the change in the geographical distribution of China’s exports for each market of the eleven industrialized countries. The United-States and Japan are by far the biggest trade partners of China, totaling more than 64% of China’s exports towards the eleven industrialized countries during the period studied, while the total of the other industrialized countries is hardly more than the imports of these two partners.
In 1985, Japan was the major market of China (50%). But since 1989, the United-States has become the leading market of China to the detriment of Japan. In 2004, Chinese exports towards the United-States represented 43% of China’s total exports towards the eleven industrialized countries while they totaled only 29% in 1985. Japan has become the second importer for China, totaling 21% in 2004, while it imported 50% in 1985. Germany is the third market for Chinese goods, but on a much smaller scale. It imported 5% in 1985 and 8% in 2004 of Chinese goods sold on the eleven industrialized markets. Among the other countries, the share of Chinese exports towards these countries increased, except for Italy.
(Table 1 here)
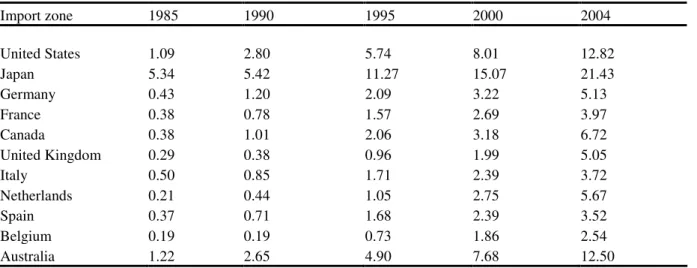
Table 2 presents the change in the proportion of Chinese products exported towards each industrialized country in the total imports of this same country. The market shares of Chinese goods in the total imports of each industrialized country increased from 1985 to 2004. China’s market share in total Japanese imports is the largest for the whole period, increasing from 5.3% in 1985 to 21.4% in 2004. It increased from 1.1% to 12.8% on the United States market and from 1.2% to 12.5 % on the Australian market. The market shares of the Chinese goods are more than 5% on the markets of Canada (6.7%), the Netherlands (5.7%), Germany (5.1%) and the United Kingdom (5.1%) in 2004, while these were very
weak in 1985. On the other industrialized markets, they did not exceed 0.6% in 1985 and 4% in 2004.
The above statistical analyses show that the Chinese exports towards the eleven industrialized countries increase very quickly, and furthermore their geographical distribution changed considerably. China wins the market share in all industrialized countries since the 1980s. Even though the Chinese products occupy an increasing position on the market of industrialized countries, it is still difficult to conclude that the weak prices of Chinese export goods are a major cause of deflation in these import countries, an argument forwarded by the United-States and Japan in favor of a re-evaluation of the Chinese currency.
(Table 2 here)
2.3.Competitiveness of Chinese exports towards industrialized countries with those of other Asian countries
We explain here why four newly industrialized economies (NIEs) (Hong Kong, Korea, Singapore and Taiwan) and four ASEAN countries (Indonesia, Malaysia, Philippines and Thailand) are considered as potential competitors of Chinese exports on the markets of the eleven industrialized countries. In fact, China and these Asian countries export their goods to the same destination and, moreover, they export the same kinds of goods, even though the Chinese re-exports using the intermediate inputs imported from other Asian countries are high. Gaulier et al. (2006) also show the dependence of China and other Asian countries on the market of developed countries for final goods exports.
Firstly, as for China, the eleven industrialized countries are the most important markets for the goods of the eight Asian countries, which represented more than 35% of their total exports in 2004 (table 3). The United-States and Japan are also the two major markets for all Asian countries, which total between 18% of their exports for Singapore and 37% for Thailand. The United Kingdom is the second market for Hong Kong. The Germany is the third or fourth market for all exporting countries. France is at best the sixth market for these countries.
China wins the market share of eleven industrialized countries in disfavor of its Asian competitors. The export share towards these countries relative to the total exports increased from 50% in 1985 to 67% in 2004 in the case of China, while it decreased for its competitors, from 70% to 45% for Hong Kong, from 70% to 40% for Taiwan, from 65% to 40% for South Korea, from 42% to 35% for Singapore, from 77% to 53% for Philippines, and from 77% to 53% for Indonesia. Only that of Thailand increased from 55% to 59%.
(table 3 here)
Figure 2 shows the evolution of the share of Chinese exports on the markets of the eleven industrialized countries as a whole relative to those of the four NIEs and 4-ASEAN countries. It seems that there is an inverse relation between the share of Chinese exports towards industrialized countries and those of the NIEs and 4-ASEAN countries. China’s share increased from 50% in 1985 to 62% in 2004, while this fell from 64% to 39% for the NIEs and from 67% to 52% for 4-ASEAN countries respectively.
This inverse evolution is not surprising. In fact, during this period, attracted by China’s low labor costs, NIEs delocalized their intensive unskilled-labor production in China to develop processing activities. It is thus normal that the export share of these economies towards the eleven industrialized countries decreased in favor of those from China. The re-exports of China account for more than 50% since the middle of 1990s. This is the redistribution consequence inside Asian exports on the industrialized markets in favor of China.
We observe furthermore from figure 2 that the export shares of China and eight Asian countries towards the eleven industrialized countries relative to their total exports tend to decrease since 2000. This decrease trend may mark the beginning of a new redistribution inside Asian exports in favor of other new emerging Asian countries as Vietnam and India etc.9
Thus, it is difficult to conclude that the strong growth of Chinese exports is a major source of employment destruction in the manufacturing sector of industrialized countries. This change in the share of exports does not exert negative effects on NIE economies, which export intermediary goods towards China for processing activities. On the contrary, the increase in Chinese export processing activities stimulates the economic growth of these countries. In this sense, China is becoming a motor for economic growth in this Asian zone.
From the figure 2, we observe that the competition between Chinese goods and those of the 4 NIEs is stronger than between Chinese goods and those of the 4 ASEAN countries. As a result, we expect the estimated coefficient of real effective exchange rate of Asian countries to be higher for the 4-NIEs than for the 4-ASEAN countries.
(Figure 2 here)
Secondly, eight Asian economies have also comparative advantages as China in producing textiles (17), wearing apparel and fur (18), leather products and footwear (19),
9 This is not the objective of this paper.
office and computing machinery (30), electronic machinery and apparatus (31) and ratio, TV and communication (32)10. They have thus a tendency to export the same kinds of goods as China. A detailed analysis of trade flows during the period 1993-2003 in Gaulier et al. (2006) shows also that the exports of China and its Asian neighbors depends on developed markets.
The comparative advantages of production cost inside one country are approximately measured by the export share of these products relative to total exports of the country. As shown in the first part of Table 4 relative to 2004, the six categories of products are very important in total exports of each country, although they represent no more than 22% of world exports. The export part of these products represents 56% of total in China. This figure is even higher for Singapore, Malaysia and Philippines in their exports, with percentages of 61.5%, 59.1% and 76.3% respectively. These products also represent a considerable share of the exports of Hong Kong, Taiwan, Thailand, Korea and Indonesia in their exports, with percentages of 56.4%, 47.8%, 44.8%, 42.1%, 34.4% and 26.4% respectively.
The table 4 present also two competitiveness indicators of these products: export-share revealed comparative advantage indices, developed by Balassa (1965) and world share of each country in world exports.
The export-share revealed comparative advantage indices of country j in the trade of product i (RCAij) is measured by the item’s share in the country j’s exports relative to its
share in world exports as following: RCAij = (Xij/Xj)/(Xiw/Xw). Xij and Xiw are the exports of
product i respectively for country j and the world. Xj and Xw are respectively total exports of
country j and the world. This index reveals thus exports in which the countries have comparative advantages. If it takes a value of less than 1 (which indicates that the share of product i in country j’s exports is less than the corresponding world share), this implies that the country has a revealed comparative disadvantage in the product. Similarly, a RCA index greater than 1 implies that the country has a revealed comparative advantage in the product.
The indices of RCA for six categories of products are calculated by country and by product for 1990 and 200411 (Table 4). China and other eight Asian economies have RCA indices bigger than one significantly in 2004, which increased from 1.18 for Indonesia and 3.40 for Philippines (see table 4). Thus, these economies have comparative advantages in these products relative to the rest of the world.
10
According to the classification of International Standard Industrial Classification (ISIC), Chelem database. 11
We have calculated these RCA for more detailed categories of products (at four-digit levels), and the results are similar.
China had comparative advantages in unskilled-labor intensive products, but comparative disadvantages in skilled-labor intensive products in 1990, except for radio, TV and communications. The RCA indices are 4.27, 5.81 and 5.29 respectively for textiles, wearing apparel and fur, and leather products and footwear. They are 0.20 and 0.85 respectively for office and computing machinery, and electronic machines. In 2004 China not only kept RCA indices higher in the unskilled-labor intensive products, as Hong Kong, Indonesia and Thailand, but also gained RCA indices in skilled-labor intensive products such as office and computing machinery (3.26), electronic and apparatus (1.87) and radio, TV and communication (1.77), as Taiwan, Thailand and Philippines. Finally, Korea, Singapore and Malaysia have also higher comparative advantages in office and computing machinery and radio, TV and communication. Consequently, China faces competition from all these countries.
Finally, China and the other Asian economies have price-competitiveness of these products in the world. This competitiveness is measured by the market share of each country in the total exports of the world. Although the total exports of these countries share only 17 % of total world exports, their exports of textiles, wearing apparel, office machines, electrical machinery and telecommunications represent 30%, 36%, 40%, 50%, 23% and 44% of world exports respectively (see the third part of table 4), which are very significant in world market. Consequently, these countries are the main producers of these six categories of products in world exports. In particular, China wins the market shares much more quickly since the last fifteen years than its Asian competitors.
(table 4 here)
Three conclusions can be drawn from these statistical analyses. The diversity of Chinese exports towards each industrialized country justifies our explaining the evolution of Chinese bilateral exports by the real exchange rate of China against the import country and other industrialized countries, potential importers of Chinese goods. The existence of competition between China and its Asian competitors fully justifies our taking into account the real exchange rate of China against these Asian countries in order to explain the evolution of Chinese bilateral exports. Finally, despite the fact that the market share of total Chinese exports in the total imports of each industrialized country is low, it is relatively high in several categories of goods where China and its Asian competitors are the major world producers.
3. Evolution of three real exchange rates influencing Chinese exports competitiveness
The strong fluctuation of exchange rates between the different countries throughout the world results from their exchange rate policies. After explaining China’s exchange rate policies, we present the evolution of three real exchange rates which are used in section 5 to estimate their effects on geographical repartition of the Chinese exports.
3.1. China’s exchange rate policies
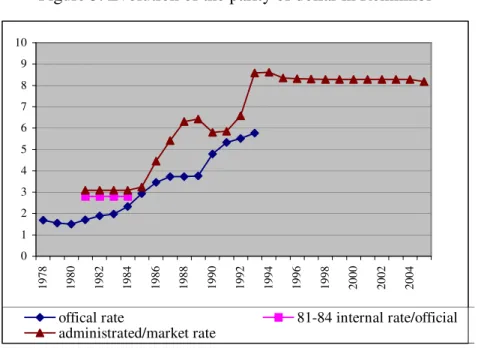
China’s exchange rate policy is marked by two different periods. During the period from 1981 to 1993, China practiced an active devaluation policy to promote exports, in particular manufactured goods (Guillaumont and Hua, 1996; Hua, 1996) by successively introducing an internal rate (1981-1984), an administered rate (1985-1986) and a swap market rate (1987-1993) higher than the official rate (figure 3). Export companies should sell part of their obtained foreign exchange at the official rate, and could use the rest of their foreign exchange to import for themselves, or sell them to other companies at a higher rate. These two exchange rates were modified several times until 1993 and led a strong depreciation of the Chinese currency during this period.
The second period is marked by the unified market exchange rate at the beginning of 1994. The parity of US dollar against the renminbi appreciated lightly of 4% from 1994 to 1998, and then remained stable. Under the strong pressure of industrialized countries, in particular the United-States and Japan, the renminbi was appreciated by 2.1% against the US dollar on July 21, 2005, and moreover, the peg of the renminbi changed from the US dollar to a basket of major currencies.
(Figure 3 here)
3.2. Evolution of three real exchange rates
Table 5 shows the evolution of three real exchange rates used in the estimation12. Real bilateral exchange rates of the considered import country (i.e. one of the eleven industrialized countries) vis-à-vis China are reported in the fist part of table 1. The exchange rate policy in China led strong real depreciations of the renminbi against all the currencies of the eleven industrialized countries during the period from 1991 to 1993, and followed by a real appreciation until 1997. The evolution of real bilateral exchange rates differs according to countries for the rest of studied period.
The real depreciations of the renminbi were quite important, passed from 50% against the Japanese yen to 24% against the Italian lira during the period from 1991 to 1993. They were then followed by a strong appreciation during the period from 1993 to 1998, from 52% against the Japanese yen to 22% against the living sterling. During the period from 1998 to 2004, the renminbi depreciated against all the currencies from 32% for the Netherlands to 9% for Japan, except for the Italian lira. The renminbi appreciated against the Lira of 8% during the same period, which explains why the share of the Chinese exports towards Italy decreased, while they increased for the other countries (Table 1). Consequently, the renminbi stability policy practiced even after the 1997 Asian financial crisis did not noticeably decrease the price-competitiveness of Chinese products on the market of the industrialized countries13, the main importers for China and other Asian countries.
The second part of table 5 shows the evolution of real effective exchange rate of the considered import country (one of the eleven industrialized countries) against the currencies of eight Asian countries. This price-competitiveness indicator captures the third-export-country competition effect on the Chinese bilateral exports.
Contrary to the strong depreciation of the renminbi over the 1991-1993 period, these currencies appreciated on average against the currency of the considered country (from 2% against the American dollar to 26% against the lira), except against the Japanese yen and the Dutch mark (deprecation of 13% and 1% respectively). All these currencies depreciated strongly following the 1997 financial crisis, from 50 % on average against the living sterling to 12% against the Canadian dollar on average for the period from 1993 to 1998, while the renminbi appreciated. The evolution of real exchange rate of the considered import country in terms of China’s competitors is quite different for the period from 1998 to 2004, from a real depreciation of 37% against the Italian lira, to a real appreciation of 38 % against the currency of the Netherlands14.
The third part of table 5 shows the evolution of real effective exchange rate of the other ten import countries (except for the considered import country) in terms of the renminbi. This indicator captures the pricing-to-market behavior of the Chinese exporters on the market of the other import countries face to the fluctuation of exchange rates. The renminbi
13
The depreciation of the currencies of Asian countries increases furthermore the competitiveness of the Chinese re-exports including a high share imported intermediate inputs from these countries. I think to one anonymous referee to precise this point.
14
As Dées (2002) observed, these depreciations improve in fact the price-competitiveness of the Chinese re-exports because they use a high share of imported inputs from the Asian countries. It should be very interesting to estimate the export demand equation by distinguishing the Chinese ordinary goods from processed and assembled goods as did in Dées (2002). Unfortunately these data are not available at bilateral level.
depreciated of 44 % for the period from 1991 to 1993, followed by an appreciation from 38% to 45% in real terms from 1993 to 1998. Then, the renminbi depreciated again from 1998 to 2004.
Figure 4 compares the evolution of the three real exchange rates influencing Chinese export competitiveness, taking the United-States as the considered import country. During the period from 1991 to 1996 when the currencies of Asian countries appreciated slightly against the American dollar, the renminbi depreciated firstly more quickly against the American dollar than against the currencies of the other ten industrialized countries, and then appreciated less importantly. Since the 1997 Asian financial crisis, the currencies of the eight Asian countries depreciated against the American dollar, while the renminbi depreciated only slightly against the dollar and appreciated against the currencies of the other ten import countries.
4. Bilateral export demand function of the effects of real exchange rates on the geographical distribution of Chinese exports
We suppose that China, as well as its Asian competitors, has some market power and can decrease the prices to win its market shares. In fact, for several goods, China is the major world producer. This is more important if China and its eight Asian competitors are considered together. We have observed that for textiles, wearing apparel, leather products, footwear, office, computing machinery, electronic machinery, radio, TV and communications, the market shares of China and its Asian competitors in world exports range from 24% in 1990 to 50% in 2004. For China alone, they range from 13% to 34% (cf. table 4). Moreover, most exports in China and in its competitors are realized by multinational companies, which certainly have some market power to fix the prices of their exported goods according to destination faced with the fluctuation of exchange rates (pricing-to-market according to Krugman, 1987). In the case of China, the share of exports realized by foreign-funded enterprises represents more than 50% since the middle of 1990s. Consequently, we can suppose that China and its Asian competitors are confronted by a demand for their goods, which is not infinitely elastic. In these conditions, a real depreciation of the currencies of these countries can give their exporters the opportunity to decrease their prices in import countries and thus to win market parts.
A traditional way to estimate the sensitiveness of multilateral exports to real effective exchange rate is to use an export demand function which depends the world demand and the relative price between Chinese exports and the goods of its trade partners. This relative price,
measured by real effective exchange rate of the renminbi, is thus used as a traditional indicator of price-competitiveness of Chinese multilateral exports (Guillaumont Jeanneney and Hua, 1996; Hua, 1996; Dées, 2002).
When this function is applied into bilateral data, the export volume of China X on the market of the considered import country M (labeled XXM) depends on the demand for the
Chinese goods in the market of the import country M, often measured by real GDP (labeled YM), and the relative price between home goods in the considered import country and the
Chinese exported goods (labeled M X M E
E ), with both prices expressed in a common currency such as: ) , ( M X M M XM D Y E E X = (1)
Where XXM : Chinese real bilateral exports towards the considered import country;
YM : real GDP of the import country M; M
X M E
E : relative price between home goods of the considered import country and
China’s goods, expressed in a common currency.
However, the consumers of import country M can choose between three types of goods: domestic goods, Chinese goods and the goods from other exporters OX which are considered as China’s competitors. The exports of Chinese goods can be diminished if the other countries exporting on the same market of China meet real depreciations of their currencies which are more important than those of the renminbi, and inversely. In order to capture this “third-export-country” effect on the Chinese bilateral exports towards the market of the import country M, the relative price between the domestic goods of the import country and the goods of these other export countries (labeled M
OX M E
E , with both prices expressed in
a common currency) should be taken into account. The export demand function can be rewritten as following: ) , , ( M OX M M X M M XM D Y E E E E X = (2) Where M OX M E
E : relative price between the home goods of the considered import country and the goods of China’s competitors, expressed in a common currency.
M OX
E : import-weighted price charged in market of the import country M by China’s competitors.
Using lower case letters to represent logarithms, the equation (2) can be written as follows: ) ( ) 3 ( 2 1 0 m m mx m oxm m x xm e a ay a e e a e e xn − = + + − + − (3)
Where xnxm : nominal bilateral exports from China to the considered import country; m
x
e : China’s bilateral export price;
a1: demand elasticity with a1>0;
a2: price elasticity with a2>0;
a3: price elasticity with a3<0;
However, this export demand function can not be estimated, because bilateral export prices are not available. The use of multilateral export prices to calculate real bilateral exports leads estimation bias, as the Chinese exporters may charge different prices across markets so that the prices charged for exports from China differ across import countries (“pricing-to-market” effects).15 Consequently, bilateral export volume should be calculated by using bilateral export prices16.
We follow the hypothesis of Bayoumi (1999) to suppose that the Chinese export prices charged in each industrialized market correspond to the domestic prices of tradable goods in this market. More precisely, the countries in which domestic prices of traded goods are high are the ones in which prices of the exported goods from China are high. Consequently, we can assume that the difference between the Chinese bilateral export prices towards the considered import country ( M
X
E ) and the Chinese multilateral export prices towards all import countries
(EX) depend on the difference between multilateral prices of goods in the considered import country (EM) and the Chinese exports-weighted average of multilateral prices in all other
import countries (except for the considered import country) ( EOM) such as: ) ( M OM X M X E E E E =
δ
(4)The weights are calculated as the shares of China’s exports towards one of the ten industrialized countries relative to its total exports towards the ten countries.
Using lower case letters to represent logarithms, the equation (4) can be written as follows: ) ( m om x m x e e e e − =
δ
− (5)Substituting equation (5) into equation (3) and eliminating the term “ m x
e ”, we obtain the following equation:
) ( ) )( 1 ( ) ))( 1 ( ( 2 2 2 3 1 0 m m x om x m oxm x xm e a ay a a e e a e e a e e xn − = + + +
δ
− − −δ
− − + − (6)15 See Krugman (1987) for a theoretical discussion and Knetter (1989, 1993) and Gagnon and Knetter (1995) for empirical evidence.
16
These “pricing-to-market” effects are incorporated into the weights used in the real effective exchange rate calculation when multilateral exports are used in the estimation (Bayoumi, 1999).
Thus, a new term “eom− ” capturing “pricing-to-market” behavior is added into ex equation (3). This equation 6 is therefore estimable; and furthermore, the elasticity of real bilateral exchange rate are correct even though multilateral export prices are used to calculate the volume of bilateral exports. As the coefficient of this new term is one part of the coefficient of real bilateral exchange rate, we expect that the coefficient of this real bilateral exchange rate of the considered import country is not less than that of real effective exchange rate of other import countries.
Consequently, Chinese real bilateral exports towards the import country M are determined by the real bilateral exchange rate of the import country M vis-à-vis China X (price-competitiveness of Chinese goods on the considered Chinese export market), the real effective exchange rate of other import countries OM against China (price-to-market effects), the real effective exchange rate of the import country vis-à-vis the Chinese competitors OX (price-competitiveness of other export countries’ goods on the same Chinese export market M) and the economic activity of the import country.
One potential problem of this export demand equation is the multicolinearity of the three exchange rates. One easy solution is to use real effective exchange rate of the renminbi instead of the above three exchange rates, as in multilateral data. However, this does not correspond to the objective of this paper which just tries to separate three kinds of price effects. We can see from the equation 6, by controlling for import-country” and “third-export-country” effects, the real bilateral exchange rate of the considered import country vis-à-vis China captures only the traditional impact of the real depreciation of the Renminbi on the Chinese export demand towards the import country (i.e. traditional price effect), that do not pass through third country effects, but only pass through the modification of relative price between China and the considered import country.
5. Econometric estimations
For econometric estimation on panel data, the above export demand equation (6) can be rewritten as following: t m m t m t ox t m t x t om t x t m t m t xm a ay a a e e a e e a e e aT x ,= 0+ 1 ,+( 2+
δ
(1− 2))( ,− ,)−δ
(1− 2)( ,− ,)+ 3( ,− ,)+ 4 +µ
+ε
, (7) Where T is the time trend;m
µ
denotes the unobservable country specific effects,t m,
The time trend is added into the equation in order to capture the effects of implanted structural reforms in China17. This function is estimated for Chinese bilateral total exports towards eleven industrialized countries (the United-States, Japan, Germany, France, Canada, the United-Kingdom, Italy, the Netherlands, Australia, Spain, Belgium) in constant prices (1995=100) for the period from 1991 to 200418 (panel data). All variables are calculated in real terms and in logarithms. Thus, the estimated coefficients can be interpreted as elasticities.
5.1. Definition and calculation of the variables
Chinese bilateral exports towards the eleven industrialized countries (XXM), which are
employed in the previous statistical analyses, are in nominal terms. We require exports in real terms for econometric analyses, in accordance with the theoretical model (equation 6). The volume of Chinese bilateral exports (which include all exported Chinese goods) is calculated as nominal total exports in yuans deflated by multilateral export unit value of China in yuans, “pricing-to-market” effects are captured using the average value of multilateral prices in the other ten export market (except for the considered import country) relative to China’s export prices, with weights calculated by the structure of Chinese bilateral exports towards these countries. The nominal bilateral export data come from Chelem database of CEPII and multilateral export unit value of China is calculated by unit values of products at the 6 digit level of HS classification using CEPII-BACI data base (1995=100)19.
The economic activity of the eleven industrialized countries (YM) are represented by
its real GDP in 1995 constant dollars. The data are taken from World Development Indicators, World Bank.
The relative price between home goods in the import country and the Chinese exported goods, expressed in the same currency, is measured by the real bilateral exchange rate of the considered import country M (one of the eleven industrialized countries) against China X (ERXM). It is calculated as the product of the ratio of consumer price indices in
import country M and in China (1995=100) and their nominal bilateral exchange rate20 such as: C X MX C M X M MX P E P E E ER = =
17 I think to an anonymous referee for this suggestion.
18 The estimation period is reduced to the recent period in this revised version following to the criticism on the very long period (since 1980) of an anonymous referee. We observe that the results are similar.
19
I thank to Guillaume Gaulier to provide China’s export prices indices. 20
It would have been better to build up this indicator based on bilateral export prices, but such series are not available.
where C M
P : consumer price of the considered import country;
C X
P : consumer price of China;
MX
E : nominal bilateral exchange rate of the import country in terms of China;
This is a price-competitiveness indicator. An increase of this real bilateral exchange rate means a real depreciation of the renminbi. It stimulates the Chinese exports towards one of the eleven industrialized countries and allows China to win the market share in the import country.
In the same way, the relative price between home goods in the import country and exported goods of China’s competitors, expressed in the common currency, is approximated by the real effective exchange rate of the considered import country M (one of the eleven industrialized countries) against China’s competitors. It is calculated as a geometric average of the ratio of consumer prices in the import country and in China’s competitors and the nominal bilateral exchange rates of the importer’s currency against China’s competitors such as : i n i C OX MOX C M OX M MOX i i P E P E E ER ( )α 1
∏
= = = with∑
= = n i i a 1 1. Where C OXiP is consumer price in China’s competitor i.
i MOX
E is nominal bilateral exchange rate of the import country in terms of China’s
competitor i.
i
α is the weights, calculated as export share of each competitor towards the considered import country (M) relative to the total exports of these other competitors (OX) towards the importer M. An increase of this indicator signifies a real depreciation of the currencies of China’s competitors. This “third-export-country” effect captures therefore price-competitiveness of the Chinese competitors’ goods on the market of the considered industrialized country (M); and thus stimulates the Chinese competitors’ exports towards this country (M) in disfavor of the Chinese goods.
This indicator is calculated for each industrialized country either against eight Asian countries (i=1…8), or four Asian news industrialized countries (i=1….4) or forth ASEAN countries (i=1…4).
The relative price between home goods of the other ten import countries and the Chinese exported goods, expressed in the same currency, is measured by the real effective exchange rate of the currencies of the other ten import industrialized countries OMj (j=1…10)
geometric average of the ratio of consumer prices in these other import countries and in China, converted into the common currency by using the bilateral nominal exchange rate of one of other ten importers’ currencies in terms of the renminbi such as:
j j j j C X X OM C OM X OM OMX P E P E E ER ( )β 10 1
∏
= = = with∑
= = 10 1 1 j j βWhere OMj means other ten importing industrialized countries (j=1…10) except for the
considered import country M.
β
jrepresents weights, calculated as the share of the Chinese export towards one of these other ten import countries relative to the total Chinese exports towards these ten countries. This indicator captures the behavior of Chinese exporters to charge different prices in different markets to absorb the effects of exchange rate fluctuations. The nominal bilateral exchange rate of one of the other importers’ currencies against the renminbi is the rapport between nominal exchange rate of the American dollar in terms of the renminbi and nominal exchange rate of the American dollar in terms of one of the other ten importers’ currency. The official exchange rates for all countries come from IMFInternational Financial Statistics as well as consumer price indices. As we explained in
section 2, China practiced two regimes of double exchange rates before 1994. Nominal exchange rate of the American dollar in terms of the Renminbi (n) is computed for the period from 1991 to 1993 as the weighted average of the two exchange rates, simultaneously used in China, with the retention rate of exports (a) as weights, such as n=(1-a)e0+a*em. where e0 :
official rate; em : swap rate. Export retention rates and swap rates are obtained from World
Bank (1994) and China Monthly Statistics (various issues).
As consumer prices are composed of the prices both of tradable goods and non tradable goods, the calculated exchange rates translate the different evolution of tradable goods in different countries (absence of the law of unique price), but also the different evolution of non tradable goods, in other words, production cost. The use of consumer price indices tends to therefore underestimate the level of Chinese competitiveness in the market of industrialized countries. Descriptive statistics for all variables in absolute values are presented in table 6.
5.2. Estimation method and econometric results
Before estimating the export demand equation, it is necessary to analyze the stationarity of the series. The results of Maddala and Wu panel unit root tests do not allow us to reject unit root null hypothesis for all variables of our estimation at the level of 10%: real
exports, real GDP of each industrialized country and three real exchange rates. They show that all these variables are integrated of order 1 (table 7). The results of Johansen co-integration test show the existence of co-integrating vector. The long-term relationships can be thus determined for these variables. Finally, the stationarity of the error term of three regressions is confirmed (see statistics reported in table 7).
The estimator of Generalized Moments Model21, proposed by Arellano and Bond (1991) and then further developed by Blundell and Bond (1998), is used to control for endogeneity of all the explanatory variables. For each regression, we test the specification with the Hansen test for instrument validity, and then with the serial correlation test of Arellano-Bond for the second order serial correlation. The results of these two tests reported in table 8 suggest that we can not reject the hypothesis that the instruments are valid, and there exists no evidence of second serial correlation in the regressions.
Empirical results based on GMM system estimation are reported in table 8. All
coefficients are significant with expected signs. First, the obtained econometric results show that the real GDP of the considered import country is statistically significant and with a positive sign. The GDP elasticity of demand is estimated to 1.08. An increase of 1% of real GDP in the import country leads a demand increase of 1.08% for Chinese products. It explains thus a quite good adoption of the Chinese exported goods relative to the demand in the market of developed countries.
Second, there is evidence that the variable of time trend is positively and significantly corrected with exports. The estimated value is 0.18 and highly significant. This means an increase in exports of 18% per annum. This indicates that, during the studied period, the accelerated economic reforms towards market-oriented market increase strongly China’s production supply capacity and in particular its productivity of exported goods relative to other domestic products.
Third, the three real exchange rates are statistically significant and with waited signs. An increase of real bilateral exchange rate of the considered import country M’s currency vis-à-vis the renminbi (a real depreciation of renminbi) of 1% increases the Chinese exports towards the import country M of 1.45% (column 1, table 8). The coefficient of “pricing-to-market” effect is also statistically significant. The exporters in China charged effectively different prices in different developed markets (Column 1). The elasticity on third-export- country competition effect is statistically significant. A real depreciation of 1% of the eight
21
. The literature on the GMM estimator is enormous and continually expanding (Green, 2000 ; and Wooldridge, 2002 etc.).
Asian countries’ currencies reduces Chinese exports towards the considered import country M by 0.42%. As expected, this priceelasticity is more important for the 4 NIEs (estimated to -0.52, column 2) than for the 4 ASEAN countries (-0.18, column 3).
These econometric results implied that the response of China’s bilateral real exports to real exchange rates depends not only China’s exchange rate policies, but also upon the behavior of the currencies of Chinese trade partners.
(Table 6 here)
To be able to compare the obtained results relative to those in Dées (2002), we should calculated the multilateral real exchange rate. As this last one is equal to the relative prices between the goods of China’s trade partners and the exported goods of China, the implied real exchange rate elasticity for multilateral real exports is equal to the sum of the coefficient of real bilateral exchange rate and the coefficient of the “third-export-country” effect such as: 1.03 (1.45-0.42)22.
This elasticity is sensibly higher than that obtained in Dées (2002) for 1994-2000 period (0.29). Dées explains the very weak elasticity firstly by his choice of Chinese export deflator (note 4, page 49). Instead of using Chinese export unit value, Dées used an export world price index. This supposes implicitly that China is a price-taker. However, as we showed in last section, China is more “price maker” in its major exported products. Second, the real exchange rate elasticity of this paper is estimated for China’s exports towards eleven industrialized countries, dominated by labor-intensive manufactured goods, while that obtained in Dées is for total exports.
Not only the estimated coefficients of real GDP and real exchange rates are statistically significant, the values of their price-elasticities show that the obtained results have economic significance. The real GDP of the eleven industrialized countries increased of 2.53% per annum on average during the studied period (table 6), which varied from 3.86% for Australia to 1.24% for Japan. This increase stimulated the demand for Chinese exports from 4.17 to 1.36 point percentages for an annual average export growth rate of 13%.
The real exchange rate of the import country in terms of China decreased (i.e. an appreciation of the Renminbi) at an annual average growth rate of 1.94% during the studied period (see table 9), which appreciated from 0.17% for the United-States to 3.78% for Italy, the Chinese export growth was decreased from 0.25 to 5.48 percentage points. As the real exchange rate of the considered import country in terms of China’s competitors increased (i.e.
a depreciation of the currencies of the competitors) at an annual average growth rate of 1.67%, the Chinese export growth was decreased of 0.80 percentage points on average. Consequently, the real appreciation of the renminbi and the real depreciation of the currencies of its competitors explain the slow drown of the Chinese export growth towards the eleven industrialized countries (an average growth rate of 13%) relative to 25% during the period from 1995 to 2004 when the renminbi depreciated strongly.
Finally, from table 9, we can see that the annual average contribution of the exchange rates to China’s bilateral export growth are more important (-3.57) 23 than that of real GDP (2.74) during the studied period. It is thus well the price competitiveness of China’s exports which allows China to win the market share, even though the contribution of demand is also very important.
These results have important political implications. As China is under strong pressure from industrialized countries in favor of re-evaluation, we consider a case in which the renminbi appreciates against the currencies of all industrialized countries. As the relative prices of its competitors do not change, a real appreciation of 1% of the renminbi should lead a decrease of 1.45% of China’s exports towards the import countries. This may favor the exports of China’s competitors towards industrialized countries. Now consider a case in which the renminbi and the currencies of China competitors appreciate equally against the currencies of all import countries. A real appreciation of 1% of the renminbi and the currencies of China’s competitors should lead a decrease of 1.03% (-1.45%+0.42%) of China’s exports. At the same time, the exports of China’s competitors towards the import countries decrease too.
5. Conclusion
There are several contributions in this paper. Despite the fact that a new body of literature has recently concentrated on bilateral trade, it is still limited to bilateral trade between industrialized countries, in particular between the United-States and its trade partners. Working on Chinese bilateral exports, this paper makes a contribution to this body of studies. Second, this paper was the first to estimate the effects of three real exchange rates on the bilateral exports of developing countries. The results of this paper show that Chinese
22
The “eom−ex” term represents a nominal effect (pricing-to-market), so, it is not included in the calculation of the elasticities for real exports (Bayoumi, 1999).
bilateral exports are influenced in a statistically significant way by three real exchange rates, as well as the economic activity of the import country.
If the real appreciation of the renminbi decreases effectively the volume of the Chinese exports towards the industrialized countries, this decrease may lead a redistribution of Asian exports in favor of the Chinese competitors, and thus not necessarily improve the trade deficit, nor resolve the unemployment in the manufactured sector where the industrialized countries have not any comparative advantage. Secondly, even that the market parts of the Chinese goods in industrialized countries are increasing, it is still too weak to conclude that China is exporting deflation in industrialized countries.
Due to Balassa-Samuelson effects, Chinese currency will certainly reevaluate in the future. The change of China’s exchange rate policies on July 21, 2005 marked the beginning of this reevaluation24. Because of the sensibilities of Chinese exports to real exchange rates, the Chinese government seems to adopt a gradual reevaluation policy and tries at the same time to upgrade its exports to absorb the negative choc of the reevaluation by diversifying Chinese exports from unskilled labor intensive goods (such clothing, textiles and footwear) to skilled labor intensive ones (electrical machinery, telecommunications and office machines). Chinese exporters seems also decrease export prices to keep their market share (pricing-to-market effects).
Finally, the maintain of a relative controlled exchange rate regime is to avoid strong exchange rate adjustments, as what happened in other emerging economies such as Asian economies before the 1997 financial crisis, CEECs (Poland, Republic of Czech or Hungary), or Latino American countries after the total liberalization of their capital movements. For the near coming years, it seems that an equilibrium should be established between China and the United-States in such way that the high level of Chinese foreign exchange reserves with its high accumulation in U.S. dollars finances the American double deficit.
24
In fact, the current debate on reforming Chinese exchange rate regime is on the level of the Renminbi under-devaluation, and thus on the rhythm of the reevaluation.
Bibliographical references
Arellano, M. and S. R. Bond (1991) “Some Tests of Specification for Panel Data: Monte Carlo Evidence and an Application to Employment Equations.” Review of
Economic Studies, 58: 277-297.
Arora V., Kochhar K, (1995), “Discrepancies in Bilateral Trade Statistics: the Case of China,” IMF Paper on Policy Analysis and Assessment, PPAA/95/10, June.
Bahmani-Oskooee M., Goswami G. G. (2003), “Exchange Rate Sensibility of Japan’s Bilateral Trade Flows,” Japan and the World Economy.
Balassa, B., 1965, Trade liberalization and revealed comparative advantage, The Manchester
School of Economic and Social Studies, 33, 99-124.
Bayoumi T. (1999), “Estimating Trade Equations from Aggregate Bilateral Data,” IMF
Working paper, WP/99/74, may, 27 pp.
Blundell, R. and S. Bond. (1998), “Initial Conditions and Moment Restrictions in Dynamic Panel Data Models.” Journal of Econometrics 87(1): 115-43.
Cerra V. and Dayal-Gulati (1999), “China’s trade flows: changing price sensibilities and the reform process,” IMF Working Paper, WP/99/1.
Cushman D. O. (1987), “US Bilateral Trade Balances and the Dollar,” Economic letters, 24, 363-367.
Cushman D. O. (1990), “US Bilateral Trade Questions: Forecasts and Structural Stability,”
Applied Economics, 22, 1093-1102.
Dées S. (2002), “Compétitivité-Prix et Hétérogénéité des Echanges Extérieurs Chinois,”
Economie internationale, 92, 4 trimestre, 41-66.
Dornbusch R. (1987), “Exchange Rates and Pricing,” American Economic Review, March, 77, 93-106.
Dramé M. (1994), “CHELEM-Commerce International, Note Méthodologique,” mimeo, CEPII, Paris.
Eaton J. (1994), “Bilateralism and Regionalism in Japanese and US trade and Direct Foreign Investment Patterns,” Journal of the Japanese and international Economics, 8, 478-510.
Feenstra R.C., Hai W., Woo W.T. and Yao S.L. (1998), “The US-China bilateral trade balance, Conference on China’s Integration into the Global Economy, January 17.
Fernald J., Edison H. et Loungani P. (1999), “Was China the First Domino? Assessing Links Between China and Other Asian Economies,” Journal of International Money and
Finance, 18, 515-535.
Fung, K. C. and Lau Lawrence J. (2001), “New Estimates of the United States-China Bilateral Trade Balances,” Journal of the Japanese and International Economics, Vol, 15, Issue 1, March, pages 102-130.
Gagnon, J. and Knetter M. (1996) “Trading Blocs in the Americas: the natural, the unnatural,, and the super-natural,” Journal of Development Economics,
Gaulier G., Lemoine F. and Ünal-Kesenci D. (2006), “China’s Emergence and the Reorganization of Trade Flows in Asia,” Working Paper, CEPII, 05.
Goldstein, M. and M. S. Khan (1985), “Income and Price elasticities in Trade,” in Ronald W. Jones and Peter B. Kenen (editors) Handbook of International Economics, Volume I (Amsterdan: North Holland).
Greene W. H. (2000), Econometric Analysis, 4th edition, Upper Saddle River, N.J. Prentice Hall.
Guillaumont Jeanneney S. et Hua P. (1996), "Politique de change et développement des exportations manufacturées en Chine", Revue économique, mai, 47, 3, 851-860. Guillaumont Jeanneney S. and Hua P. (2002), “The Balassa–Samuelson effect and inflation in
the Chinese provinces,”China Economic Review, 13, 134-160.
Hagemann E. (1988), “Statistics in China,” Ein Literaturbericht, Bericht des BIOST, 5, Köln, Haynes S. E. Hutchison M. M. and Mikesell R. F. (1996), “US-Japanese bilateral trade and
the yen-dollar exchange rate: an empirical analysis,” Southern Economic Journal, 52, 923-932.
Hu A.G. (2003) “Is China the Root Cause of Global Deflation ?” China & World Economy, number 3, 3-7.
Hua P. (1996), “Les déterminants du commerce extérieur de la Chine,” Revue d’Economie du
Développement, No, 1-2, 207-232.
Hufbauer G. C., Wong Y. and Sheth K. (2006), US-China Trade Disputes: Rising Tide,
Rising Stakes, Institute for International Economics, August, 122 pp..
Knette M. (1989) “Price Discrimination by US and German Automobile Exporters,”
American Economic Review, 79, 198-210.
Knetter Michael M. (1993), “International Comparisons of Pricing-to-Market Behavior,” The
Krugman Paul R. (1987), “Pricing to Market When the Exchange Rate Changes,” in S,W, Arndt and J,D, Richardson eds, Real Financial Linkages Among Open Economies, Cambridge, MA: MIT Press, pp 49-70.
Marquez J. (1990), “Bilateral trade Elasticities,” The Review of Economics and Statistics, February, 70-77.
Nadenichek J. (2000), “The Japan-US trade imbalance: a real business cycle perspective,”
Japon and the World Economy, 12, 255-271.
Schindler J.W; and Beckett D.H. (2005), “Adjusting Chinese Bilateral Trade Data: How Big is China’s Trade Surplus?”, International Journal of Applied Economics, 2(2), September, 27-55.
Summary R. M. (1989), A political-economic model of US bilateral trade, The Review of
Economics and Statistics, 71, 179-182.
Sukar A. and Zoubi T. (1996), Real exchange rates and US bilateral trade, Journal of applied
Business Research, 12, 138-144.
U.S.-China Economic and Security Review Commission (2003), China’s Industrial,
Investment and Exchange Rate Policies: Impact on the United States, September
25, http://www.uscc.gov.
Wooldridge Jeffrey M. (2002) Econometric Analysis of Cross Section and Panel Data, Cambridge, Mass. MIT Press.
Yue C. J. and Hua P. (2002), “Does Comparative Advantage Explains Export Patterns in China?” China Economic Review, 13, 276-296.
Table 1
Evolution of geographical distribution of Chinese exports towards the eleven industrialized countries (in percentage)
1985 1990 1995 2000 2004 United States 28.88 37.59 39.31 45.54 43.28 Japan 49.58 30.94 32.05 25.38 21.07 Germany 5.18 10.56 8.79 7.07 8.35 France 3.18 4.89 4.08 4.03 4.16 Canada 2.38 3.27 3.19 3.68 4.34 United-Kingdom 2.36 2.21 2.35 3.12 5.25 Italy 3.38 3.89 3.04 2.63 2.93 Netherlands 1.09 1.55 1.69 2.58 3.71 Spain 0.87 1.62 1.76 1.77 2.13 Belgium 0.80 0.63 1.05 1.53 1.69 Australia 2.30 2.85 2.70 2.67 3.09 Total 100 100 100 100 100