HAL Id: hal-01022068
https://hal.inria.fr/hal-01022068
Submitted on 10 Jul 2014HAL is a multi-disciplinary open access archive for the deposit and dissemination of sci-entific research documents, whether they are pub-lished or not. The documents may come from teaching and research institutions in France or abroad, or from public or private research centers.
L’archive ouverte pluridisciplinaire HAL, est destinée au dépôt et à la diffusion de documents scientifiques de niveau recherche, publiés ou non, émanant des établissements d’enseignement et de recherche français ou étrangers, des laboratoires publics ou privés.
Frequency and Damping Wandering in Existing
Buildings Using the Random Decrement Technique
Philippe Gueguen, Mickael Langlais, Philippe Roux, Jakub Schinkmann,
Isabelle Douste-Bacqué
To cite this version:
Philippe Gueguen, Mickael Langlais, Philippe Roux, Jakub Schinkmann, Isabelle Douste-Bacqué. Frequency and Damping Wandering in Existing Buildings Using the Random Decrement Technique. EWSHM - 7th European Workshop on Structural Health Monitoring, IFFSTTAR, Inria, Université de Nantes, Jul 2014, Nantes, France. �hal-01022068�
F
REQUENCY AND
D
AMPING
W
ANDERING IN
E
XISTING
B
UILDINGS
USING THE
R
ANDOM
D
ECREMENT
T
ECHNIQUE
Philippe Gueguen1, Mickael Langlais1, Philippe Roux1, Jakub Schinkmann1, Isabelle Douste-Bacqué1
1 ISTerre, Université de Grenoble-Alpes, CNRS/IRD/IFSTTAR, BP 53, 38041 Grenoble cedex 9 [email protected]
ABSTRACT
With the increasing use of permanent, continuous and real-time networks, ambient vibrations can provide a simple tool for the identification of dynamic building parameters. This study is focused on the long-term variation of frequency and damping in several buildings, using the Random Decrement Technique (RDT). RDT provides a fast, robust and accurate long-term analysis and improves the reliability of frequency and damping measurements for structural health monitoring. This reveals particularly useful information in finding out precisely how far changes in modal parameters can be related to changes in physical properties. This paper highlights the reversible changes of the structure’s dynamic parameters, correlated with external forces, such as temperature and exposure to the sun. Contrasting behaviours are observed, including correlation and anti-correlation with temperature variations.
KEYWORDS : Frequency, damping, temperature, buildings.
1 INTRODUCTION
Since the design forces in structures are frequency and damping dependent (based on the seismic coefficient C(T,ξ) where T is the period of the building and ξ is the damping ratio), these two parameters are the subject of special attention and focus of many research activities. Most losses produced by earthquakes throughout the world are due to deficient seismic behaviour in existing buildings in spite of improvements made to seismic codes [1]. A critical step in seismic risk assessment is therefore to be able to predict the expected damage for a given earthquake in existing structures. Spence et al. [1] asserted that the adjustment of structural models should assume a large set of unknown parameters influencing the response of existing buildings and introducing a large range of errors and epistemic uncertainties for the establishment of fragility curves, generally due to the lack of structural plans, aging and structural design. Knowing frequency and damping can then reduce the range of errors and epistemic uncertainties for representing the vulnerability as fragility curves [2].
New instrumentations and new signal processing methods provide information on ageing effects or after extreme events. The basic idea is that any modifications of the stiffness of a system alter its dynamic response [3] [4]. Variations in these modal parameters can result from a change in the boundary conditions (e.g. fixed- or flexible-base structure), mechanical properties (e.g. reinforcement or retrofitting) or the elastic properties of the material (e.g. Young’s modulus). The causes may also be related to non-linear responses of the buildings, transient variations having been observed during seismic excitation due to the non-linear response of the soil-structure boundary [5] [6] or to the closing/opening process of pre-existing cracks within the elements of the reinforced concrete buildings [7] [8]. Finally, these variations can also be long-term, reversible and slight, as recently observed by Clinton et al. [7] and Todorovska and Al Rjoub [9], often correlated to the temporal variations of the atmospheric conditions (temperature, humidity, etc.) Most previous studies conducted in civil engineering structures (e.g., [7][10][11][12]) have shown that temperature
The main purpose of this paper is to analyse the long-term variations of the frequency and damping of one building. After presenting the Random Decrement Technique (RDT) applied to the data in section 2, the experiment is applied to the data in section 3 and the variations in frequency and damping are discussed in section 4. Concluding remarks are presented in section 5.
2 THE RANDOM DECREMENT TECHNIQUE
An effective solution to track frequency and damping variations over time is to apply the random decrement technique, RDT. By stacking a large number of windows with identical initial conditions, ambient vibrations remain stationary and the impulse response of the structure is revealed. Vandiver et al. [13] and Asmussen et al. [14] provide details on the theory of RDT and its mathematical formulation that can be simplified by:
RDT (! ) = 1
N i=1s(ti+! ) N
!
(1)where N is the number of windows with fixed initial conditions, s is the ambient vibration window of duration τ, and ti is the time verifying the initial conditions. The choice of initial conditions is a
key point in ensuring the stability of the Random Decrement signature. The null displacement and positive velocity conditions proposed by Cole [15] and verified by Asmussen et al. [14] were used in the present work. The number of windows N is also critical to obtain a stable and relevant damping estimation. In our case, we optimised the parameters of the RDT by testing the τ and N values for providing the smallest dispersion. Before the RDT processing, a fourth-order band pass filter was applied to the raw data, centred on the expected fundamental frequency with a 10% frequency band. The RDT signature of the mode is exponentially damped and its period is computed by averaging the time laps between two upward zero crossing points.
Since the first real-scale structure instrumentations at the beginning of the 60’s throughout the world, the quality of the sensor and the accessibility of the data have increased a lot, providing a large number of real data for testing as those provided in real-time and continuous recording by permanent networks. With this new source of data, the RDT is certainly the most appropriate solution for monitoring the health of the structure, with a good cost/quality ratio. For example, Mikael et al. [16] tested the RDT in two buildings monitoring by the French Accelerometric Network and they concluded in the ability for the RDT to detect very small variations that finally could be related to the integrity of the structure.
3 DESCRIPTION OF THE EXPERIMENT
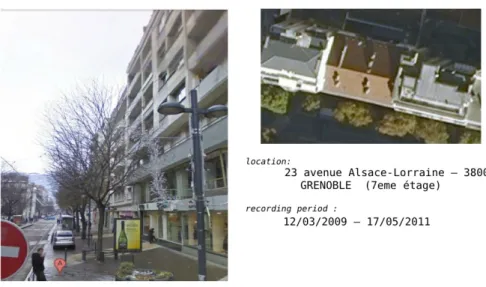
The building of the present study was constructed before 1970 in the Grenoble city (France), resting on a huge sedimentary basin made of soft sediments and providing strong seismic site effects. The number of storeys is 7. They are located at the corner of an urban block (Fig. 1). The building is designed in RC shear wall elements. The building is instrumented at the 7th floor with a low-sensitivity/high dynamics 24bit seismic station associated to a CMG5 (Güralp) 3 components accelerometer. The sensor was aligned with the main orientation of the building, along the longitudinal (L) and transverse (T) directions. This sensor has a flat response in the 0.5 – 40 Hz frequency band. The sampling frequency is set to 200 Hz. The GPS is continuously on, in order to provide the best time correction to the records and to be able to compare them with external information (e.g. temperature). The instrumentation started in March 2009, and ended in May 2011, i.e. two years of recording are available.
EWSHM 2014 - Nantes, France
Figure 1: Description of the building tested
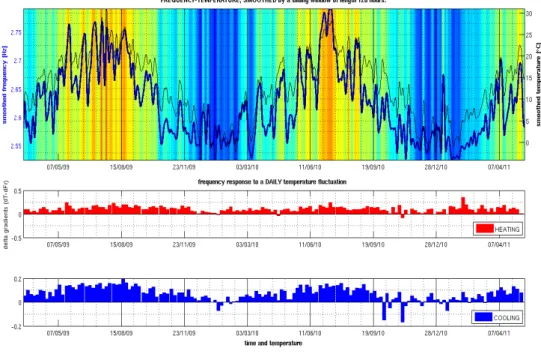
Fourier transforms of one-hour ambient vibrations window show a clear frequency peak, corresponding to the fundamental frequency of the building in the L and T directions, with values of 2.6 Hz and 3.4 Hz, respectively. For two years, the variations of the frequency in the two directions are displayed in Fig. 2. The color scale corresponds to the air temperature recorded by a meteorological station located 2 km far from the building, in the Grenoble basin. As mentioned by Mikael et al. [16], two scales of variation are usually observed: daily variation as function of the day and night variation of temperature, and the seasonal variation related with the winter-summer alternation. In Fig. 2, a time window of 120 hours length smooths the variation of the frequency, i.e. only the seasonal variations are displayed. First, we observe that the RDT allows a very accurate assessment of the frequency, providing information on very small and fast shift of frequency. Same correlation are observed in the L and T direction, that led us confirm the physical origin of the wandering observed for two years, with alternate variation between hot and cold periods.
Figure 2. Variation of the L (blue line) and T (green line) fundamental frequencies for two years, displayed with the variation of the air temperature (min °C: -10 blue – max °C: +40 orange).
4 RESULTS
4.1 Frequency
With the RDT method, the damping coefficient of the building can be computed and we can compare the damping versus frequency variation. Under the single-degree-of-freedom system (SDOF) assumption, the fundamental frequency is related to stiffness K and mass M, through the
! = K
M (2)
where ω=2π.f is the resonant circular frequency of the building. To first order, we assume that the mass M remains constant. The frequency variations are then related to the variation of stiffness K, K depending on the properties of the building (e.g., Young’s modulus, height, design of the building, etc.), but also on the cracks opening and the boundary conditions (e.g., fixed- or flexible-base building).
In order to investigate the effect of the temperature on the building frequency, we focused on one direction (longitudinal) in the following. The correlation between the temperature and the frequency is displayed Figure 3, analysing also the two phases of variation: the « cooling » and the « heating » phases corresponding to the decrease and the increase of the frequency and the temperature, respectively.
Figure 3. Variation of the frequency (blue line) and temperature (black line) for two years and differences of the gradient of temperature and frequency during the heating and cooling phases. (Color scale - min °C: -10 blue – max °C: +40
orange).
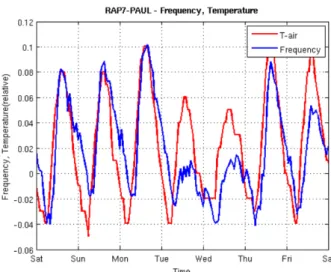
No differences between these two phases are clearly pointed by this figure. At this time scale (seasonal variations), the response of the structure to the external forcing is about the same whatever the cooling or the heating periods. However, looking at the faster variations, i.e. related to the daily time scale, we note (Fig. 4) that the cooling and the heating gradients are different for the temperature and the frequency variation. In fact, while the increase (heating) of the frequency and the temperature has the same rate, the decrease of the frequency (cooling) is faster than the frequency rate let us suppose inertial effect of the temperature on the structure. This is clearly observed in Figure 5 that shows the rate of the frequency decreases or increases closely related with phases of heating and/or cooling, but also with the summer-winter period.
EWSHM 2014 - Nantes, France
Figure 4. Rate of daily variations of the frequency and the temperature for one week.
Figure 5. Comparison between the gradient of the frequency and temperature variation during the increase (heating) and decrease (cooling) phases. The color
plots correspond to the values of the temperature (blue: cold, red: hot).
4.2 Damping
Even though the damping coefficient is a critical parameter for assessment design, it is not usually easy to determine the damping coefficient in experimental conditions and its physical origin in most practical systems are seldom fully understood. The free-oscillating response of the SDOF, as controlled by the e-ξωt function, is thus proportional to the frequency ω and the critical damping coefficient ξ. The critical damping coefficient ξ is expressed as follows:
!= c
2 K.M (3)
where c represents the energy-loss mechanism, and K and M the stiffness and mass of the SDOF respectively. The physical origin of the damping coefficient in existing buildings remains complex, mixing material damping, radiative damping at the soil-structure boundary and certainly
Figure 6. Variation of the L fundamental frequencies (thick blue line) and damping (thin black line) for two years, displayed with the variation of the air temperature (min °C: -10 blue – max °C: +40 orange).
We observe Figure 6 the seasonal (smoothed) variation of the damping with the temperature. The damping varies also with the temperature but this variation seems to be correlated or/and anti-correlated with the temperature according to the value of the temperature and the season. While we observed previously a strong correlation between temperature and frequency, this is not the case for the damping, even if the main parameter controlling damping and frequency is the stiffness (Eqs. 2 and 3).
If we look at the link between the frequency and the damping as function of the air temperature, the relationship is strongly non-linear. Mikael et al. [16] have already observed this nonlinear response of frequency and damping and this observation confirms the lack of knowledge on the damping phenomena observed in the structure.
5 CONCLUSIONS
The natural wandering of the frequency and damping that control the seismic response of a building during an earthquake have been analysed under ambient vibrations. The use of RDT has shown its efficiency for measuring very small variations of damping and frequency for the long-term monitoring of buildings. In our study, the main parameter controlling the fluctuations is the outside temperature. This was confirmed by the analysis performed by Mikael et al. [16] that showed different frequency versus temperature trend, based on independent measurements and for independent buildings. Conclusion is that these variations are of physical origin. In our case, we observe two different behaviours depending on the time-scale considered: daily or seasonal.
While almost all previous studies showed a positive correlation between frequency and temperature, no definitive conclusions can be done from this analysis since non-linear relationship have been observed.
Further works must be done for improving the analysis of this building, testing additional information for explaining the variation observed. This information can be related to the water table level that may wander and change the boundary condition of the structure (e.g., soil-structure interaction effect) or to the winter-summer differences of behaviour of the building with the internal and domestic heat flow.
ACKNOWLEDGMENTS
This work was supported by the French Research National Agency (ANR) under the RiskNat program (project URBASIS n°ANR-09-RISK-009).
REFERENCES
[1] R. Spence, J.J. Bommer, D. Del Re, J. Bird, N. Aydinoglu, S. Tabuchi. Comparing loss estimation with observed damage: a study of the 1999 Kocaeli earthquake in Turkey. Bulletin
EWSHM 2014 - Nantes, France
of Earthquake Engineering, 1(1):83–113, 2003.
[2] C. Michel, P. Guéguen, M. Causse. Seismic vulnerability assessment to slight damage based on experimental modal parameters. Earthquake Engineering and Structural Dynamics, 41(1): 81-98, 2012.
[3] S. W. Doebling, C. R. Farrar, M. B. Prime, D. W. Shevitz. Damage identification and health monitoring of structural and mechanical systems from changes in their vibration characteristics: a literature review. Technical Report report LA-13070-MS., Los Alamos National Laboratory, 1996.
[4] C. R. Farrar, K. Worden. An introduction to structural health monitoring. Philosophical transactions of the Royal Society, 365(1851):303–315, 2007.
[5] M.I. Todorovska, M.D. Trifunac. Impulse response analysis of the Van Nuys 7-storey hotel during 11 earthquakes and earthquake damage detection. Structural control and health monitoring, 15(1):90–116, 2008.
[6] M.I. Todorovska. Soil-structure system identification of Millikan Library north–south response during four earthquakes (1970–2002): What caused the observed wandering of the system frequencies? Bulletin of the Seismological Society of America, 99(2A):626–635, 2009. [7] J.F. Clinton, S.C. Bradford, T.H. Heaton, J. Favela. The observed wander of the natural frequencies in a structure. Bulletin of the Seismological Society of America, 96(1):237–257, 2006.
[8] C. Michel, P. Gueguen. Time–frequency analysis of small frequency variations in civil engineering structures under weak and strong motions using a reassignment method, Structural Health Monitoring, 9(2):159–171, 2010.
[9] M.I. Todorovska, Y. Al Rjoub. Effects of rainfall on soil-structure system frequency: example based on poroelasticity and a comparison with full-scale measurements. Soil Dynamics and Earthquake Engineering, 26(7-8):708–717, 2006.
[10] A. Deraemaker, E. Reynders, G. De Roeck, J. Kulla. Vibration-based structural health monitoring using output-only measurements under changing environment. Mechanical Systems and Signal Processing 22(1):34–56, 2008.
[11] X. G. Hua, Y. Q. Ni, J. M. Ko, K. Y. Wong. Modelling of temperature–frequency correlation using combined principal component analysis and support vector regression technique. Journal of Computing in Civil Engineering, 21(2):122–135, 2007.
[12] R. D. Nayeri, S. F. Masri, R. G. Ghanem, R. L. Nigbor. A novel approach for the structural identification and monitoring of a full-scale 17-story building based on ambient vibration measurements. Smart Materials and Structures, 17(2):1–19, 2008.
[13] J. K. Vandiver, A. B. Dunwoody, R. B. Campbell, M. F. Cook. A mathematical basis for the random decrement vibration signature analysis technique. Journal of Mechanical Design, 104:307–313, 1982.
[14] J. C. Asmussen, R. Brincker, S. R. Ibrahim. Statistical theory of the vector random decrement technique. Journal of Sound and Vibration, 226(2):329–344, 1999.
[15] H. Cole. On-line failure detection and damping measurement of aerospace structures by random decrement signatures. Technical report NASA CR-2205, 1973.
[16] A. Mikael, P. Gueguen, P.-Y. Bard, P. Roux, M. Langlais. Long-term frequency and damping wandering in buildings analysed using the Random Decrement Technique (RDT), Bulletin of the Seismological Society of America, 103(1):236-246, 2013.
![[PDF] Apprendre ALM cours en pdf | Formation Informatique](data:image/gif;base64,R0lGODlhAQABAIAAAP///wAAACH5BAEAAAAALAAAAAABAAEAAAICRAEAOw==)