September 2011
Plasma Science and Fusion Center Massachusetts Institute of Technology
Cambridge MA 02139 USA
This work was supported by the NLUF/DOE (Grant No. DE-FG03-03SF22691), DOE under Cooperative Agreement (Grant No. DE-FC02-04ER54789) Fusion Science Center supported by the Office of Fusion Energy Sciences [1], LLE (Grant No. 412160-001G), LLNL (Grant No.B504974), and GA under DOE (Grant No. DE-AC52-06NA27279).. Reproduction, translation, publication, use and disposal, in whole or in part, by or for the United States government is permitted.
PSFC/JA-11-22
Changes in CR‐39 proton sensitivity due to
prolonged exposure to high vacuums relevant
to the National Ignition Facility and OMEGA
M. J.-E. Manuel, M. J. Rosenberg, N. Sinenian, H. Rinderknecht, A. B. Zylstra, F. H. Séguin, J. Frenje, C. K. Li, and R. D. Petrasso
Changes in CR-‐39 proton sensitivity due to prolonged exposure to
high vacuums relevant to the National Ignition Facility and OMEGA
M. J.-‐E. Manuel, M. J. Rosenberg, N. Sinenian, H. Rinderknecht, A. B. Zylstra, F. H. Séguin, J. Frenje, C. K. Li, and R. D. PetrassoPlasma Science and Fusion Center, Massachusetts Institute of Technology, Cambridge, Massachusetts 02139
When used at facilities like OMEGA and the NIF, CR-‐39 is exposed to high vacuum environments before and after irradiation by charged particles and neutrons. Using an electrostatic linear accelerator at MIT, studies have been conducted to investigate the effects of high vacuum exposure on the sensitivity of CR-‐39 to fusion protons in the ~1–9 MeV energy range. High vacuum conditions, of order 10-‐5 Torr, experienced by CR-‐39
samples at these facilities were emulated. It is shown that vacuum exposure times longer than ~16 hours before proton irradiation result in a decrease in proton sensitivity, whereas no effect was observed for up to 67 hours of vacuum exposure after proton irradiation. CR-‐ 39 sensitivity curves are presented for samples with prolonged exposure to high vacuum
Introduction
CR-‐39 is a clear plastic nuclear track detector utilized in many nuclear diagnostics fielded in today’s large-‐scale Inertial Confinement Fusion (ICF)1 facilities. The ICF
program seeks to reach high-‐energy gain through the implosion of a cryogenic, spherical capsule filled with Deuterium-‐Tritium (DT) fuel. Using X-‐rays or lasers to ablate the outer shell material, the fuel and remaining shell are driven inwards and compressed to thousands of times solid density (~1000 g/cm3). A fusion spark in
the center of the assembled mass initiates a burn wave that propagates through the dense fuel producing many fusion reactions, thereby creating more energy than was required to drive the implosion.
In order to diagnose the success of an ICF implosion, various CR-‐39-‐based nuclear diagnostics have been implemented to measure vital performance parameters. The magnetic recoil spectrometer (MRS)2 measures the
absolute DT-‐neutron yield and down-‐scattered fraction, from which the areal density and ion temperature is derived. Compact, wedge-‐range-‐ filter (WRF) spectrometers3 are fielded with
multiple lines-‐of-‐sight and measure proton spectra, whereby areal density is inferred4.
Neutron yields from the D-‐D and D-‐T fusion reactions are measured using recoil protons in CR-‐395. In addition to measuring performance
parameters for ICF implosions, CR-‐39 is also used in High Energy Density Physics (HEDP) as a detecting medium for proton radiography in various laser-‐plasma experiments6-‐8. All CR-‐39-‐
based nuclear diagnostics rely on the predictable3 response of the plastic to charged
particles.
As a charged particle travels through CR-‐ 39, it deposits energy in the plastic through Coulomb scattering with electrons, leaving a trail of destroyed polymer chains9. Tracks of
broken molecular chains and free radicals are made apparent through use of a chemical etching process. This process exposes tracks because the etch rate of the track (vt) is faster
than that of the bulk plastic (vb)10, 11. The
sensitivity of CR-‐39 to a specific particle species at a given incident energy is dependent on its restricted energy loss (REL) and defined by the ratio of track-‐ and bulk-‐etch rates (V=vt/vb)11.
After etching, an automated optical microscope system is used to scan each CR-‐39 sample and record individual track information for later analysis (see Appendix for further information). The track diameter is a function of the etch rate ratio (V ~1.7-‐1.05 for 1-‐5 MeV protons) and is used as a measure of the sensitivity. The simplicity of this charged particle detection system provides many benefits for use in ICF and HEDP experiments at the NIF12 and
OMEGA13 facilities. However, due to practical
constraints, CR-‐39 samples are left exposed to high vacuum (<10-‐3 Torr) for variable amounts
of time (~1-‐3 hours at OMEGA, ~5-‐120 hours at the NIF) before and after irradiation by charged particles and neutrons. This necessitates characterization of the effects on CR-‐39 response to charged particles due to vacuum exposure.
The effect of vacuum on track registration sensitivity for CR-‐39 from various manufacturers has previously been studied14-‐17.
It was shown that during the initial out gassing period, there is a drop in sensitivity (etch rate ratio) due to the changing oxygen profile in the plastic. Csige et al.15 observed a saturation point
in the reduction of CR-‐39 sensitivity to 6.1 MeV alpha particles after 3 hours of vacuum exposure. It was also shown that if the plastic was immediately exposed to air post-‐irradiation, during the latent track-‐formation period (~minutes after irradiation), that the sensitivity could be partially recovered. These studies primarily used high-‐energy alpha particles, or other high-‐Z ions, and did not consider vacuum pressures below ~10-‐3 Torr. Golovchenko et
al.18 investigated the sensitivity of multiple
types of CR-‐39 to alpha particles in better vacuum conditions (P~4–20*10-‐5 Torr) for up to
10 hours of vacuum exposure. They observed varying amounts of sensitivity reduction for different CR-‐39 manufacturers and a sharper
reduction in sensitivity for lower pressures. Typical pressures for vacuum conditions at OMEGA and the NIF are ~10-‐5 Torr and the
primary particle of interest in CR-‐39-‐based diagnostics is the proton (and in some cases deuterons, tritons, or alphas). Thereis no previous study has examined CR-‐39 sensitivity to MeV protons at vacuum pressures of ~10-‐5
Torr or lower.
This paper is organized as follows. Section I will cover the experimental method used to investigate various vacuum exposure times using the High Energy Density Physics (HEDP) division’s fusion source at MIT. Results of vacuum exposure before and after irradiation are shown and discussed in Section II. Conclusions of this work are presented in Section III.
I.
Experimental Process
A.
Configuration
Experiments were performed using the Linear Electrostatic Ion Accelerator (LEIA) at MIT19. Acceleration of a 140 kV deuteron beam
onto a 3He-‐doped erbium-‐deuteride (ErD2)
target produces the following fusion reactions:
D + D ⇒ 3He (0.8 MeV) + n (2.45 MeV) D + D ⇒ T (1.01 MeV) + p (3.02 MeV) D + 3He ⇒ α (3.6 MeV) + p (14.7 MeV)
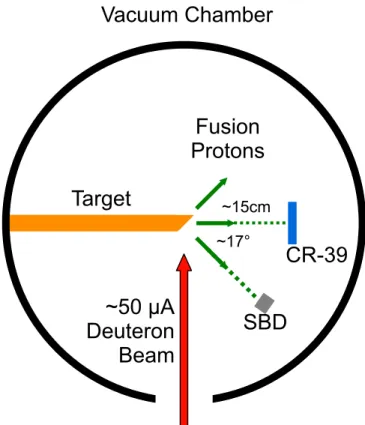
In these experiments, individual CR-‐39 samples were placed in the vacuum chamber ~15 cm from the target (Figure 1). A surface-‐barrier-‐ detector (SBD) situated 17° (or 34° for shutter experiments) from the CR-‐39 is used to count protons in-‐situ. The SBD provides an accurate measure of expected proton fluence at the CR-‐ 39 surface, thereby ensuring good statistics without saturating the sample. Because the CR-‐ 39 response is energy dependent, aluminum step-‐filters are used to range down DD-‐ and D3He-‐protons to provide various incident
energies at the CR-‐39 surface20. The SBD is used
to accurately calibrate each filter pack before
being fielded. There is a systematic energy uncertainty in the SBD calibration of ±75 keV and is transferred to the associated filter pack energy.
In order to run the high voltage ion beam, the entire system must be at high vacuum (pressures of ~10-‐5 Torr) to avoid arcing. The
system achieves high vacuum through a combination of roughing and turbo pumps. First, a roughing pump is used to bring the chamber down to ~5*10-‐2 Torr which takes ~10 minutes.
After reaching rough vacuum, the turbo-‐pump is “valved-‐in” and brings the chamber pressure down to less than 10-‐5 Torr in ~30–45 minutes.
Before fusion products irradiate the CR-‐39 sample, it is exposed to continuously decreasing pressure in the chamber. The pump-‐down process described emulates the basic procedure
Vacuum Chamber
~50 µA
Deuteron
Beam
Fusion
Protons
CR-39
SBD
Target
~17° ~15cmFigure 1: A schematic of the experimental layout in the vacuum chamber is shown above. A deuteron beam is incident on a 3He-‐doped ErD2 target. DD and D3He fusion protons are produced and irradiate CR-‐ 39 samples exposed to various vacuum conditions. The number of particles incident on the CR-‐39 is controlled through in-‐situ counting using a surface barrier detector (SBD).
for fielding CR-‐39-‐based nuclear diagnostics on OMEGA and the NIF. This level of vacuum exposure serves as the baseline for comparison to different vacuum exposure conditions.
Two different experiments were performed to examine the effect on the response of 1.5 mm thick TasTrak® CR-‐39 due to vacuum exposure. (1) CR-‐39 samples were irradiated with fusion protons at the baseline vacuum exposure and kept in high vacuum for different amounts of time after irradiation. (2) CR-‐39 samples were brought to the baseline and kept in vacuum for extended periods of time
before proton irradiation. During these
prolonged periods in high vacuum, the pressure continues to drop and saturates at ~10-‐7 Torr
after ~16 hours.
B.
Processing and Analysis
After an experiment is finished, the vacuum chamber is vented with dry nitrogen. Once the N2 pressure of the system reaches
ambient atmosphere (after ~5 minutes), CR-‐39 samples are removed from the chamber. During irradiation and venting time, latent track formation may occur without reintroducing oxygen to the system. CR-‐39 samples typically sit at room temperature and pressure for a day (or more) before processing begins. A 6N sodium-‐hydroxide (NaOH) solution is used at 80°C to etch each sample. All samples in this study were etched for 6 hours. After etching, the samples are scanned using an automated, optical microscope system whereby the diameter, eccentricity, and contrast of each pit are recorded for analysis. The spatial resolution is set by the optical parameters of the microscope system. For these experiments, microscope settings resulted in a spatial resolution limit of ~0.3 µm.
The proton birth spectrum is narrow19,
but broadened when passing through the filter pack, this in turn produces a spectrum of diameters on the CR-‐3920. Gaussian fits are used
to measure the peaks of the energy and diameter distributions (see Appendix for further details). The resulting random uncertainties in
mean diameter and energy are calculated from the 95% confidence bounds in the fits and found to be ≤0.05 μm and ≤10 keV, respectively. Total uncertainties in energy and diameter measurements are smaller than the symbols used.
II. Results and Discussion
A.
Vacuum Exposure After Proton
Irradiation
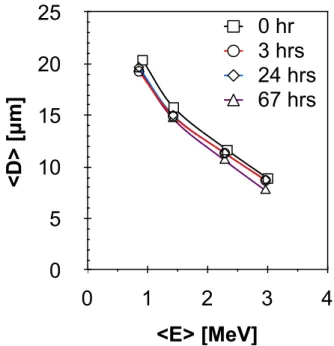
Four individual samples of CR-‐39 were irradiated with DD-‐protons and then left at high vacuum. Figure 2 shows the resulting diameter versus energy (D vs. E) curves for four different vacuum exposure times. The response of CR-‐39 to 1–3 MeV protons is observed to be stable to vacuum exposure after proton irradiation for up to 67 hours. The slight decrease in mean diameter observed at longer vacuum times may be due to vacuum exposure, but these deviations are easily within typical piece-‐to-‐ piece variation20.
The observed stability in CR-‐39 sensitivity when exposed to vacuum after
0
5
10
15
20
25
0
1
2
3
4
<D
>
[µ
m
]
<E> [MeV]
0 hr
3 hrs
24 hrs
67 hrs
Figure 2: The stability of CR-‐39 response to 1–3 MeV protons is illustrated when exposed to high vacuum
after irradiation. Mean diameter vs. energy curves are
shown for various vacuum exposure times (given as time left in vacuum after irradiation). The 3-‐hour curve is obscured by the 24-‐hour curve.
irradiation is easily understood through the process by which tracks are formed. Latent track formation in CR-‐39 is known to take place shortly after irradiation15. The etch rate ratio is
affected by the oxygen profile during the track formation process. Tracks have already formed in the first few minutes after irradiation and are therefore insensitive to an extended period in a high vacuum environment.
B.
Vacuum Exposure Before Proton
Irradiation
Six individual CR-‐39 samples were exposed for various amounts of time in high vacuum before proton irradiation. Both DD-‐ and D3He-‐protons were used to probe the response
of CR-‐39 to protons in the energy range of 1–9 MeV.
Figure 3 displays the resulting D vs. E curves for six different vacuum exposure times. Up to 16 hours of vacuum exposure shows only small changes (~15-‐30%) in D vs. E. These small
deviations, however, oscillate about the baseline curve and are consistent with typical piece-‐to-‐ piece variation20. At 68 hours of vacuum
exposure, a large decrease in mean diameter is observed for most proton energies. Protons at the two highest energies, ~7.1 MeV and ~8.6 MeV, have become undetectable at the longest vacuum exposure time (see Appendix for further details).
0
5
10
15
20
25
0
2
4
6
8
10
<D
>
[µ
m
]
<E> [MeV]
0 hrs
1 hrs
3 hrs
6 hrs
16 hrs
68 hrs
10
11
12
13
-2.4
-1.2
0
1.2
2.4
<D
>
[µ
m
]
x-position [cm]
Sample 1 Sample 2 b) <D>(x)-2.4
-1.2
0
1.2
2.4
-2.4
-1.2
0
1.2
2.4
y-p
o
si
ti
o
n
[µ
m
]
x-position [cm]
a) N(x,y)Figure 3: Six D vs. E curves are shown for CR-‐39 exposed to high vacuum before proton irradiation. Exposure times given correspond to vacuum exposure after the baseline was achieved. Small oscillations in D vs. E are observed for up to 16 hours in vacuum. However, at 68 hours the average diameter has decreased greatly for all proton energies. The highest energy protons at ~7.0 and ~8.6 MeV are no longer detectable.
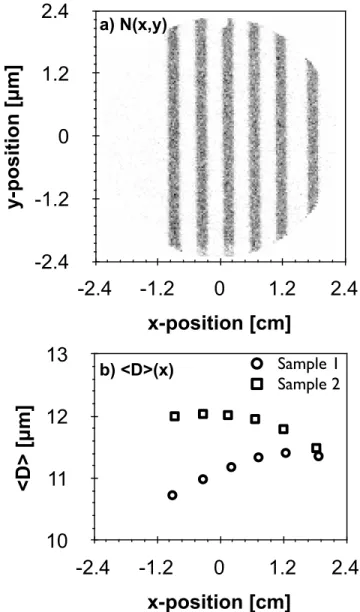
Figure 4: The number density (tracks/cm2) image for Sample 2 is shown in a) where darker indicates more tracks. Each sample was irradiated by ~2.9 MeV protons using a shutter system at the baseline vacuum exposure time. Mean diameters are shown in b) to differ as a function of position by ~3%/cm. The opposite trends observed between Sample 1 and 2 indicate that kinematic energy spread is not responsible for observed diameter deviations.
In order to eliminate piece-‐to-‐piece variation in D vs. E seen in Figure 3, a vacuum shutter system was utilized. The shutter allowed for irradiation across small discrete areas with identical filtering schemes. To investigate the diameter (energy) resolution on a single sample, a ~6 µm Al filter was used to expose CR-‐39 at six different positions to ~2.9 MeV protons at the baseline vacuum exposure. The time between ~3 min exposures was ~2 min so the whole experiment lasted ~30 min, whereby no measureable vacuum effects are expected. The experiment was performed on two CR-‐39 samples and the results are shown in Figure 4. Measurements indicate a deviation from the mean of ~4% and maximum difference of ~6%. For comparing diameters (energies) at different positions on a single sample, these data indicate a systematic error of ~3%/cm. Because these protons are products of beam fusion, there is a kinematic spread in incident energy of ±50 keV from one side to the other, but this is not sufficient to explain the observed deviations in mean diameter. Also, both samples were fielded identically, but illustrate opposite trends in mean diameter with respect to position indicating that kinematic energy shift could not be responsible for the observed deviations. Small inhomogeneities in the polymer could explain this level of discrepancy and provide a lower limit on energy resolution across a single CR-‐39 sample.
To investigate the effects of vacuum exposure before proton irradiation on a single sample the shutter system was utilized. Two samples were fielded with aluminum step filters, one irradiated with DD-‐protons and the other with D3He-‐protons. The shutter allowed for
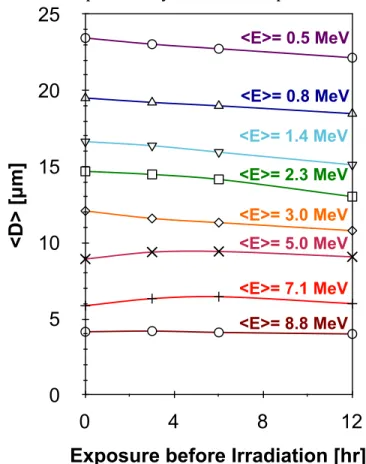
proton irradiation at different vacuum times without breaking vacuum and reintroducing oxygen to the sample. Figure 5 shows the mean diameter as a function of vacuum exposure time
before irradiation for eight incident proton
energies on two CR-‐39 samples. Over the 12 hour vacuum exposure, deviations up to ~10%
are observed. However, this magnitude of deviation may be expected when comparing diameters from areas ~3 cm apart (as indicated in Figure 4). Therefore, modest vacuum exposure times (≤12 hr) before proton irradiation does not alter the response from the baseline exposure any more than expected.
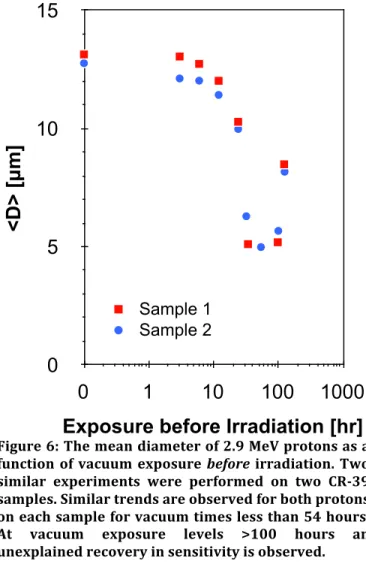
In order to accurately probe the effects of an extremely long vacuum exposure before proton irradiation, a single CR-‐39 sample was used with a single ~6 µm aluminum filter on the shutter. The experiment was performed on two separate samples with two similar, but separate, pump-‐down sequences. CR-‐39 samples were irradiated with DD protons at multiple levels of vacuum exposure up to ~5 days, a NIF-‐relevant vacuum exposure time. Figure 6 shows the resulting mean diameter of ~2.9 MeV protons. After analyzing data from Sample 1, a second experiment was performed to confirm the trend
0 5 10 15 20 25 0 4 8 12 <D > [µ m ]
Exposure before Irradiation [hr] <E>= 0.5 MeV <E>= 0.8 MeV <E>= 1.4 MeV <E>= 2.3 MeV <E>= 3.0 MeV <E>= 5.0 MeV <E>= 7.1 MeV <E>= 8.8 MeV
Figure 5: The resulting mean diameter as a function of vacuum exposure time for eight different energies is shown. A single CR-‐39 sample was used for energies ≤3 MeV using DD-‐protons and a different sample for ≥5 MeV using D3He-‐protons.
with an extra sample time at ~54 hours. For both samples, a continuous drop in sensitivity is observed up to the ~34-‐hour exposure time in Sample 1 and the ~54-‐hour mark in Sample 2. The observed reduction in track diameter is explained by a constantly declining oxygen profile due to extended time in high vacuum. Mean track diameters are slightly higher at the ~100-‐hour exposure than the preceding time in both samples. However, sensitivity significantly recovers at the ~125-‐hour mark. At this time, no explanation is given for the resurgence of CR-‐39 sensitivity at vacuum times >100 hours.
In summary, CR-‐39 exposed to high vacuum before proton irradiation shows a dependency on the level of vacuum exposure. This effect is attributed to the continually changing oxygen profile in the CR-‐39 sample as a function of time with some component due to
spatial inhomogeneities in the polymer. For vacuum exposure times less than 16 hours, the deviations observed in D vs. E are of comparable magnitude and shape as typical piece-‐to-‐piece variations20. As vacuum exposure time is
increased to ~70 hours, overall sensitivity of the plastic decreases to the point that higher energy protons (smaller diameter tracks) become completely undetectable. The results also indicate that at extremely long vacuum exposure times (>100 hours) before irradiation, the sensitivity significantly recovers due to an unknown source (see Appendix for detailed information).
III. Conclusions
CR-‐39 is a plastic nuclear track detector used in many nuclear diagnostics for the ICF program and as a detecting medium for proton radiography in various HEDP experiments. When fielded on large-‐scale facilities, CR-‐39 may be exposed for hours (at OMEGA), or days (at the NIF), to high vacuum before and after irradiation by charged particles. It has been previously shown that exposure to rough vacuum has a dramatic effect on CR-‐39 sensitivity14, 15, 18. However, in any high vacuum
system, there is a transitory period from atmospheric pressure, through rough vacuum, to high vacuum. During this process, CR-‐39 inevitably loses some sensitivity because of out gassing and the declining oxygen profile. The question of the predictability of CR-‐39 sensitivity after the transitory period is important to the successful implementation for quantitative applications at OMEGA and the NIF. It was shown that prolonged exposure to high vacuum after irradiation at the baseline had no effect on CR-‐39 sensitivity (Figure 2). This is sensible because latent track formation is dependent not only on ionization characteristics during irradiation, but also the complex physico-‐chemical processes that take place only minutes afterwards15.
When left in high vacuum for modest exposure times (<16 hours) before proton irradiation, CR-‐39 response was not strongly
0
5
10
15
0
1
10
100
1000
<D
>
[µ
m
]
Exposure before Irradiation [hr]
Sample 1 Sample 2
Figure 6: The mean diameter of 2.9 MeV protons as a function of vacuum exposure before irradiation. Two similar experiments were performed on two CR-‐39 samples. Similar trends are observed for both protons on each sample for vacuum times less than 54 hours. At vacuum exposure levels >100 hours an unexplained recovery in sensitivity is observed.
affected. Shutter experiments performed on single CR-‐39 samples indicated that vacuum times ≤12 hours were consistent with expected diameter deviations (~3%/cm) across a single piece (Figure 5). The exact nature of the vacuum effect was indistinguishable from piece-‐to-‐piece variations for up to 16 hours of vacuum exposure, but strongly reduced sensitivity by the 68-‐hour mark (Figure 3).
Long exposure times (> 20 hours) before proton irradiation exhibited a strong affect on CR-‐39 response and must be treated carefully. This study suggests that the exact oxygen profile and small-‐scale polymer inhomogeneities in CR-‐ 39 are responsible for some observed piece-‐to-‐ piece variations in the sensitivity to protons. These intrinsic factors are a function of the manufacturing process and environmental conditions prior to particle irradiation. Piece-‐to-‐ piece variation of these intrinsic factors affect CR-‐39 sensitivity as much, or more than, vacuum exposure up to 16 hours. This inconsistency is relatively small and accounted for when calibrating CR-‐39. However, for extended vacuum exposure times, the oxygen profile changes drastically and its effect is clearly visible in measured track diameters. A method to calibrate CR-‐39 sensitivity in these long vacuum exposures is underway.
Acknowledgements
The authors would like to express their gratitude to Jocelyn Schaeffer and Robert Frankel for their support in the etching and scanning process of the many pieces of data generated in this work and to Robert A. Childs for the development and implementation of the fielded shutter system and vacuum quality support. The work described here was done in part for the first author’s PhD thesis and supported in part by NLUF/DOE (Grant No. DE-‐ FG03-‐03SF22691), DOE under Cooperative Agreement (Grant No. DE-‐FC02-‐04ER54789) Fusion Science Center supported by the Office of Fusion Energy Sciences [1], LLE (Grant No. 412160-‐001G), LLNL (Grant No.B504974), and
GA under DOE (Grant No. DE-‐AC52-‐ 06NA27279).
IV. Appendix: Track Formation and
Data Analysis
The specific manufacturing process of CR-‐39 has a large impact on the charged-‐ particle sensitivity and response. For these experiments, TasTrak® 1.5 mm thick CR-‐39 was used and etched in 6N NaOH at 80°C. Any changes in the plastic or etchant will alter the response and must be regularly characterized. Also, quantities such as the bulk etch rate (vB)
may change over time due to different manufacturing techniques used by a single company and must be assessed regularly.
Track diameters are measured using an automated optical microscope with submicron resolution. This system, developed at MIT, records the absolute position, mean diameter, eccentricity, and contrast of each pit3. Tracks
are revealed during the etching process whereby damage trails left in polymer chains of the CR-‐39 etch faster (vT~3.5-‐5.6µm/hr) than
the bulk plastic (vB~3.3µm/hr). The size and
apparent contrast of a track are related to the shape of the pit. Energy deposition along the damage trail, defined by the restricted energy loss (REL), along with the etching process governs the corresponding pit shape. Figure 7a) illustrates how the REL of a proton changes as it travels through CR-‐39 for three different incident energies; the typical depth (~20 µm) for a 6-‐hour etch is also indicated. Protons of these three energies leave very different tracks because of the distinct energy deposition profiles along the damage trail. For low-‐energy particles (i.e. ≲0.8 MeV) where the etch depth has exceeded the range of the particle, a large circular crater is formed. This crater appears high in contrast relative to the background because light is mostly reflected. As this track is etched further, the crater wall becomes shallower, allowing more light to pass such that the track appears lower in contrast.
Medium-‐energy protons (i.e. ~3.0 MeV) have a range larger than the etch depth and deposit enough energy along their path to create a deep conical pit. The pit wall internally reflects most light creating a very high contrast track. As the proton energy increases (i.e. ~7.1 MeV), the amount of energy deposited up to the etch depth diminishes and shallower conical pits are formed. These shallow pits do not reflect as much light and appear lighter in contrast. A schematic of the pit shapes and corresponding track images are shown in Figure 7b)-‐c).
In the analysis of data (see Table 1 for reference shot numbers) generated for this work, signal tracks are separated by properly defined contrast and diameter limits. The
Pre-etch Post-etch 0.8 MeV MeV3.0 7.1 MeV b) 0 500 1000 1500 2000 1 10 100 1000 R EL 20 0 [Me V/ cm ] Depth in CR-39 [µm] 0.8 MeV 3.0 MeV 7.1 MeV a) Po st-e tc h Su rfa ce ~38µm c) ~20µm Proton Tracks Noise Triton Tracks Proton Tracks Noise
Figure 7: REL as a function of depth in CR-‐39 is shown for three incident proton energies in (a) with the typical depth for a 6-‐hour etch. Energy deposition along the damage trail controls the shape of the pit and therefore, the track appearance in the optical microscope system. A schematic of the pit shapes (b) and corresponding track images (c) are shown.
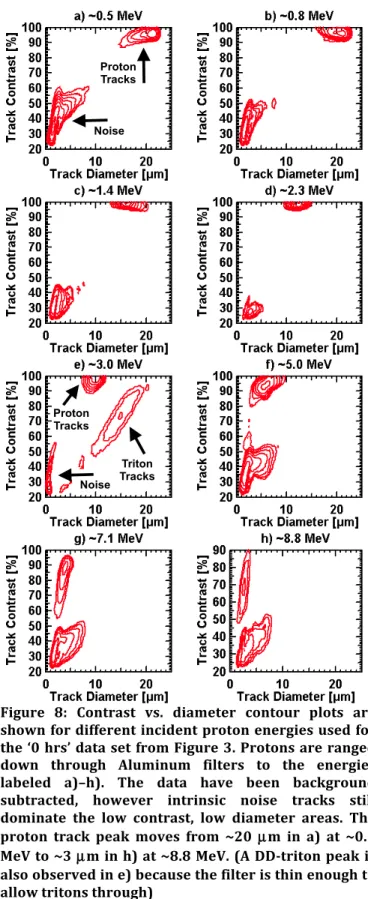
Figure 8: Contrast vs. diameter contour plots are shown for different incident proton energies used for the ‘0 hrs’ data set from Figure 3. Protons are ranged down through Aluminum filters to the energies labeled a)–h). The data have been background subtracted, however intrinsic noise tracks still dominate the low contrast, low diameter areas. The proton track peak moves from ~20 µm in a) at ~0.5 MeV to ~3 µm in h) at ~8.8 MeV. (A DD-‐triton peak is also observed in e) because the filter is thin enough to allow tritons through)
relative size and location of different energy and vacuum exposure windows are obviously known from the experimental setup and filtering schemes used. Each window is analyzed separately and contrast/diameter limits set individually. After signal tracks are pulled from intrinsic noise, the diameters are binned and fit to Gaussians for an accurate measure of the average diameter.
Figure 8 illustrates contour plots in contrast-‐diameter space for proton tracks behind different filter windows at the baseline (‘0 hrs’) vacuum exposure shown in Figure 3. Here, proton tracks have high contrast and noise dominates lower contrast. However, proton tracks on both sides of the probed energy range get smaller in diameter and lower in contrast, and in extreme cases are not separable from the intrinsic noise. It is clearly seen in Figure 8a)-‐h) that the mean track diameter changes as a function of mean incident energy, and the shape of the diameter distribution is evolving. Corresponding proton
track diameter distributions are shown in Figure 9 with Gaussian fits.
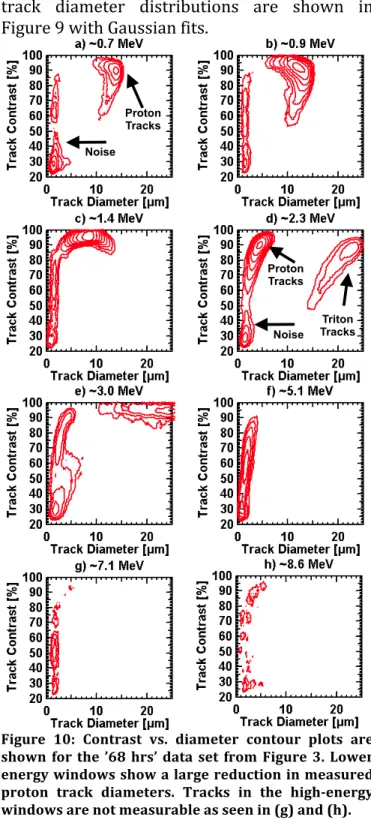
Similar contour-‐diameter plots and corresponding diameter distributions are shown for the ’68 hrs’ data set from Figure 3 in Figure 10 and Figure 11, respectively. It is easily seen that prolonged exposure to high vacuum
before irradiation has affected the CR-‐39
response to incident protons. Low energy 0 2000 4000 6000 8000 10000 0 5 10 15 20 25 C o u n ts p er b in [a rb ] Track Diameter [µm] 8.8 MeV <D>=2.8 µm 7.1 MeV <D>=3.6 µm 5.0 MeV <D>=5.8 µm 3.0 MeV <D>=9.9 µm 2.3 MeV <D>=12.4 µm 1.4 MeV <D>=16.0 µm 0.5 MeV <D>=21.0 µm 0.8 MeV <D>=20.4 µm Proton Tracks Noise Triton Tracks Noise Proton Tracks
Figure 9: Diameter distributions are shown for proton tracks behind each energy window discussed in Figure 8. Gaussian fits (lines) are shown along with the data used for the fit (black points). For the baseline vacuum exposure, Gaussian fits provide good representations of proton track distributions.
Figure 10: Contrast vs. diameter contour plots are shown for the ’68 hrs’ data set from Figure 3. Lower energy windows show a large reduction in measured proton track diameters. Tracks in the high-‐energy windows are not measurable as seen in (g) and (h).
protons (≤2.3 MeV) are observed to have a large reduction in mean diameter with higher energies (≥3 MeV) beginning to blend in with intrinsic noise tracks. As the incident energy is raised, it is increasingly difficult to distinguish data from noise and eventually tracks are no longer detected, as seen in Figure 10g)-‐h).
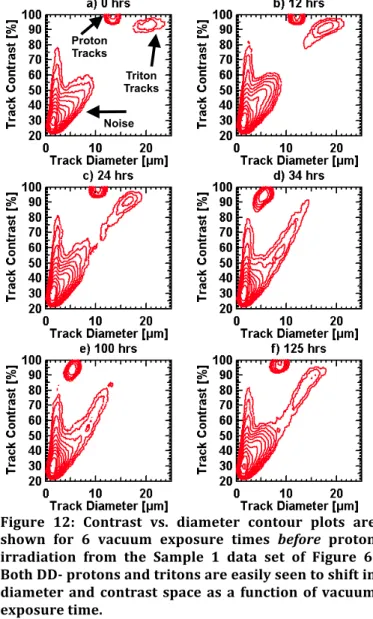
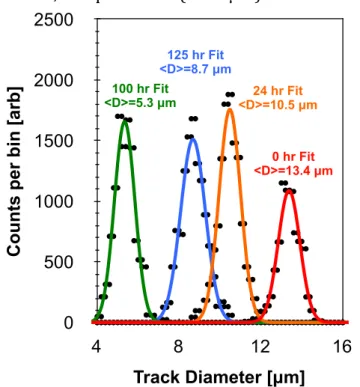
Figure 12 shows sample contrast versus diameter contour plots from data shown in Figure 6 for Sample 1. In Figure 12a) the ~2.9 MeV proton peak is clearly seen at ~14 μm, the broader ~0.4 MeV triton peak at ~20 μm, and intrinsic noise tracks are dispersed in the lower left at low contrast. Proton tracks are reduced in size as the vacuum exposure increases, as seen in Figure 12b)-‐f).
Proton and triton tracks follow similar evolutions with increased vacuum exposure
time. However, the triton peak becomes much lower in contrast and begins to blend in with intrinsic noise tracks, while the proton tracks continue to stay well separated at high contrast. It is easily seen in Figure 12f) that at ~125 hr of vacuum exposure before irradiation, proton tracks have become larger than the previous ~100 hr exposure time and the tritons have begun coming out of the intrinsic noise level. This recovery in CR-‐39 sensitivity is not well understood, but is absolutely unambiguous in the data for both CR-‐39 samples for both triton and proton tracks.
For simple analysis, proton tracks are isolated from intrinsic noise using practical diameter and contrast limits. The resultant diameter distributions are well represented by 0 2000 4000 6000 8000 10000 0 5 10 15 20 C o u n ts p er b in [a rb ] Track Diameter [µm] 8.6 MeV <D>=N/A µm 7.0 MeV <D>=N/A µm 5.1 MeV <D>=1.8 µm 3.0 MeV <D>=3.0 µm 2.3 MeV <D>=4.2 µm 1.4 MeV <D>=8.2 µm 0.7 MeV <D>=13.4 µm 0.9 MeV <D>=12.3 µm TracksTriton Noise Proton Tracks
Figure 11: Measured proton track diameters are shown with Gaussian fits for energy windows discussed in Figure 10. For energy windows ≤2.3 MeV, track diameter distributions are still well approximated by Gaussians. At higher incident energies (≥3 MeV), diameter distributions become peaked towards smaller diameters. For the two highest energies, tracks were not measureable.
Figure 12: Contrast vs. diameter contour plots are shown for 6 vacuum exposure times before proton irradiation from the Sample 1 data set of Figure 6. Both DD-‐ protons and tritons are easily seen to shift in diameter and contrast space as a function of vacuum exposure time.
Gaussians and fit accordingly. These means are reported in the figures of this paper. Sample Gaussian fits to proton data from Figure 12 are illustrated in Figure 13. Black points correspond to track distributions measured at each individual vacuum exposure time. Gaussian fits are shown for all six exposure-‐times from Figure 12. It is easily seen that the diameter distributions are Gaussian and the uncertainty in the fits, as calculated by the 95% confidence bounds, are quite small (≤0.05µm).
Table 1: Associated shot numbers for each of the figures are displayed below.
Data Set Ref. Shot Number Figure 2,3 – 0hr 2009102201 Figure 2 – 3/24/67 hr 200908 0601/0602/0701 Figure 3 – 1 hr 2009102201 Figure 3 – 3 hr 2009120201 Figure 3 – 6 hr 2009120301 Figure 3 – 16 hr 2009120302 Figure 3 – 68 hr 2009111601 Figure 4 – Sample 1/2 20110420 07/01 Figure 5 – E<3MeV / E>5MeV 201004 1501/0201 Figure 6 – Sample 1/2 2010 092801/100701 References
1 J. D. Lindl, P. Amendt, R. L. Berger, S. G. Glendinning, S. H.
Glenzer, S. W. Haan, R. L. Kauffman, O. L. Landen and L. J.
Suter, Physics of Plasmas 11 (2), 339-‐491 (2004).
2 J. A. Frenje, D. T. Casey, C. K. Li, F. H. Seguin, R. D.
Petrasso, V. Y. Glebov, P. B. Radha, T. C. Sangster, D. D. Meyerhofer, S. P. Hatchett, S. W. Haan, C. J. Cerjan, O. L. Landen, K. A. Fletcher and R. J. Leeper, 17, 056311-‐
056319 (2010).
3 F. H. Séguin, J. A. Frenje, C. K. Li, D. G. Hicks, S.
Kurebayashi, J. R. Rygg, B. E. Schwartz, R. D. Petrasso, S. Roberts, J. M. Soures, D. D. Meyerhofer, T. C. Sangster, J. P. Knauer, C. Sorce, V. Y. Glebov, C. Stoeckl, T. W. Phillips, R. J. Leeper, K. Fletcher and S. Padalino, Review of
Scientific Instruments 74 (2), 975-‐995 (2003).
4 F. H. Séguin, C. K. Li, J. A. Frenje, S. Kurebayashi, R. D.
Petrasso, F. J. Marshall, D. D. Meyerhofer, J. M. Soures, T. C. Sangster, C. Stoeckl, J. A. Delettrez, P. B. Radha, V. A. Smalyuk and S. Roberts, Physics of Plasmas 9 (8), 3558-‐
3566 (2002).
5 J. A. Frenje, C. K. Li, F. H. Seguin, D. G. Hicks, S.
Kurebayashi, R. D. Petrasso, S. Roberts, V. Y. Glebov, D. D. Meyerhofer, T. C. Sangster, J. M. Soures, C. Stoeckl, C. Chiritescu, G. J. Schmid and R. A. Lerche, Review of
Scientific Instruments 73 (7), 2597-‐2605 (2002).
6 C. K. Li, F. H. Séguin, J. A. Frenje, M. Rosenberg, R. D.
Petrasso, P. A. Amendt, J. A. Koch, O. L. Landen, H. S. Park, H. F. Robey, R. P. J. Town, A. Casner, F. Philippe, R. Betti, J. P. Knauer, D. D. Meyerhofer, C. A. Back, J. D. Kilkenny and A. Nikroo, Science 327 (5970), 1231-‐
1235 (2010).
7 J. R. Rygg, F. H. Séguin, C. K. Li, J. A. Frenje, M. J.-‐E. Manuel,
R. D. Petrasso, R. Betti, J. A. Delettrez, O. V. Gotchev, J. P. Knauer, D. D. Meyerhofer, F. J. Marshall, C. Stoeckl and
W. Theobald, Science 319 (5867), 1223-‐1225 (2008).
8 R. D. Petrasso, C. K. Li, F. H. Seguin, J. R. Rygg, J. A. Frenje,
R. Betti, J. P. Knauer, D. D. Meyerhofer, P. A. Amendt, D. H. Froula, O. L. Landen, P. K. Patel, J. S. Ross and R. P. J.
Town, Physical Review Letters 103 (8), 085001 (2009).
9 A. P. Fews and D. L. Henshaw, Nuclear Instruments and
Methods in Physics Research 197 (2-‐3), 517-‐529
(1982).
10 B. Dörschel, D. Fülle, H. Hartmann, D. Hermsdorf, K.
Kadner and C. Radlach, Radiation Protection Dosimetry 69 (4), 267-‐274 (1997).
11 B. Dörschel, D. Fülle, H. Hartmann, D. Hermsdorf, K.
Kadner and C. Radlach, Radiation Protection Dosimetry 71 (2), 99-‐106 (1997).
12 G. H. Miller, E. I. Moses and C. R. Wuest, Nuclear Fusion
44 (12), S228-‐S238 (2004).
13 T. R. Boehly, D. L. Brown, R. S. Craxton, R. L. Keck, J. P.
Knauer, J. H. Kelly, T. J. Kessler, S. A. Kumpan, S. J. Loucks, S. A. Letzring, F. J. Marshall, R. L. McCrory, S. F. B. Morse, W. Seka, J. M. Soures and C. P. Verdon, Optics
Communications 133 (1-‐6), 495-‐506 (1997). 0 500 1000 1500 2000 2500 4 8 12 16 C o u n ts p er b in [a rb ] Track Diameter [µm] 0 hr Fit <D>=13.4 µm 24 hr Fit <D>=10.5 µm 100 hr Fit <D>=5.3 µm 125 hr Fit <D>=8.7 µm
Figure 13: Gaussian fits are shown using diameter distributions from six different vacuum exposure times before proton irradiation. Data points are shown as points with corresponding fits as lines.
14 M. Fujii, I. Scige and S. J. Somogyi, presented at the
Cosmic Ray Conference, Moscow, 1987 (unpublished).
15 I. Csige, I. Hunyadi, G. Somogyi and M. Fujii,
International Journal of Radiation Applications and Instrumentation. Part D. Nuclear Tracks and Radiation
Measurements 15 (1-‐4), 179-‐182 (1988).
16 T. Yamauchi, K. Oda and H. Miyake, International
Journal of Radiation Applications and Instrumentation. Part D. Nuclear Tracks and Radiation Measurements 20
(4), 615-‐617 (1992).
17 M. Fujii, Y. Hatano, A. Osawa, T. Saito, K. Yamamoto, T.
Hasebe, T. Nakamura, H. Sasaki, T. Yanagita, M. Aglietta, S. Vernetto, A. Castellina, W. Fulgione, O. Saavedra and G. C. Trinchero, Radiation Measurements 31 (1-‐6), 591-‐
594 (1999).
18 A. N. Golovchenko and S. P. Tretyakova, International
Journal of Radiation Applications and Instrumentation. Part D. Nuclear Tracks and Radiation Measurements 20
(3), 521-‐523 (1992).
19 S. C. McDuffee, J. A. Frenje, F. H. Seguin, R. Leiter, M. J.
Canavan, D. T. Casey, J. R. Rygg, C. K. Li and R. D. Petrasso, Review of Scientific Instruments 79 (4),
043302-‐043306 (2008).
20 N. Sinenian, M. Rosenberg, M. J. E. Manuel, S. C.
McDuffee, F. H. Séguin, J. A. Frenje, C. K. Li and R. D.
Petrasso, (MIT, 2011).