HAL Id: hal-01182982
https://hal.archives-ouvertes.fr/hal-01182982
Submitted on 6 Aug 2015
HAL is a multi-disciplinary open access
archive for the deposit and dissemination of
sci-entific research documents, whether they are
pub-lished or not. The documents may come from
teaching and research institutions in France or
abroad, or from public or private research centers.
L’archive ouverte pluridisciplinaire HAL, est
destinée au dépôt et à la diffusion de documents
scientifiques de niveau recherche, publiés ou non,
émanant des établissements d’enseignement et de
recherche français ou étrangers, des laboratoires
publics ou privés.
Distributed under a Creative Commons CC0 - Public Domain Dedication| 4.0 International
License
AStrion strategy: from acquisition to diagnosis.
Application to wind turbine monitoring
Zhong-Yang Li, Timothée Gerber, Marcin Firla, Pascal Bellemain, Nadine
Martin, Corinne Mailhes
To cite this version:
Zhong-Yang Li, Timothée Gerber, Marcin Firla, Pascal Bellemain, Nadine Martin, et al.. AStrion
strategy: from acquisition to diagnosis. Application to wind turbine monitoring. Insight -
Non-Destructive Testing & Condition Monitoring, British Institute of Non-destructive Testing, 2015, 57
(8), pp.6. �10.1784/insi.2015.57.8.442�. �hal-01182982�
l Paper presented at CM 2015 / MFPT 2015, the Twelfth International Conference on Condition Monitoring and Machinery Failure Prevention Technologies, Oxford, UK, June 2015
Zhong-Yang Li, Timothée Gerber, Marcin Firla, Pascal Bellemain and Nadine Martin are with the Université Grenoble Alpes, GIPSA-Lab, F-38000 Grenoble, France and CNRS, GIPSA-Lab, F-38000 Grenoble, France. Email: firstname.lastname@gipsa-lab.grenoble-inp.fr Corinne Mailhes is with IRIT/ENSEEIHT/TéSA, University of Toulouse, France. Email: corinne.mailhes@enseeiht.fr
AStrion strategy: from acquisition to diagnosis.
Application to wind turbine monitoring
This paper proposes an automatic procedure for condition monitoring. It presents a valuable tool for the maintenance
of expensive and spread systems, such as wind turbine farms. Thanks to data-driven signal processing algorithms,
the proposed solution is fully automatic for the user. The paper briefly describes all the steps of the processing, from
preprocessing of the acquired signal to interpretation of the generated results. It starts with an angular resampling
method with speed measurement correction. Then comes a data validation step, in both the time/angular and
frequency/order domains. After the preprocessing, the spectral components of the analysed signal are identified and
classified into several classes, from sine wave to narrowband components. This spectral peak detection and classification
allows the harmonic and side-band series to be extracted, which may be part of the signal spectral content. Moreover,
the detected spectral patterns are associated with the characteristic frequencies of the investigated system. Based on the
detected side-band series, the full-band demodulation is performed. At each step, the diagnosis features are computed
and dynamically tracked, signal by signal. Finally, system health indicators are proposed to conclude the condition of the
investigated system. All the steps mentioned create a self-sufficient tool for a robust diagnosis of mechanical faults. The
paper presents the performance of the proposed method on real-world signals from a wind turbine drivetrain.
Z-Y Li, T Gerber, M Firla, P Bellemain, N Martin and C Mailhes
1. Introduction
Condition monitoring systems (CMS) are widely-used predictive maintenance tools that aim to diagnose the health status of a system. This helps to reduce the operating costs by detecting abnormalities in the state of the investigated system.
CMS are especially adapted to the maintenance of complicated mechanical systems, which are difficult to maintain by human labour or which are located in remote areas hardly accessible by technicians. Wind turbines are typical examples of such systems and CMS have achieved tremendous success in their maintenance[1,2].
The diagnosis in a CMS is based on the analysis of relevant signals acquired from the monitored mechanical system. In general, the CMS can be categorised into two types. The first is system-driven and depends on health indicators defined on the monitored kinematics components[3,4]. Therefore, the configuration of the
CMS is a delicate and labour-demanding task, which considerably affects the accuracy of the diagnosis. Moreover, every time a part of the monitored system is changed, the CMS has to be reconfigured.
The second type, namely the data-driven CMS, avoids these drawbacks by automatically deducing indicators from the signals without a priori knowledge of the monitored system. Therefore, the complexity of the system configuration is reduced to a minimum. AStrion is designed to be the core vibration analysis component of a data-driven CMS. Another companion three-phase electrical signature analysis system[11] can run in parallel to automatically
detect electrical faults.
AStrion is a spectrum analyser able to automatically detect and track relevant fault features thanks to the richness of the information extracted from the spectrum of the vibration signal. Instead of being configured by experts, the configuration of AStrion is achieved either by automatic data validation or by decision-making algorithms of the method itself. The spectrum investigation, the feature calculation, the kinematic association and the time-tracking of the features are automatically accomplished tasks. This makes AStrion perfectly suitable to be embedded in a wind turbine CMS,
since it is fully functional without any intervention by the user. Another key interest of AStrion is its capability to extract a high quantity of information from the spectrum. Not only focused on the amplitude variation on some particular kinematic frequencies, the spectrum inspection is performed over the entire frequency span. All the harmonic series and side-band series are investigated in an exhaustive way independent of the system kinematics and it is therefore advantageous in the inspection of complex mechanical systems and highly adaptive to a change of the kinematic configuration of the system. The features deduced from the harmonic series and the demodulation of the side-band series are highly reliable and indicative of the faults, which helps to detect faults at an early stage.
The diagnosis of faults requires the continuous acquisition of the vibration signals and the time tracking of the specific fault features of the signals at different time stamps. In the AStrion methods, some prior works[5,6,8] focused mainly on the analysis of
a single signal, while others focused on the time-tracking of the features[7]. In this paper, we will summarise the methodologies of
the entire AStrion architecture, including both types of method. Through the demonstration of results and applications, we will only focus on the time-tracking of the features and the continuous-time surveillance.
AUTOMATED CM
of AStrion are briefly presented in Section 2. In Section 3, the results on real-world signals are presented to demonstrate the validity of AStrion. Conclusions are drawn in Section 4.
2. AStrion methodologies
The AStrion methodologies consist of a set of modules of two types. The first type processes an individual vibration signal and deduces scalar features as the description of the signal. The second type is a time-tracking module, which serves to automatically connect the sets of scalar features calculated at each time instant.
2.1 Single-signal processing modules
Given the nth vibration signal sn in vector form:
sn= sn⎡⎣ ⎤⎦,s1 n⎡⎣ ⎤⎦,…,s2 n⎡⎣ ⎤⎦,…,sk n N s ⎡⎣ ⎤⎦
⎡⎣ ⎤⎦ ... (1) where k is the sample index and Ns represents the number of samples of each signal, to deal with the non-stationarity issue, the signal is firstly transposed into the order domain by an angular resampling module called AStrion-A (A for Angular resampling)[9]
according to the availability of the phase marker measurement. In the resampled signal, the non-stationarity caused by the variation of the rotational speed can be reduced, since the sampling is adjusted to the angular position of the rotating part.
In the following step, either on the original time domain signal or on the resampled order domain signal, a data-validation module called AStrion-D (D for Data validation) performs a pre-analysis of the signal to reveal the essential properties, such as the acquisition validity, the periodicity, the non-stationarity and the noise level.
The next step is AStrion-I (I for peak Identification), which finds the peaks in the spectral domain[5]. Due to the complexity of the
real-world signals, the spectral content related to the underlying signal is distinguished from the noise spectrum using a statistical test based on the properties of the spectrum estimator. The detected peaks are then classified to interpret the underlying characteristics, such as noise, sine waves, narrowband signals, etc. The entire procedure is called a ‘cycle’. Since the definition of a perfect spectral estimator in terms of performance is impossible, a ‘multi-cycle’ strategy is proposed to apply a spectral analysis procedure with two or five different spectral estimators to take advantage of their different strengths. The spectral estimators and their parameters are chosen according to the prior data validation step.
After all the cycles, a fusion operation merges the results in the different cycles and creates a unique ‘spectral identity card’ for each detected spectral peak, containing properties such as the amplitude, ai, the frequency, vin, and the associated uncertainty, ε
i
n. i is the
index of the peak and i ≤ Np n, with N
p
n the total number of peaks
detected in the signal sn.
The next module, called AStrion-H, searches the harmonic series and side-band series in the list of detected peaks[6]. Due to
the uncertainty about the exact peak frequency, the search for harmonics is made by interval intersection. Therefore, a peak j is considered as the rth harmonic of another peak i if the following interval intersection is not empty:
vnj−εnj 2;vnj+ εhj 2 ⎡ ⎣ ⎢ ⎢ ⎤ ⎦ ⎥ ⎥ r vi n+εin 2 ⎛ ⎝⎜ ⎞ ⎠⎟;r vin+ εin 2 ⎛ ⎝⎜ ⎞ ⎠⎟ ⎡ ⎣ ⎢ ⎢ ⎤ ⎦ ⎥ ⎥≠ /0
Each detected harmonic series has an identity card, denoted as: Hjn=
{
vnj,εnj, Enj}
j∈ 1,NH n ⎡
⎣ ⎤⎦ ... (2)
where vnj is the fundamental frequency, εnj is the uncertainty
interval around vjn, Ejn is the energy of the series and NHn is the
total number of harmonic series detected in the signal sn.
The side-band series, whose carrier frequency belongs to at least one harmonic series, can be found using a similar interval intersection method. A specific identity card is also defined for each side-band series identified:
Mjn= v j n,Δ j n,ε j n
{
}
j∈ 1,N⎡⎣ Mn⎤⎦ ... (3)where vjn is the carrier frequency, Δ j
n is the modulation frequency,
εnj is the uncertainty about Δ j n and N
M
n is the total number of
side-band series detected in signal sn.
In the next module, AStrion-K (K for Kinematics)[8], the
harmonic series and side-band series are associated with the characteristic frequencies (or orders) of the monitored system. The concerned system kinematics, including the gear mesh frequency (GMF), the ball pass frequency of the inner ring (BPFI) and the ball pass frequency of the outer ring (BPFO), the fundamental train frequency (FTF) and the double ball spin frequency (BSF2), are configured using the kinematic geometry. The kinematic association is carried out over the frequency of each harmonic order and side-band order in all the harmonic and side-band series. The module is optional and is skipped if the kinematic information is absent. The following analysis and tracking will concern both the associated and non-associated series.
The detected side-bands are then demodulated to calculate the modulation functions in a module called AStrion-M (M for side-band deModulation)[8]. With the demodulation band defined
by the prior AStrion-H module, the signal is filtered around each side-band range to keep a single modulated component. Then, an averaged signal is calculated from the filtered signal using time synchronous averaging. Based on this averaged signal, the amplitude and the frequency modulation functions are calculated using the Hilbert transform. Eight features are added to the identity card of each side-band series: the average value, the peak-to-peak magnitude, the modulation index and the kurtosis of the amplitude and frequency modulation functions, respectively.
2.2 Time-tracking and surveillance module
Finally, the harmonic series and the side-band series obtained from all the signals {sn} are tracked in time by a module called AStrion-S
(S for Surveillance)[7]. The tracking of the harmonic series takes into
account the fundamental frequency: if the fundamental frequencies of two harmonic series obtained at two consecutive time instants, n and n + 1, fall into a small frequency/order neighbourhood, they are tracked in time and considered as the evolution of one harmonic series. The peaks inside the series are automatically tracked according to their rank in the series. Note that if the harmonic series or the side-band series tracked disappears between instants n1 and n2, the trajectory will be considered as hibernating during the time interval [n1, n2].
The tracking of the side-band series is performed in a similar way; however, two parameters should be taken into account: the carrier frequency and the modulation frequency. Since the carrier frequencies can be tracked a priori during the tracking of the harmonic series, the peaks of the modulation series, which have the same carrier frequency, can be tracked automatically according to the modulation frequencies.
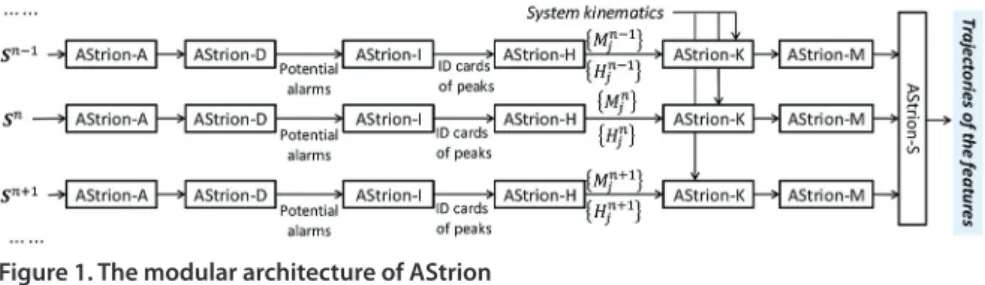
The architecture of the AStrion software is summarised in Figure 1.
In AStrion, the algorithms of each module are either configured by the module itself, such as AStrion-A, AStrion-D and AStrion-S,
or by the output of the prior modules, such as AStrion-I and AStrion-M. In the case of abnormalities of the acquired signal, for example the variable shaft speed, the software is able to make the signal stationary by converting it in the angle domain. If the signal is inappropriate for the spectrum analysis, AStrion-D will alert the following modules so that the signal can be discarded. Even if a signal is abandoned, AStrion-S is still able to label it as a ‘sleep’ state and proceed the trajectory tracking in the correct way.
3. Application on real-world signals
In this section, we focus on the application of the entire AStrion software on real-world signals to demonstrate its ability in fault diagnosis. Two sets of signals are considered. The first came from a test-rig, where a degradation test was designed to produce a mechanical fault of a desired type on a desired mechanical component. This example aims to validate the proposed algorithms on a stationary operational condition. The second set of signals was acquired from a wind turbine, where the presence of mechanical faults was unknown. This application demonstrates the applicability of AStrion in real-world situations, where the operating condition is variable and unknown.
3.1 Application on the test-rig signals
The test-rig is an experimental platform designed on behalf of the KAStrion project and installed in CETIM. It is dedicated to simulating the deterioration of a wind turbine drivetrain. The system was designed on a smaller scale (10 kW) and is driven by a motor instead of wind blades. A geared motor generates the main shaft rotation (around 20 r/min). A multiplier increases the rotational speed with a ratio of 100:1, so that the generator operates at around 2000 r/min. As shown in Figure 2, accelerometers and phase markers allow for the exhaustive monitoring of the rig components, such as the main bearing and the gearbox.
In this paper, we focus on the fault detection of the main bearing by the accelerometer of the (+y) direction. 19 signals were extracted during 190 h of operation (from 10.62 h to 189.85 h), when the main bearing was highly deteriorated in order to totally stop the normal operation in the end. The bearing was finally disassembled and the flaking was found to be distributed on the entire inner ring. Each vibration signal was measured during 150 s, sampled at 39,062.5 Hz under a constant rotational speed and load.
AStrion was applied to the 19 signals with all the modules except the angular resampling, since the rotational speed was known to be constant. Among these signals, the 14th signal, at 163.11 h of operation, was corrupted due to the existence of a spike of 1010
times the average amplitude[9]. The first two signals, captured at
44.46 h and 69.84 h of operation, were confirmed to be invalid since the sensor was disconnected. The other 16 signals were correctly acquired. Figure 3 shows the number of peaks, harmonic series and side-band series detected on the 19 signals.
Without the need for any pre-configuration, AStrion detected only 899 peaks in the invalid 14th signal, while about 51,000 to 61,000 peaks were detected in the other 16 signals. The significant drop of the number indicates the abnormality of the 14th signal. Note that prior to the peak detection, the abnormality can be clearly detected in the data validation module using the non-stationarity rate[9]. The number of peaks detected on the first two invalid signals
is almost the same as the valid signals, but there are almost no harmonic series and side-bands, since there was only noise and a few high-frequency resonances. Therefore, they had no influence in the feature tracking. In real-world applications, the sensor disconnection cannot be reported by technicians in real time, while AStrion wisely treated them as null acquisitions without any spectral information. They could also be detected during the data validation step by their very low signal-to-noise ratios.
Based on the valid signals, the harmonic series associated with the BPFI of the main bearing is of special interest, since the disassembly of the main bearing confirmed that the fault was a wide-spread flaking on the inner ring[10]. AStrion successfully
detected the harmonic series associated with the bearing BPFI. Figure 4 shows two features calculated from the detected harmonic series.
In Figure 4, a harmonic series has been detected since 129.2 h. While the damage was getting stronger, the number of harmonics increased and the fundamental frequency slightly decreased. The
Figure 1. The modular architecture of AStrion
Figure 2. The test-rig. The main bearing is marked by an orange ellipsis and the three accelerometer directions are symbolised by the green arrows
Figure 3. Results of the detection of peaks, harmonic series and side-band series on the 19 signals of accelerometer (+y), mounted on the main bearing of the test-rig from 10.62 to 189.85 operating hours: (a) number of peaks detected; and (b) number of harmonic and side-band series detected
AUTOMATED CM
empty area inside the curve corresponds to the faulty measurement that the time-tracking algorithm automatically skipped and labelled as a sleep state. In[7], the authors demonstrated that the
same fault could also be detected by the energy of the harmonic series. Moreover, since the fault produced a modulation at the shaft rotation frequency, the existence of the side-band series with the carrier is equal to the BPFI (3.45 Hz), while the modulation frequency is equal to the shaft speed (0.333 Hz) and is a direct indicator of the fault. AStrion was not only able to detect such band series but was also able to demodulate it to compute the side-band features, as shown in Figure 5.
The time axis of Figure 5 is zoomed around the time instants where the fault can be found. The fault-related side-band series was detected at the same time (129.2 operating hours) as the appearance of the harmonic series of the BPFI of the rolling element bearing. The detection by AStrion is five hours earlier than using the narrowband root mean square (RMS), detected from 134 h[10]. Note
that these trends help to track the severity of the distribution of the fault since the rise of the average amplitude indicates the increasing energy of the fault-related side-band. Other side-band features calculated in AStrion[8] can reveal the same fault.
The fault detection was achieved by exploring the entire frequency band. Instead of only focusing on a preset characteristic fault frequency as many system-driven methods do, AStrion looks for fault indicators by itself. It is capable of detecting other types of fault of other mechanical parts in the same way.
3.2 Application on the Valorem wind turbine
signals
In this section, the application of AStrion on the vibration signals of a real-world wind turbine in the context of the KAStrion project is presented. The signals, provided courtesy of Valorem, France, were captured by the same type of accelerometers mounted on the same wind turbine, as shown in Figure 6.
The signals are of 10 s, sampled at 25,000 Hz, captured from 20 December 2014 to 7 January 2015 with the shaft rotating at 1600 r/min to 1800 r/min, as shown in Figure 7.
35 signals were selected on accelerometer A5 while 77 signals were selected on accelerometer A6. To deal with the varying rotational speed in the suveillance, the angular resampling was carried out on all signals before calculating the spectra. As a result, the resampled signals had significantly lower non-stationarity than the non-resampled ones[9] and the number of peaks detected
from the spectra of the resampled signals was always higher than 1600, as shown in Figure 8. These peaks gave birth to 22 harmonic trajectories on the signals of A5 and 35 harmonic trajectories on the signals of A6, which were automatically identified, tracked and associated with the kinematic information. Among all the harmonic series, the one of order 1 was directly associated with the rotation of
Figure 6. (a) The geographical location of the wind turbine WT6 and (b) the accelerometers A5 and A6 installed, respectively, at the front and the rear end of the generator
Figure 7. Evolution of the mean rotational speed: (a) accelerometer A5; (b) accelerometer A6
Figure 5. Evolution of the shaft speed (0.333 Hz) modulations around the BPFI (3.45 Hz) carrier frequency: (a) average of the amplitude modulation function; (b) average of the frequency modulation function
Figure 4. Evolution of (a) the number of peaks and (b) the fundamental frequency of the harmonic series representing the BPFI of the test-rig main bearing
the shaft, as shown in Figure 9.
The harmonic series were tracked from the 6th signal and the 10th signal, respectively, to the end on A5 and A6. Considering the variation of the rotational speed and environmental conditions, the identification and the tracking of the harmonic series are very robust. The robustness is an essential concern for long-term surveillance, because the CMS has to assure the continuous detection and monitoring of the kinematic frequencies to avoid missing the fault features, which can appear at any time.
Note that no side-bands related to any faults were found on each accelerometer and therefore no alarms were raised. Meanwhile, wind turbine experts have confirmed that the monitored mechanical component was working under normal operational conditions without defect. The absence of false alarms in this case shows the good reliability of AStrion.
3.3 Application on the signals of an
anonymous wind turbine
We hereby present another application of AStrion on 54 vibration signals acquired over 11 months on the gearbox of an anonymous wind turbine. The signals are all transformed in the angle domain by AStrion-A and each of them is of about 300 revolutions (300,000 points) with a rotational speed of 1500 r/min. A fault in the gearbox was confirmed later and the gearbox was replaced one month after the acquisition of the 54th signal. Figure 10 presents the fault diagnosis result of AStrion and the narrowband RMS.
In AStrion, the gearbox fault was clearly indicated by a significant increase of the frequency modulation index from the 39th signal, while the widely-used narrowband RMS is not indicative of the fault at all. Moreover, in AStrion, the same fault can be clearly seen and, also from the non-stationary rate, the number of fault-related side-bands and their energy. They are not illustrated due to the limited number of pages.
4. Conclusions
In this paper, we introduced AStrion, an automatic spectrum analyser dedicated to a wind turbine CMS. The algorithms and the function modules of AStrion are recalled. The application on signals from a test-rig validates the ability of AStrion to detect a bearing fault thanks to its automatic spectral analysis algorithms. The results on real-world wind turbine signals demonstrate the reliability and the robustness in long-term and continuous surveillance tasks.
AStrion is data-driven and independent of any a priori assumption about the nature of the signal. The exhaustive exploration of the spectral content ensures the capability of detecting a large variety of faults without manual inspection. It is a valuable feature for a long-term automatic surveillance. Secondly, thanks to the robust and reliable spectrum analysis modules in AStrion, the fault indicators are calculated using the properties of the methods themselves instead of manually chosen thresholds. Its first benefit is to liberate the users from the delicate and time-consuming task of pre-configuration. The second benefit is the
Figure 10. Diagnosis of the anonymous wind turbine gearbox: (a) frequency modulation index obtained in AStrion by demodulating the side-band series around the second harmonic of GMF modulated by shaft speed; and (b) narrowband RMS computed with a bandwidth of three side-bands on both sides of the carrier frequency
Figure 8. Evolution of the number of detected peaks for both accelerometers: (a) accelerometer A5; (b) accelerometer A6
Figure 9. Evolution of the number of peaks in the harmonic series associated with the shaft speed: (a) accelerometer A5; (b) accelerometer A6
AUTOMATED CM
adaptability. In the presented results, signals from totally different sensors, or even different mechanical systems, were all processed by the same software without any reconfiguration. In practice, AStrion can be applied on an arbitrary vibration sensor.
In future work, the alarm-raising mechanism of some common fault types will be proposed and the false alarm rates will be evaluated as an index of reliability or confidence. Secondly, AStrion has to process a lot of peaks when the signals contain a large number of samples, while it has to face the accuracy degradation of the spectral analysis of short signals. In terms of computation efficiency, the algorithm will continue to be optimised in order to fit the processing of both short signals and very long signals.
Acknowledgements
The authors would like express their sincere appreciation to CETIM for sharing the data of the test-rig, and to VALEMO and EC-Systems for providing the signals of the real-world wind turbines.
This research is part of the KAStrion project (http://www. gipsa-lab.fr/projet/KASTRION/), which has been supported by KIC InnoEnergy. KIC InnoEnergy is a company supported by the European Institute of Innovation and Technology (EIT) and has the mission of delivering commercial products and services, new businesses, innovators and entrepreneurs in the field of sustainable energy through the integration of higher education, research, entrepreneurs and business companies.
This work has been supported by the French Research National Agency (ANR) through the EITE programme (project KAStrion ANR-12-EITE-0002-01).
References
1. B Lu, Y Li, X Wu and Z Yang, ‘A review of recent advances in wind turbine condition monitoring and fault diagnosis’, Power Electronics and Machines in Wind Applications 2009, PEMWA 2009, IEEE, 2009.
2. P F G Márquez, A M Tobias, M J P Pérez and M Papaelias, ‘Condition monitoring of wind turbines: techniques and methods’, Renewable Energy, Vol 46, pp 169-178, 2012. 3. X Gong and W Qiao, ‘Bearing fault diagnosis for
direct-drive wind turbines via current demodulated signals’, IEEE Transactions on Industrial Electronics, Vol 60, No 8, pp 3419-3428, 2013.
4. D He, R Li and J Zhu, ‘Plastic bearing fault diagnosis based on a two-step data mining approach’, IEEE Transactions on Industrial Electronics, Vol 60, No 8, pp 3429-3440, 2013. 5. C Mailhes, N Martin, K Sahli and G Lejeune, ‘Condition
monitoring using automatic spectral analysis’, In: Structural Health Monitoring, Spain, 2006.
6. T Gerber, N Martin and C Mailhes, ‘Identification of harmonics and side-bands in a finite set of spectral components’, In: CM2013/MFPT2013, Kraków, Poland, 2013.
7. T Gerber, N Martin and C Mailhes, ‘Monitoring based on time-frequency tracking of estimated harmonic series and modulation side-bands’, In: 4th International Conference on Condition Monitoring of Machinery in Non-Stationary Operations (CMMNO 2014), Lyon, France, 2014, 10 p. 8. M Firla, Z-Y Li, N Martin and T Barszcz, ‘Automatic and
full-band demodulation for fault detection. Validation on a wind turbine test-rig’, In: 4th International Conference on Condition Monitoring of Machinery in Non-Stationary Operations (CMMNO 2014), Lyon, France, 2014.
9. G Song, Z-Y Li, P Bellemain, N Martin and C Mailhes, ‘AStrion data validation of non-stationary wind turbine signals’, In:
CM2015/MFPT2015, Oxford, UK, 2015.
10. N Bédouin and S Sieg-Zieba, ‘Endurance testing on a wind turbine test-rig: a focus on slow rotating bearing monitoring’, In: CM2015/MFPT2015, Oxford, UK, 2015.
11. G Cablea, P Granjon, C Bérenguer and P Bellemain, ‘Online condition monitoring of wind turbines through three-phase electrical signature analysis’, In: CM2015/MFPT2015, Oxford, UK, 2015.