HAL Id: hal-01021602
https://hal-enac.archives-ouvertes.fr/hal-01021602
Submitted on 22 Jul 2014
HAL is a multi-disciplinary open access
archive for the deposit and dissemination of
sci-entific research documents, whether they are
pub-lished or not. The documents may come from
teaching and research institutions in France or
abroad, or from public or private research centers.
L’archive ouverte pluridisciplinaire HAL, est
destinée au dépôt et à la diffusion de documents
scientifiques de niveau recherche, publiés ou non,
émanant des établissements d’enseignement et de
recherche français ou étrangers, des laboratoires
publics ou privés.
Visual scanning as a reference framework for interactive
representation design
Stéphane Conversy, Stéphane Chatty, Christophe Hurter
To cite this version:
Stéphane Conversy, Stéphane Chatty, Christophe Hurter. Visual scanning as a reference framework
for interactive representation design. Information Visualization, SAGE Publications, 2011, 10 (3), p.
196-211,. �10.1177/1473871611415988�. �hal-01021602�
Visual scanning as a reference framework for interactive
representation design
Stéphane Conversy
Université de Toulouse ENAC & IRIT Toulouse, France +33 5 62 17 40 19
[email protected]
Stéphane Chatty
Université de Toulouse ENAC Toulouse, France +33 5 62 17 42 21[email protected]
Christophe Hurter
Université de Toulouse DGAC R/D & ENAC & IRITToulouse, France +33 5 62 25 95 76
[email protected]
ABSTRACT
When designing a representation, the designer implicitly formulates a sequence of visual tasks required to understand and use the representation effectively. This paper aims at making the sequence of visual tasks explicit, in order to help designers elicit their design choices. In particular, we present a set of concepts to systematically analyze what a user must theoretically do to decipher representations. The analysis consists in a decomposition of the activity of scanning into elementary visualization operations. We show how the analysis applies to various existing representations, and how expected benefits can be expressed in terms of elementary operations. The set of elementary operations form the basis of a shared language for representation designers. The decomposition highlights the challenges encountered by a user when deciphering a representation, and helps designers to exhibit possible flaws in their design, justify their choices, and compare designs. We also show that interaction with a representation can be considered as facilitation to perform the elementary operations.
Categories and Subject Descriptors
H.5.2 User Interfaces – Evaluation/methodology, Screen design.
General Terms
Design, Human Factors.
Keywords
Visualization, Infovis, Design Rationale, Visual design, Interaction.
1. INTRODUCTION
Designing representation is often considered to be a craft. The design activity requires multiple iterations that mix ad-hoc testing, discussions with users, controlled experiments, and personal preferences. These ways of designing are either costly (controlled experiment), error-prone (ad-hoc testing) or lead to non-optimal results (personal preference). Though a number of theoretical works help to explain the strengths or weaknesses of a representation,1-7 no systematic method exists that would help designers to assess their design in an a priori manner, i.e., before user experiments. As suggested in 8, such a method would help not only for formative purposes, but also as a summative evaluation before actual user experiments.
When designing a representation, a designer implicitly formulates a way to understand and use the representation effectively. For example, reading a city map requires scanning
it, finding noteworthy locations (metro stations, connections...), devising a path to go from one point to another, etc.9 For a user, except for very specialized graphics and narrow tasks, figuring out a representation is like interacting using the eyes only: a user has to figure out a solution to his task at hand by scanning the picture, seeking graphics, memorizing things, etc. The succession of these small visualization operations induces a cost that deserves to be evaluated before acceptance of a final design. We suggest that most design decisions can be explained by the willingness of the designer to reduce the cost of deciphering the representation. However, there is no common core of concepts that allows designers to precisely express the rationale behind a design decision. This hinders the design process because it makes it hard for designers to explain to users and stakeholders why a representation is suitable for their tasks (justification), and how a new prototype is better than a previous one (comparison). Furthermore, they cannot justify their choices in a design rationale document, which makes the decisions susceptible to disappearance in future evolutions of the system.
This paper presents a set of concepts for analyzing how a user deciphers a representation. It relies on and extends previous works about visual scanning and design elicitation. The goal of the paper is not to show better designs for a particular problem. Rather, the goal of the paper is to present an analysis that exhibits the steps required to figure out a particular representation, and helps justify design choices and compare representations.
2. RELATED WORK
We based our work on previous studies that can be roughly divided into three groups. The first group concerns eye gaze, representation scanning, and models of visual perception; the second concerns visual task taxonomies; and the third concerns design formulation.
2.1 Eye gaze, scanning, visual perception
Eye tracking enables researchers to analyze what users look at when solving a problem. However, a large part of the literature is devoted to how to process tracking data in order to analyze it.10-12 Furthermore, the state of the art in this field still experiments with very low-level designs and abstract graphics,13,9 far from the richness of today’s visualizations. A number of findings are interesting and may help the design of representations, but they are hard to generalize and use in a prescriptive way.14
The ACT-R model aims at providing tools that simulate human perception and reasoning.23 However, the tool is not targeted towards designers, as its purpose is to model human behavior so as to anticipate real-world usage. It does not take into account some arrangements such as ordered or quantitative layout, nor does it support a description of how a representation is supposed to be used. ACT-R has tentatively been used to carry out autonomous navigation of graphical interface, together with the SegMan perception/action substrate.15 However the interfaces
used as testbeds are targeted toward WIMP applications, which do not exhibit high-level properties available in rich visualization.
UCIE (Understanding Cognitive Information Engineering) is an implemented model of the processes people use to decode information from graphics.16 Though targeted on graph visualization, UCIE relies on perceptual and cognitive elementary tasks similar to the ones presented here. Given a scene, UCIE can compute a scan path, and an estimation of the time needed to get information (with mixed results). However, this work is more targeted at showing the effectiveness of the predictive model than describing the tasks with enough details to enable designers to analyze their own design and justify it. Furthermore, the tasks do not include operations such as
entering and exiting, or following a path, and their description
lack considerations on interaction.
The semiology of graphics is a theory of abstract graphical representation such as maps or bar charts.4 It describes and explains the perceptual phenomenon and properties underlying the act of reading abstract graphics. In his book, Bertin defines three levels of reading a representation: the elementary level, which enables the reader to “unpack” visual variables of a single mark, the middle level, which enables the reader to perceive a size-limited pattern or regularity, and the global level, which enables the reader to grasp the representation as a whole, and see at a glance emergent visual information. Bertin (4 p148) pointed out the problem of scanning in what he terms “figuration” (i.e., bad representation). He briefly depicts how the eye scans a graphic. During scanning, the eye jumps from one mark to the next, while experiencing perturbation by other marks. The eye then focuses on particular marks to gather visual information.
2.2 Visual task taxonomies
Casner designed BOZ, a tool that automatically generates an appropriate visualization for a particular task.17 BOZ takes as
input a description of the task to support and relies on a set of inference rules to generate a visualization that maximizes the use of the human perceptual system. In the following, we use the set of perceptual operators embedded in BOZ, such as “search (an object with a given graphical property)”, “lookup (a property given an object)”, and “verify (given a property and an object, that this object has the property)”.
Zhou and Feiner designed IMPROVISE, another automatic tool to design representations.18 Zhou and Feiner have refined the visual analysis into multiple levels: visual intents, visual tasks, and visual techniques. Visual tasks include emphasize, reveal,
correlate, etc. A visual task may accomplish a set of visual
intents, such as search, verify, sum or differentiate. In turn, a visual intent can be accomplished by a set of visual tasks. A visual task implies a set of visual techniques, such as spatial proximity, visual structure (tables, networks), use of color, etc.
2.3 Design formulation
The GOMS Keystroke-Level Model (KLM) helps to compute the time needed to perform an interaction.19 The Complexity of
Interaction Sequences (CIS) model takes into account the context in which the interaction takes place.20 Both KLM and
CIS are based on descriptive models of interaction, which decompose it into elementary operations. They are also predictive models, i.e., they can help compute a measurement of expected effectiveness and enable quantitative comparisons between interaction techniques. These tools have proved to be accurate and efficient when designing new interfaces.19,20 We relate our work to KLM in the section where we discuss the relationships between visual scanning and interaction.
The speech acts theory,21 originally aimed at analyzing the human discourse, was extended for describing the user's multimodal interaction with a computing system.22 It provides a successful example of using a model that captures the essence of an interaction modality (speech) and extending it to describe combinations of this modality and others (such as gestures). Our approach to the combination of visualization and interaction can be compared to this.
Green identified cognitive dimensions of notation, which help designers share a common language when discussing design.23 The dimensions help make explicit what a notation is supposed to improve, or fail to support. Cognitive dimensions are based on activities typical of the use of interactive systems such as
incrementation or transcription. However, they are high-level
descriptions and do not detail visualization tasks. Our work has the same means and goals (description and production of a shared language) as cognitive dimensions, but specialized to visualization.
3. IDEALIZED SCANNING OF
REPRESENTATION
As previously stated, when designing a representation, a designer implicitly formulates a method required to understand and use the representation effectively. The work presented here is an analysis of this method that provides a way to make it explicit.
When trying to solve a problem using a representation, a user completes a visualization task by performing a set of visual and memory operations. A visualization task can be decomposed into a sequence of steps pertaining to the problem at hand (e.g., “find a bus line”). Each step requires that a sequence of elementary visualization operations be accomplished. Operations include memorizing information, entering and
exiting from the representation, seeking a subset of marks, unpacking a mark and verifying a predicate, and seeking and navigating among a subset of marks. As we will see below,
operations are facilitated by the use of (possibly) adequate visual cues, such as Bertin’s selection with color, size or alignment.4 In
terms of the model proposed in 8, we target the
encoding/interaction technique design box.
In the following, we analyze idealized scanning of representations. We use “idealized” in the sense that the user knows exactly what she is looking for, knows how to use the representation so as to step through with the minimum necessary steps, and uses only the available information in the representation otherwise stated. Thus, we do not take into account other phenomena such as learning, understanding, error,
chance, or personal perceptual disabilities (like color blindness). This is similar to the approach taken with the KLM: when applying a decomposition, the designer analyzes an idealized interaction.
In fact, the model enables either comparing multiple scanning strategies for a given task and a given representation, or comparing multiple representations for a given task and the most efficient scanning. In the following, we focus on representation comparison, and we assume that we have found the most efficient scanning for each representation. The next section uses an example to illustrate how to perform an analysis of representation scanning. Based on this, we further detail the steps and operations required, and what factors affect users’ efficiency at achieving them.
4. A FIRST GLIMPSE: A TABULAR BUS
SCHEDULE REPRESENTATION
There is no such thing as an absolutely effective representation; to be effective, a representation must minimize the amount of work required to fulfill a task. 17 In the following example, the problem to be solved by a user is to answer the following question: “I am at the IUT Rangueil station and it is 14:18. How
long will I have to wait for the next bus to the Université Paul Sabatier station?” The user knows that two bus lines go to the
destination (#68 and #108). Figure 1 is an excerpt of a typical representation of a bus schedule. The display is a physical panel at the station booth, on which lay paper sheets, each with a table for one bus line that displays the time of departure from each station.
Figure 1. A bus schedule representation with the required steps to find particular information
The drawings overlaid on the representation show the idealized visualization tasks a user must perform when trying to answer the question. A circle depicts an eye reading, an arrow an eye
movement. Memory operations are depicted with a blue “M”. The step numbers are in the form x.y.z, which means that step y is the yth sub-step of step x, and step z, the zth sub-step of step y. A check mark depicts the last operation of a substep, together with a green circle. Figure 1 also shows two different scanning strategies to answer two instances of an intermediate question (“when is the next bus for line 68 (resp. 108)?”).
Step 0: the user should memorize the two compatible bus line numbers and the current time.
Step 1.x: the user should find an appropriate bus line. The number of the line is represented in large, boldface text at the top-right corner of each paper sheet.
Step 1.2.1: the user should find his current location (“IUT Rangueil”) among the list of stations. The list is a subset of marks of kind “text”, aligned vertically, with no marks in-between. The stations are ordered according to their location along the bus line.
Step 1.2.1.x: the user must find the next departure time. He has to navigate through a row of texts that displays hour and minute for each bus departure. As the X dimension is multiplexed (or “folded on”) Y, the user may not find a compatible time in the first row examined: in this case he has to start Step 1.2 over by moving to the next row (Step 1.2.2). Finally, the user finds the next departure when he identifies the first departure that is later than the current time.
Step 1.3.3.2: the user finds that this row does not contain relevant information, so he performs a back step to the previous row. This requires memorization of a previous mark position. Step 1.2.2.x, 1.3.2.x, green circle: the user finds a compatible bus in each line and thus has to perform mental computation (a difference between two times) to find the duration before the next bus, and memorize it to compare with previous or following findings.
5. ELEMENTARY OPERATIONS
This section details the various elementary operations required to implement the steps. In defining the operations, we based our analysis on existing literature when available, supplemented by interviews with visualization designers. For each operation, we detail it, and give elements that aid or hinder operation achievement. We also compare our operations to the BOZ and IMPROVISE taxonomies, and explain the differences, mainly in terms of elements that may aid or hinder the operation.
5.1 Memorizing information
To solve problems, users have to know what information to seek. They have to memorize this information, so as to compare it to the information that arises from the representation. As we will see in the examples, different representations require different numbers of memory “cells”. For example, in the tabular bus scheduling view, users need three cells of information at the beginning (current time, 68 and 108), two cells for intermediary results, and one cell for a previous location. Memory requirements are often overlooked when comparing visualizations: the more cells required, the harder it becomes to solve a problem. Memory fades with time, so for long scanning tasks users may have forgotten important information before the end of the scanning. Forgotten information that is available on the representation can be compensated for by additional seeking operations, or by adding
the equivalent of a selectable visual property (e.g., a hand-written mark, or a pointing finger).
5.2 Entering and exiting representation
A representation is rarely used in isolation. Users are surrounded by different representation from various systems. For example, Air Traffic controllers employ radar views, various lists of flights, paper strips, etc. When they solve a problem, users may have to switch representations. This may require translating the input of a representation into the visual language of another representation and translating the information found back into the problem.
In the bus schedule example, users may have to translate the representation of a time seen on a watch into numbers in the form hh:mm so as to comply with the ordered-by-time menu-like vertical representation (entering). They also have to get the correct bus line somewhere (i.e. a map representing the public transportation network), and translate the information (a textual number or a color) into the visual language of the representation (entering). The information to find is the waiting time for the next bus. The tabular representation does not give this information directly, and thus requires a mental computation (exiting). In the city map example, translating map direction to real-world direction and recognizing street layout is easier if the map is oriented to the terrain (i.e., north of map matching the actual north direction). Taking into account this step is important when a switch of representation does not require translation, since this makes the second representation easier to understand.
5.3 Seeking a subset of marks
When users search for bus line information, they have to search for a subset of the marks in the representation. In order to find the correct line, the user has to navigate from line number to line number.
Perceiving a subset is made easier with selective (in the sense of the semiology of graphics4) visual variables: marks can be extracted from the soup of all marks at one glance, which narrows down the number of marks to consider. For example, the number of the bus line is represented in text, with a large font size and boldface, placed at the top-right corner of the sheet. The size and position of bus line number make the marks
selectable. Furthermore, when elements in a subset are close
enough together, no other in-between element perturbs the navigation from mark to mark. The list is even easier to navigate in, since the marks are aligned horizontally and vertically (or in other words, marks differ by only one dimension (X or Y)). Conversely, perceiving a subset can be harder in presence of similar marks that do not belong to the considered subset. In the tabular schedule example, all time information has similar visual properties except for the start time of each bus, which is set in bold. If the start time were set in regular, it would be harder to find at a glance. Seeking a subset corresponds to the
search-object-* perceptual operator in BOZ. 17
5.4 Unpacking a mark and verifying a
predicate
When the user sees a candidate mark, she has to assess it against a predicate. In the tabular bus schedule example, the user has to find a line number that matches one of the correct buses. Assessing a predicate may require extracting (or unpacking4) visual dimensions from a mark. This is what Bertin calls
“elementary reading”.4 This operation also corresponds to the
lookup-* and computation perceptual operator class in BOZ. 17
However, assessing a predicate may also require cognitive comparison to memorized information (is the bus number I’m
looking at one of the memorized ones?), or visual comparison
with another mark (example in the following). In BOZ the difficulty of accomplishing the operation depends on the visual variable used, but not on other considerations such as memory or visual comparison.
5.5 Seeking and navigating among a subset
of marks
Within an identified subset, a user may search for a particular mark. If marks are displayed in random positions, finding a mark requires a linear, one-by-one scanning of marks, with a predicate verification for each. The time needed is O(n). If marks are ordered (as in the ordered-by-time schedule), a user can benefit from this regularity to speed up navigation, for example by using a binary search approach, which leads to a time needed of O(log(n)). If marks are displayed at quantitative positions, we can hope to achieve O(1). However, this may require secondary marks such as a scale ticks and legends. In this case, scanning is split into two phases: navigating into the scale first, then into primary marks.
Navigating inside a list of texts is equivalent to reading a menu, for which performance may be predicted quite accurately.24 However, some graphical elements may hinder navigation. For example, navigating in a row surrounded by other rows, as in a table, is difficult. This is the equivalent of a visual steering task:
25
it requires that the eye be able to stay in a tunnel. Some representations are supposed to aid this (e.g., think of a spread sheet where every other row is colored). Performance depends on the width and the length of the tunnel. Navigating inside a vertical list of text is easier than navigating in a horizontal one, since a horizontal row is as narrow as the height of a glyph. Furthermore, in particular cases, navigating may require a step
back to a previous mark, which in turn requires memorizing a
previous location (see step 1.3.2.x in Figure 1).
No BOZ perceptual operator corresponds to this operation. IMPROVISE generates scales for quantitative data, but no mechanism facilitates ordered data. None of the taxonomies in BOZ and IMPROVISE handle navigation or take visual steering into consideration.
6. FORMULATING DESIGN RATIONALE
We argue that a designer implicitly designs a required sequence of elementary operations when inventing a new representation. We also suggest that most explanations given by designers can be expressed in terms of elementary operations, and in particular in how a particular design improves operation performance. In the following, we present various designs for bus schedules and ATC paper strips. We explain the expected gains of each design using the concepts presented above. We balance the claims by our own analysis, and possible loss of performance due to a lack of support for overlooked operations.
6.1 Bus schedule
6.1.1 Ordered-by-time linear representation
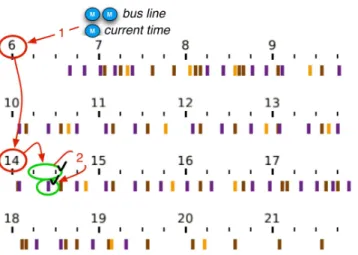
Figure 2. An ordered-by-time bus schedule
One bus company proposes the representation in Figure 2 on its web site. This displays an ordered list of time of departure at the chosen station along the X dimension, with the corresponding bus line indicated by a cell containing a background color and white text. The required steps are:
Step 0: memorize the current time and appropriate bus lines (entering and memorizing), possibly translating time from an ‘analog’ watch to a text in the form hh:mm (entering).
Step 1: find the ordered list of time (seeking), and the first time later than the current time (navigating and predicate).
Step 2: find the next appropriate bus (predicate, or seeking a
mark if using bus color).
Step 3: find the associated time (seeking a mark).
Step 4: compute the waiting time before the departure (exiting). Compared to the tabular representation, the following operations may be aided…:
seeking and navigating among a subset of marks: times of
departure are displayed in a ordered manner which may ease navigation.
seeking a subset of marks: the user can easily select elements to
the right of the element found in step 2 (later times, using selection based on location).
memorizing: there are less information to memorize (2 vs 6
chunks).
…and there are no apparent drawback.
6.1.2 Spiral representation
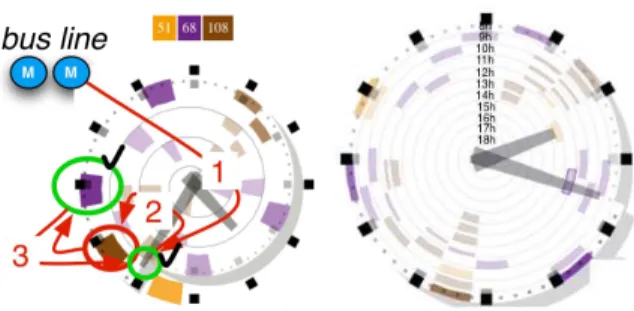
SpiraClock is an interactive tool that displays nearby events inside a spiral (instead of a circle like with a regular clock).26 Time of event is mapped to angle, and thanks to the multiplexing of the angle over the radius, other information emerge (periodicity, closeness through radius) (Figure 3). The clock also displays the current time, and adapts the event occurrences accordingly. The occurrence of an event is actually depicted by the “most recent” limit of a “slice”. Duration is a relative angle, or a curvilinear distance, which is quantitative representation, more precise on the exterior of the spiral (i.e. for close events) than in the interior. There is also a scale depicted with black squares along the circle. SpiraClock’s designers argued that adding textual information about hours would be useless, since the design uses a well-known reference (a watch) and since the visualization is focused on current time. If we represent the bus timetable on SpiraClock (as in Figure 3), the steps required to answer the question are:
Step 0: memorize two bus colors (entering and memorizing) Step 1: find the end of minute hand (seeking a mark)
Step 2: find the next matching colored mark (i.e. corresponding to line 68 or 108) (seeking a mark)
Step 3: evaluate the distance between the matching mark and the minute hand, and estimate the waiting time (unpack and exiting) Compared to the ordered linear representation, the following operations may be aided…:
entering: the current time is directly visible thanks to the hands. navigating: since the time is visible, navigating to the next
correct bus is shorter
exiting: with SpiraClock, a rough idea of the waiting time is
directly visible (no computation needed), since it is proportional to distance and the design uses a culturally-known scale. … and there are no apparent drawback.
Figure 3. SpiraClock. Left: visual scanning. Right: a configuration that displays more information
6.1.3 Quantitative linear representation
Figure 4 shows a representation based on a linear quantitative scale. Each colored rectangle represents the departure of a bus at the chosen station. The horizontal position of a rectangle corresponds to the time of departure and is multiplexed along the vertical dimension. To aid navigation, a linear scale is provided, with textual information about hours, and small ticks to mark quarters between hours.
Step 0: memorize two bus colors (memorizing), possibly translate time from a watch to a text for hour, and then to a position among ticks for minutes (entering)
Step 1: find the hour (seeking a mark).
Step 2: find the correct quarter-hour among the ticks (seeking a
mark).
Step 3: find the next compatible bus (i.e., corresponding to line 68 or 108) (seeking a mark).
Step 4: evaluate the distance between the matching mark and the minute hand, and estimate the waiting time (no computation is needed) (unpack and exiting).
Compared to SpiraClock, the following operation may be aided…:
navigating: thanks to the linear layout and the supplemental
space between rows, the steering task is easier to perform (especially compared the narrow tunnel configuration of Figure 3, left).
… at the expense of the entering operation (there is no current time visible, since the representation is not dynamic).
Figure 4. A linear, quantitative bus schedule representation
6.2 ATC strips
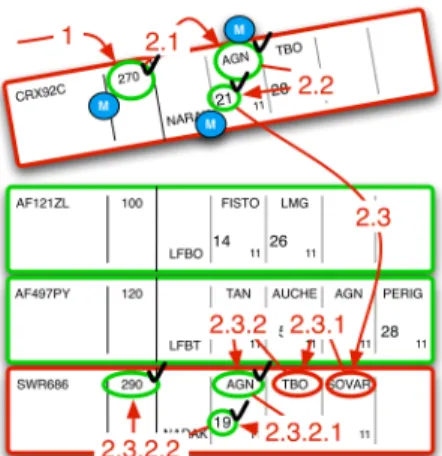
The activity of Air Traffic Controllers (ATCos) includes maintaining a safe distance between aircraft by giving clearances to pilots—heading, speed, and level (altitude) orders. ATCos must detect potential conflicts in advance. To do this they use various tools, including a radar view and flight strips.27 A flight strip is a paper strip that shows the route followed by an airplane when flying in a sector (Figure 5).
Figure 5. An ATC paper strip
The route is presented as an ordered sequence of cells, each cell corresponding to a beacon, with its name, and its time of passage. Controllers lay paper strips on a strip board, usually by organizing them in columns. The layout of strips on a board, though physical, can be considered as a representation. Some planned systems aim to replace paper strips with entirely digital systems, so as to capture clearances in the database (currently the system is not aware of clearances from the controllers to the pilots). These systems partly replicate the existing representation, and we show in subsequent sections how they compare with respect to representation scanning.
6.2.1 Regular strip board
One of the activities of a controller is to integrate the arrival of a flight into the current traffic. To do this safely, the controller must check that for each beacon crossed by the new flight, no other flights cross that beacon at the same time at the same level. Figure 6 shows the required idealized scanning, with typical paper strips organized in a column. The steps are:
Step 1: find the flight level and memorize it (seeking and
memorizing).
Step 2.1: find the beacon text on the arrival strip (seeking), and for each beacon (horizontal text list scanning, with no perturbation), do the following steps (navigating).
Figure 6. Scanning on regular ATC paper strip
Step 2.2: memorize the beacon text, find the minute information (hour is usually not important) (seeking), and memorize it (memorizing).
Step 2.3: for each other strip (vertical rectangular shape list scanning), do the following steps (seeking and navigating). Step 2.4.1: find the beacon text, and for each beacon (horizontal text list scanning, with no perturbation), do the following steps (seeking and navigating).
Step 2.4.2: compare the beacon text to the one memorized in step 2.2 (predicate).
Step 2.4.3.1: if it is the same, find the minute text, and compare it to the one memorized in step 1.2 (+-5 min) (predicate). Step 2.4.3.2: if the number is about the same, find flight level, check it and compare it with the memorized level (predicate). Step 2.5.1.2: if it is the same, do something to avoid a conflict (predicate and exiting).
6.2.2 Strips in colored holders
The strip look and layout in the previous section is specific to the Route Control Centre at Bordeaux, France. In other En-Route Control Centers, people use rigid, colored holders for each paper strip. The look of strips is different, since the colored frame of the holder surrounds each strip. Figure 7 shows an idealized scanning with colored strip holders: here red is for north-south flights (odd flight level), while green is for south-north flights (even flight level). Because of the different level assignments, controllers can be sure that red and green flights will never enter into conflict. Red holders can quickly be extracted from green ones (selection based on color). Hence, colored strip holders enable controllers to narrow the set of flights to compare with a new one, and reduce the number of required steps accordingly (step 2.x, with x>=3, seeking and
navigating). Holder colors can also ease predicate verification:
holder color of the arriving strip can be matched easily to holder color of other strips, without requiring the controller to determine if the strip is a north-south or a south-north flight.
Figure 7. Scanning with paper strips in colored holders
6.2.3 Dynastrip
Dynastrip displays beacons in a quantitative way, mapping time to the horizontal dimension (Figure 8).28 All time scales are aligned across strips. The main goal of Dynastrip is to display position relative to planned route in the strip, which adds information. Dynastrip designers also hoped that this representation would assist controllers to identify conflicts: if beacons with the same text are vertically aligned, it means that multiple flights pass over the same beacon at the same time.
Figure 8. Dynastrip, overlaid with the steering tunnel
Step 1: find the flight level (seeking), and memorize it (memorizing).
Step 2.1: find the beacon texts on the arrival strip, and for each beacon (horizontal text list scanning (seeking and navigating), do the following steps.
Step 2.2: memorize the beacon (memorizing), steer visually through a tunnel (+-5min) (symbolized in gray on Figure 8 but not shown on the actual interface) (seeking and navigating), and compare each beacon found with the memorized one (predicate).
Step 2.2.1: find the flight level, check it and compare it with the memorized level (predicate).
Compared to the regular strip boards, this design may aid…:
Seeking and navigating: thanks to a steering task, beacon search
is facilitated.
Verifying a predicate: the time limit is directly visible.
… at the expense of a supplemental interaction to reach beacons not yet visible on the time scale.
7. VALIDITY AND LIMITATIONS
Idealized scanning is only theoretical. We have not verified experimentally the degree to which actual scanning corresponds to our model, which raises questions about the validity of the work presented here. However, we suggest that designers implicitly rely on theoretical scanning, though their expectations do not always stand against reality.29 A deeper understanding of the phenomena is thus necessary, to make explicit design choices and expected benefits, and to get a reasonable confidence in the design.
Bertin’s semiology of graphics and Furnas’ Effective View Navigation30 have not been fully validated experimentally. Nevertheless, their concepts permeate a large number of visualization designs. These approaches allow identification of relevant concepts and dimensions when analyzing or designing new visualizations. We think that the elementary operations we identify in this paper will serve as a similar framework for representation rationale. In the same way, we have not verified experimentally whether navigation in an ordered set is easier than in a random set, and whether navigation in a quantitative set is easier than in an ordered set. Again, a number of visualizations rely on these assumptions: making the assumptions explicit helps designers think about the effectiveness of their designs.
The absence of a distinction between “beginners” and “experts” in our analysis seems problematic as well. This is clearly the case in the ATC example: we know from previous observation that ATC controllers do not scan the strips the way we described the process above. Instead, they rely heavily on their knowledge of the sector, recurrent problems and recurrent aircraft to detect conflicts. Again, our description aimed at eliciting what the visualization enables for a reader that only uses information extracted from the representation. However, during normal operations, ATC controllers regularly do what they call a “tour of the radar image” or a “tour of the strip board”, in order to check “everything”. In this case, they are supposed to heavily scan both representations and may exhibit some of the theorized behavior. Furthermore, we observed that ATC controllers make more errors when training on a new sector, at least partly because of representation flaws. These flaws are compensated for by expertise, which is somewhat related to knowledge in the head and memory (in some cases, an ATC controller is considered as expert on a sector only after 2 years of training). However, in high-load situations, with lots of aircraft, or with particular problematic conditions such as unexpected storms, the representation becomes more important and controllers seem more likely to exhibit the theorized behavior.
8. VISUAL SCANNING AND
INTERACTION
Very few serious visualization applications are devoid of any interaction with the user, whether for saving data, searching, modifying data, or changing the representation itself. Even bus schedules printed on paper are often bound in leaflets that the user must browse to find the appropriate page. Zooming and panning, changes of view point, data filtering, and similar operations are often involved to help the user navigate in the data representation. Considering visual scanning as interaction that occurs through the eyes, this can be understood from two
equivalent theoretical points of view: actions as part of reading a representation, or visual scanning as part of interaction in general. Or, from a more practical perspective, it can be considered as the choice of a new representation by the user. In this section, we first explore the more practical perspective and use examples to demonstrate how the user, by interacting with the representation, plays a similar role to the designer: she selects a new representation that makes visual scanning simpler for the task at hand. We then discuss the more abstract perspectives, outlining how these user's actions could be described in the same framework as the visual scanning itself, thus allowing designers to reason about how their overall design will be used and not only the individual representations.
8.1 Interacting for better representations
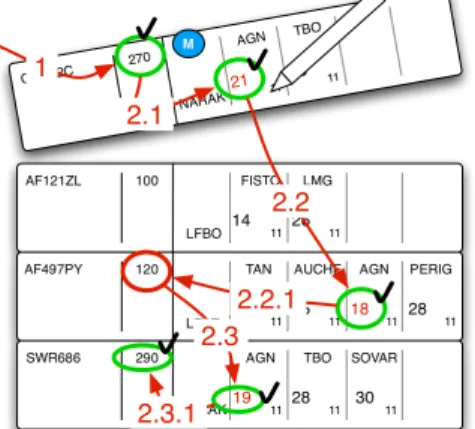
8.1.1 Pen-based digital stripping system
Figure 9 shows a digital, pen-based system that adds an interaction allowing the controller to press a beacon cell, so as to highlight in red the time of passage over that beacon on other strips (the system cannot automatically detect conflict because the data on the strips is not always current). This facilitates
seeking and navigating in step 2.x, as it reduces the subset of
marks to consider when comparing times, and memorizing (1 vs 3 cells).
Figure 9. A pen-based digital stripping system that enables highlighting of information.
8.1.2 Progressive disclosure
Progressive disclosure dictates that detail be hidden from users until they ask or need to see, in order to avoid overwhelming users with information.31 Progressive disclosure is often implemented with simple property boxes, on which properties can be expanded (using a ‘show more’ button, or a ‘disclosure triangle’ in MacOSX toolbox). As such, this design principle can be considered as a way to ease navigation between important elements, before explicitly hardening it when navigating has been achieved successfully.
8.1.3 Switching views
Calendar systems (such as Apple iCal or Google Agenda) often offer multiple views on events information. In a month view, events are ordered on the Y screen dimension, whereas in a week view, events are displayed in a quantitative manner on the Y screen dimension. Switching from month to week view enables users to unpack the duration information of events more easily. Switching from week to month view enables users to
visualize more events (the month view is denser), in an ordered manner, and thus facilitate navigating.
8.1.4 Brushing and selection
Brushing enables users to select a subset of displayed data in visualization system. The feedback of such an interaction usually highlights the brushed data, by changing their color for example. Brushing in a matrix scatterplot can be used to detect patterns in other juxtaposed scatterplots, but it also can be used to find a particular plot in other juxtaposed views. The last case can be considered as a way to facilitate exiting and entering between two juxtaposed views.
8.1.5 Progressive transition between views
With calendar systems, switching makes a new view replace the current one: views are at the same place, conversely to juxtaposed views. The switch is instantaneous, which disturbs the optical flow of users. Hence, users are forced to scan the new visualization to find again the particular information they were looking at in the previous view. Thus, to perform a switch of views, users have to exit the first view by unpacking and
memorizing conceptual information (day, hour), and enter the
new visualization.
On the other hand, a progressive transition between views enables users to track moving marks during the time of the transition. For example ScatterDice32 use an animated 3D rotation between ScatterPlots. Progressive 2D interpolations also provide transition between scenes33,34. Both transitions (2D or 3D) enable users to track a particular moving items, and see its final position into the final view. Hence, progressive, animated transitions enable users to get rid of exiting and entering views that occupy the same place. Moreover, tracking a moving mark is like guiding the eye of the user, by controlling it (in the sense of control engineering). The goal is the same than a spreadsheet where every other row is colored.
8.2 Discussion
The concept of interacting to perceive better is not new: in fact, this is a concept that is shared among psychologists of action and perception.35 Designers adapt the representation to make it easier to answer specific pre-established problems. Users also adapt the representation to make it easier to answer a problem at hand. Hence, interacting to change views is of the same nature as designing. In both cases, the present work is helpful as an account of the visual task at play, but it is not at describing the “design manoeuvre”23 required to get a better design. There may be new concepts remaining to be identified, both in the design space and the use space, that would form the basis of a prescriptive method for designing better (interactive) representations.
Designing an interactive representation cannot be as simple as taking into account visual scanning alone, nor can it be as simple as counting the number of KLM operators alone. The design must be analyzed as a whole, and actions to switch from a representation to another should be taken into account. Interestingly KLM, despite being focused on the users’ actions, accounts for their perception and memorization activities through its operator M. One could consider our work on visual scanning as a first attempt at describing some aspects of this operator in more detail. One can use this perspective to extend our approach to representations that the user can manipulate, indifferently considering actions as part of the scanning process
or scanning as part of a global interaction process. One way of proceeding would be to add an interaction operation to the visual scanning language. This would provide user interface designers with two dual languages for analyzing their designs: one focused on the user's physical actions, with operator M used to capture other types of interaction, and the other focused on visual scanning, with operator I used to capture other types of interaction. At a finer level of analysis, the two languages would then appear to be simplified and practical versions of a common language that describes all interaction operations on the same foot.
Note that considering scanning as interaction is not so artificial as it may seem. On the one hand, at the physical level there is indeed some interaction through the emitted light, and it does indeed trigger significant changes in the user. And on the other hand, the use of speech acts to describe multimodal interaction has shown that combining different interaction modalities in the same abstract framework can provide designers with an adequate description language. Finally, proponents of enaction think that perceiving is acting: “the content of perception is not like the content of a picture; the world is not given to consciousness all at once but is gained gradually by active inquiry and exploration” 36. If this theory proves true, the total costs of adapting the view and scanning would be difficult to estimate with a method as simple as summing the cost of individual operations. A finer language that accounts for the concurrency between operations migth prove more suitable with this regard.
9. CONCLUSION
In this paper, we presented a method to analyze theoretical scanning of graphical representations. The method relies on a set of elementary operations, which includes operations from previous taxonomies and new ones (entering, exiting,
memorizing) together with new considerations (back steps,
visual steering, and the use of ordered or quantitative arrangement). We argue that rationale for design can be expressed in terms of these elementary operations. We showed in various examples how such an analysis can be achieved and how gains and losses can be explained with elementary operations, including when considering interaction as a change of representation. The set of elementary operations forms the basis of a shared, common language that helps designers justify and compare their choices.
In its current form, the method is descriptive, not predictive. We believe that we are still far from a fully predictive model of human performance in representation use. In the meantime, we argue that a descriptive method is useful for designers, since the decomposition highlights the challenges encountered by a user when deciphering a representation. The benefit is equivalent to one of the two benefits of KLM: in addition to predicting completion times, KLM helps designers to understand what a user must do to accomplish an interaction task.
In addition to the examples presented here, we have successfully applied our analysis method presented to other representations, such as item rating by customers in online stores, widgets, and radar images. Work is certainly needed to expand the set of operations and the elements that aid or affect their realization. For example, we do not yet take into account the fact that tasks can be aided when externalizing constraints into the real world,37 nor did we take into account representations that ease mental
computation.38 Furthermore, different acts of mental computation and memorization may exhibit very different costs. In addition, while we tackled the “what to do” question in this paper, we did not tackle the question of “how to do it”. Eventually, we need to propose a systematic method that will help designers find for themselves the steps and considerations to take into account when evaluating the effectiveness of a particular representation.
10. ACKNOWLEDGEMENTS
The authors wish to thank the reviewers for their very relevant suggestions. We also thank N. Roussel and W.G. Philips for their helpful comments.
11. REFERENCES
1 Amar, R., Stasko, J. (2004) A Knowledge Task-Based Framework for Design and Evaluation of Information Visualizations, Proc. of IEEE InfoVis '04, pp. 143-149. 2 Anderson, J. R., Matessa, M., & Lebiere, C. (1997).
ACT-R: A theory of higher-level cognition and its relation to visual attention. Human Computer Interaction, 12(4), 439-462.
3 Anderson, J. R., Bothell, D., Byrne, M. D., Douglass, S., Lebiere, C., & Qin, Y . (2004). An integrated theory of the mind. Psychological Review 111, (4). 1036-1060.
4 Bertin, J. (1967) Sémiologie Graphique - Les diagrammes - les réseaux - les cartes. Gauthier-Villars et Mouton & Cie, Paris. Réédition de 1997, EHESS.
5 Cleveland, W., McGill, R. (1984) Graphical Perception: Theory, Experimentation, and Application to the Development of Graphical Methods. Journal of the
American Statistical Association 79.
6 Tufte, E. R. The Visual Display of Quantitative
Information. (2001) Graphics Press, Cheshire, CT, 2nd ed. 7 Wilkinson, L. (1999) The Grammar of Graphics. New
York: Springer Verlag.
8 Munzner, T. A Nested Process Model for Visualization Design and Validation. (2009). In IEEE Trans. on
Visualization and Computer Graphics, vol. 15, no. 6, pp.
921-928.
9 Ware, C. (2008). Visual Thinking for Design. Morgan Kaufmann.
10 Crowe, E. C. and Narayanan, N. H. (2000). Comparing interfaces based on what users watch and do. In
Proceedings of the 2000 Symposium on Eye Tracking Research & Applications. ETRA '00. ACM, New York,
NY, 29-36.
11 Riedl, M. O. and St. Amant, R. (2002). Toward automated exploration of interactive systems. In Proc of IUI '02. ACM, 135-142.
12 Salvucci, D. D. and Anderson, J. R. (2001). Automated eye-movement protocol analysis. Hum.-Comput. Interact. 16, 1 (Mar. 2001), 39-86.
13 Atkins, M. S., Moise, A., and Rohling, R. (2006). An application of eyegaze tracking for designing radiologists' workstations: Insights for comparative visual search tasks.
14 Rayner, K. Eye Movements in Reading and Information Processing: 20 Years of Research. (1998) Psychological
Bulletin, Vol. 124, No. 3, 372-422.
15 St. Amant, R. & Riedl, M.O. (2001) A perception/action substrate for cognitive modeling in HCI. International
Journal of Human-Computer Studies, 55, 1, 15-39.
16 Lohse, G. L. (1993). A cognitive model for understanding graphical perception. Hum.-Comput. Interact. 8, 4, 353-388.
17 Casner, S. M. (1991). Task-analytic approach to the automated design of graphic presentations. ACM Trans.
Graph. 10, 2 (Apr. 1991), 111-151.
18 Zhou, M. X. and Feiner, S. (1998) Visual task
characterization for automated visual discourse synthesis, Proc of CHI’98, p.392-399, ACM.
19 Card, S. K., Moran, T. P., and Newell, A. (1980). The Keystroke-Level Model for user performance time with interactive systems. CACM 23, 7 (Jul. 1980), 396-410. 20 Appert, C., Beaudouin-Lafon, M., Mackay, W. (2004)
Context Matters: Evaluating Interaction Techniques with the CIS Model. In Proceedings of HCI 2004, Leeds, UK. Springer Verlag, pages 279-295.
21 Searle, J. (1969) Speech Acts. Cambridge University Press. 22 Caelen, J. Multimodal Human-Computer Interface. (1994)
in Fundamentals of Speech Synthesis and Speech Recognition, E. Keller ed., J. Wiley & Sons, Ltd, pp. 339-373.
23 Green, T.R.G (1989). Cognitive dimensions of notation. In
People and computers V, Cambridge University Press, pp
443-460.
24 Cockburn, A., Gutwin, C., and Greenberg, S. (2007). A predictive model of menu performance. In Proc. of CHI '07. ACM, New York, NY, 627-636.
25 Accot, J. and Zhai, S. (1997). Beyond Fitts' law: models for trajectory-based HCI tasks. In Proc. of the SIGCHI
Conference on Human Factors in Computing Systems. CHI
'97. ACM, New York, NY, 295-302.
26 Dragicevic, P. and Huot, S. (2002). SpiraClock: a continuous and non-intrusive display for upcoming events.
In Extended Abstracts of CHI '02. ACM, 604-605.
27 MacKay, W. E. (1999). Is paper safer? The role of paper flight strips in air traffic control. ACM Trans.
Comput.-Hum. Interact. 6, 4 (Dec. 1999), 311-340.
28 Grau, J.Y.; Nobel, J.; Guichard, L.; Gawinoski, G. "Dynastrip": a time-line approach for improving the air traffic picture of ATCOS. (2003) Digital Avionics Systems
Conference. DASC’03. 22(1), p 5.E.1 - 51-11, IEEE.
29 Johansen, S. A. and Hansen, J. P. (2006). Do we need eye trackers to tell where people look? In CHI '06 Extended
Abstracts. ACM, 923-928.
30 Furnas, G. W. (1997). Effective view navigation. In Proc.
of CHI '97. ACM, New York, NY, 367-374.
31 Johnson, J., Roberts, T. L., Verplank, W., Smith, D. C., Irby, C. H., Beard, M., and Mackey, K. (1989). The Xerox Star: A Retrospective. Computer 22, 9 (Sep. 1989), 11-26, 28-29.
32 Elmqvist, N., Dragicevic, P., Fekete, J.-D. Rolling the dice: Multidimensional Visual Exploration using Scatterplot Matrix Navigation Visualization. (2008) IEEE Trans. On Visualization and Computer Graphics, Volume 14, Issue 6, 1539-1148.
33 Schlienger, C., Conversy, S., Chatty, S., Anquetil, M., Mertz, C. (2007) Improving Users Comprehension of Changes with Animation and Sound: an Empirical Assessment. In Proc. of Interact 2007, LNCS, 207-220. Springer Verlag, 2007.
34 Heer, J., Robertson, G.G. (2007) Animated Transitions in Statistical Data Graphics. In IEEE Trans. on Visu. and Comp. Graphics, 13(6), 1240-1247.
35 Gibson, J.J. (1966). The Senses Considered as Perceptual Systems. Boston: Houghton Mifflin.
36 Alva, N. (2006). Action in Perception. The MIT Press. 37 Zhang, J. (1997). The Nature of External Representations
in Problem Solving. In Cognitive science, 21(2), 179-217. 38 Zhang, J., Norman, D. (1995). A Representational Analysis