HAL Id: hal-03094565
https://hal.archives-ouvertes.fr/hal-03094565
Preprint submitted on 6 Jan 2021
HAL is a multi-disciplinary open access
archive for the deposit and dissemination of sci-entific research documents, whether they are pub-lished or not. The documents may come from teaching and research institutions in France or abroad, or from public or private research centers.
L’archive ouverte pluridisciplinaire HAL, est destinée au dépôt et à la diffusion de documents scientifiques de niveau recherche, publiés ou non, émanant des établissements d’enseignement et de recherche français ou étrangers, des laboratoires publics ou privés.
Vincent Fontanier, Matthieu Sarazin, Frederic Stoll, Bruno Delord, Emmanuel
Procyk
To cite this version:
Vincent Fontanier, Matthieu Sarazin, Frederic Stoll, Bruno Delord, Emmanuel Procyk. Local in-hibitory control of frontal network metastability underlies the temporal signature of cognitive states. 2021. �hal-03094565�
1
Local inhibitory control of frontal network metastability
underlies the temporal signature of cognitive states
Vincent Fontanier1*, Matthieu Sarazin2*, Frederic M. Stoll3, Bruno Delord2x, and Emmanuel Procyk1x
1 Univ Lyon, Université Lyon 1, Inserm, Stem Cell and Brain Research Institute U1208, 69500 Bron, France.
2 Institute of Intelligent Systems and Robotics (ISIR), Sorbonne Université, Centre National de la Recherche Scientifique, UMR
7222, 75005 Paris, France,
3 Nash Family Department of Neuroscience and Friedman Brain Institute, Icahn School of Medicine at Mount Sinai, New York,
NY, USA
* x Equal contributions
Correspondence and requests for materials should be addressed to V.F. (email: Vincent.fontanier@gmail.com) or to M.S. (email: Matthieu.Sarazin@live.fr).
2
Summary
Cortical neural dynamics organizes over multiple anatomical and temporal scales. The mechanistic origin of the temporal organization and its contribution to cognition remain unknown. Here we demonstrate that a temporal signature (autocorrelogram time constant and latency) of neural activity enlightens this organization. In monkey frontal areas, recorded during flexible cognitive decisions, temporal signatures display highly specific area-dependent ranges, as well as anatomical and cell-type distributions. Moreover, temporal signatures are functionally adapted to behaviorally relevant timescales. Fine-grained biophysical network models, constrained to account for temporal signatures, reveal that after-hyperpolarization potassium and inhibitory GABA-B conductances critically determine areas’ specificity. They mechanistically account for temporal signatures by organizing activity into metastable states, with inhibition controlling state stability and transitions. As predicted by models, state durations non-linearly scale with temporal signatures in monkey, matching behavioral timescales. Thus, local inhibitory-controlled metastability constitutes the dynamical core specifying the temporal organization of cognitive functions in frontal areas.
Keywords:
cingulate, prefrontal cortex, AHP, GABA(B), timescale, primate, recurrent networks, inhibition, attractor, metastable states
Introduction
Large scale cortical networks are anatomically organized in hierarchies of inter-connected areas, following a core-periphery structure (Markov et al., 2013). Within this large scale organization, the dynamical intrinsic properties of cortical areas seem to also form a hierarchy in the temporal domain (Chaudhuri et al., 2014; Murray et al., 2014). The temporal hierarchy arises from increasing timescales of spiking activity from posterior sensory areas to more integrative areas including notably the lateral prefrontal and midcingulate cortex. Intrinsic areal spiking timescales are defined from single unit activity autocorrelation (Murray et al., 2014). Long spiking timescales potentially allow integration over longer durations, which seems crucial in the context of higher cognitive functions, learning and reward-based decision-making (Bernacchia et al., 2011). Recent studies uncovered links between single unit working memory and decision-related activity and spiking timescales in the lateral prefrontal cortex (Cavanagh et al., 2018; Wasmuht et al., 2018). However, the mechanisms that causally determine the timescale of cortical neuron firings and their role in the functional specificity of areas remain to be described.
To address this question, we recorded in the midcingulate cortex (MCC) and lateral prefrontal cortex (LPFC), because these two frontal areas both display particularly long spiking timescales and are functionally implicated in cognitive processes operating over extended timescales. These interconnected regions collaborate in monitoring performance and in integrating the history of outcomes for flexible decisions (Kennerley et al., 2006; Khamassi et al., 2015; Kolling et al., 2018;
3
Medalla and Barbas, 2009; Rothe et al., 2011; Seo and Lee, 2007; Womelsdorf et al., 2014a). Recent anatomical and physiological investigations revealed that the cingulate region has relatively higher levels of synaptic inhibition on pyramidal neurons than LPFC, with higher frequency and longer duration of inhibitory synaptic currents (Medalla et al., 2017), suggesting that excitatory and inhibitory cell types differentially contribute to the specific dynamics of distinct frontal areas. Moreover, MCC also seems to have a longer spiking timescale than the LPFC (Cavanagh et al., 2018; Murray et al., 2014).
In this context, we sought to understand the relationship between temporal features of spiking activity, local neural network dynamics and the computations implemented by frontal neural networks. We focused on whether and how different temporal features play distinct roles in different frontal areas. To this aim, we addressed the following questions: what are the exact differences in the temporal organization of spiking in the LPFC and MCC? How do they relate to the distinct roles of excitation and inhibition? Do they reflect cognitive operations, and can they be adjusted to current task demands? Can they be accounted for by local biophysical circuit specificities? If so, do distinct collective network neurodynamics emerge from such areal biophysical characteristics and what are their functional implications?
We examined the contribution of single unit temporal signatures to dynamical differences between LPFC and MCC in monkeys. After clustering units based on spike shape (putative fast spiking and regular spiking units) we computed spike autocorrelograms and their temporal signatures (time constant and latency). We discovered that LPFC and MCC differed not only in average time constant, but also specifically in the autocorrelogram latency of their regular spiking units.
Regular and fast spiking MCC neurons showed different temporal signatures. Remarkably, through these signatures, neurons contributed to encoding information at different timescales, i.e. information relevant between trials or across multiple trials. Exploring constrained biophysical recurrent network models, we identified the ionic after-hyperpolarization potassium (AHP) and inhibitory GABA-B receptor conductances as critical determinants mechanistically accounting for the difference in spiking temporal signatures between LPFC and MCC. The models predicted how differences in temporal signature amounts to the ability of networks to undergo metastable states with different properties. Indeed, we found, in monkey data, long-lasting states in primate MCC activity but not in the LPFC. Finally, we show that inhibition is a major factor controlling states stability and transitions.
Results
We analyzed population spiking timescales for units recorded in MCC and LPFC (140 and 159 units, respectively), using the autocorrelogram of spike counts (see Online Methods), and observed population autocorrelograms similar to those obtained with other datasets (Cavanagh et al., 2018; Murray et al., 2014; Wasmuht et al., 2018) (Fig. 1a). At the population level, the characteristic timescale of spiking fluctuation over time, TAU (the time constant from the exponential fit), was longer for MCC than for LPFC (MCC= 519±168 ms, LPFC= 195±17 ms). In addition, MCC single units exhibited longer individual TAUs than LPFC units (medians, MCC=553 ms, LPFC=293 ms; Two-sided Wilcoxon signed rank test on log(TAU), W=15192, p<10-8), as in previous datasets (Fig. 1c in Cavanagh et al.
(Cavanagh et al., 2018)). Aside from being characterized by a slow decay (long TAU), the MCC population autocorrelation displayed a distinctive feature: a positive slope at the shortest time lags equivalent to a latency in the autocorrelogram, that can be observed in previous publications (see Figure 1c in Murray et al. (Murray et al., 2014), Figure 1d in Cavanagh et al. (Cavanagh et al., 2018)).
4
However, the method we employ above (derived from Murray et al.) cannot resolve the fine dynamics of neuronal activity at short time lags. To improve upon this approach, we instead developed a method based on the autocorrelogram of individual units from all spike times, that provides high temporal precision in parameter estimation (see Online Methods).
One basic assumption to explain local dynamical properties is that interactions between cell types (e.g. pyramidal cells and interneurons) might induce specific dynamics in different areas (Medalla et al., 2017; Wang, 2020; Womelsdorf et al., 2014b). To separate putative cell populations in extracellular recordings we clustered them using single unit waveform characteristics (Nowak et al., 2003). Clustering discriminated 3 populations, with short, large and very large spikes (Fig. 1c). The results below were obtained using 2 clusters (small, and large + very large), as detailed analyses showed no clear difference between large and very large spike populations (see supplementary fig. S1). We classified units as fast spiking (FS, short spikes; nMCC=37, nLPFC=61 units) or regular spiking (RS, long
spikes; nMCC=257, nLPFC=215 units) which, in previous studies, were associated to putative interneurons
and pyramidal cells respectively.
Figure 1. Midcingulate cortex (MCC) and lateral prefrontal cortex (LPFC) spike count autocorrelograms. (a) Population exponential fit: autocorrelograms were computed for each unit and
the fit was performed on all the units of each area (as in Murray et al. 2014). (b) Single unit fits were used to capture individual spiking timescales and produce the distribution of TAU values for each region. Dotted lines represent the median of TAU. (c) Clustering of spike shape. We extracted spike width and valley to peak ratio (V2P) from each unit average waveform. A hierarchical clustering led to 3 groups of units (colored groups RS1, RS2, FS). In the paper, units with narrow spike width were termed as fast spiking (FS), whereas units with broader waveform were marked as regular spiking (RS: RS1 + RS2). The histogram indicates the number of MCC and LPFC units belonging to each of the 3 clusters.
5
From spike autocorrelograms we extracted multiple metrics: the peak latency (LAT) and time constant (TAU) (see Online Methods). Together, TAU and LAT constituted the temporal signature of single neurons spiking dynamic. The success rate of fitting an exponential on spike autocorrelograms was 91.9% and largely outperformed the alternative method (see Online Methods). Fig. 2a shows comparative examples. Note that in the pool of neurons where TAU was successfully extracted using both methods (see method for criteria), we found the two measures (Murray methods vs. spike autocorrelograms) of TAU were correlated (Spearman correlation: rho(282) = 0.46,p<10-15).
Importantly, TAU was not correlated with firing rate across units (supplementary fig. S2a).
TAU was higher on average in MCC than in LPFC for both regular and fast spiking cells (medians ± sd: MCC FS= 284.7±132 ms , RS= 319.5±199 ms , LPFC FS= 175.1±67 ms , RS= 191.6±116 ms; linear model fit on Blom transformed TAU for normality, TAU = Area * Unit type, Area : F(1,520)=18.36, p<10 -4, Unit type: F(1,520)=2.72, p=0.12, interaction: F(1,520)=0.19, p=0.79) (Fig. 2c).
In addition, LAT became a precise measure obtained for most autocorrelograms. Importantly, it differed significantly between MCC and LPFC for RS but not for FS units, with MCC RS units having particularly long latencies (median ± sd: MCC FS = 48.5±30 ms, RS = 108.7±64 ms , LPFC FS = 48.5±35 ms , RS= 51.9±46 ms ; linear model fit on Blom transformed LAT for normality, LAT = Area * Unit type, interaction: F(1,520) = 11.81, p<0.005) (Fig. 2c).
TAU and LAT both reflect temporal dynamics, but those measures were significantly correlated only in LPFC RS units (Spearman correlations with Bonferroni correction, only significant in LPFC RS: rho(203) = 0.29, p<10-3)). The absence of correlation suggested TAU and LAT likely reflect different
properties of cortical dynamics. Moreover, the data suggested that and the different temporal signatures of RS units could reflect differences in the physiology and/or local circuitry determining the intrinsic dynamical properties of MCC and LPFC.
MCC temporal signatures are modulated by current behavioral state
A wide range of temporal signatures might reflect a basic feature of distributed neural processing (Bernacchia et al., 2011). But do different temporal signatures play distinct roles in terms of neural processing in different areas? And, are these signatures implicated differentially, depending on task demands? As single units were recorded while monkeys performed a decision-making task (described in Stoll et al., 2016; Fig. 3a), we extracted each unit’s temporal signature separately for periods in which monkeys were either engaged in the cognitive task or were pausing from performing the task. TAU extracted during engage and pause periods were significantly correlated across neural populations (Pearson correlation: r(267)=0.24, p<10-4), indicating that TAU reflects stable temporal
properties across conditions. The MCC RS population exhibited a significant modulation of TAU, expressing longer TAU during engage periods compared to pause periods, suggesting that engagement in cognitive performance was accompanied by a lengthening of temporal dynamics for RS neurons in MCC (Fig. 3b left)(Wilcoxon signed-ranks test (Median=1) with Bonferroni correction, only significant for MCC RS: Median=1.08 , V=4265, p<10-7). We observed no significant variation of LAT with task
6
Figure 2. Spike autocorrelogram and temporal signatures in MCC and LPFC. (a) 3
single examples of spike count (purple) versus normalized spike autocorrelograms (green) contrasting the outcome of the 2 methods. The measured time constant (TAU) is indicated for both when possible. Numbers of spikes used for each method is also indicated. (b) TAU values extracted from each methods are significantly correlated (spearman rho(282) = 0.46,p<10-15). (c) Distributions of TAUs (upper histograms) and peak latencies (LAT - lower histogram) for FS (left) and RS (right) units. ‘n’ indicates the number of units. TAU values were longer in MCC than in LPFC for both FS and RS (linear model fit on BLOM transformed TAU for normality, TAU = Region * Unit type, Region: t=-4.68, p<10-6, Unit type: ns, interaction: ns). Peak latencies significantly differed between MCC and LPFC for RS but not for FS units (medians: MCC FS= 48.5 ms, RS= 102.0 ms , LPFC FS= 48.5 ms , RS= 51.8 ms ; linear model fit on BLOM transformed Latency for normality, Latency = Region * Unit type, interaction: t-value=-3.57, p< 10-3).
Temporal signatures are linked to cognitive processing
Contrary to MCC, LPFC temporal signatures were not modulated by engagement in the task. Multiple cognitive models propose a functional dissociation between MCC and LPFC and indeed empirical data reveal their relative contribution to feedback processing, shifting, and decision making (Khamassi et al., 2015; Kolling et al., 2018; Stoll et al., 2016). One important question is thus whether temporal signatures observed for a given area and/or cell type contribute to selected aspects of cognitive processing. For example, temporal signatures might be adjusted to the current functional context and time scale required to perform a task. In our experiment monkeys gained rewards by performing trials correctly in a categorization task while each success (reward) also brought them
7
closer to obtaining a bonus reward (Fig. 3a, right panel, see Online Methods for task description). By touching a specific lever at trial start, animals could either enter a categorization trial or check the status of a visual gauge indicating the proximity of the bonus reward availability. The number of rewards (i.e. correct categorization trials) needed to get the bonus, and thus the speed of the gauge increase, varied across blocks (i.e. either fast or slow). Previous analyses revealed that feedback influenced the likelihood of checking in the following trial (Stoll et al., 2016). Thus, feedback can be considered as information used on a short timescale (within the inter trial period). The animals also built an estimation of the gauge size that was updated upon checking in order to regulate the frequency of checks during blocks, allowing animals to seek and collect the bonus in a cost-efficient manner (Stoll et al., 2016). Gauge size can thus be considered as information used and carried over long timescales.
Figure 3. Behavioral engagement in task and spiking timescale changes. (a) Schematic representation of the task. At the
start of each trial, animals can either initiate a delayed response task (WORK option) which can lead to 1 reward delivery, or use the CHECK option to check the current size of the gauge (or collect the bonus reward). Each reward in the task contributes to increase the gauge size and bring the bonus availability closer. The graph (right) schematized the speed of increase of the gauge size which varies between blocks (fast or slow blocks). (b) Boxplots of indices for each unit type and region calculated to estimate potential changes in TAU between Engage and Pause (left), and between empty and full gauge (right). TAUs increased in Engage vs. Pause only for MCC RS units.
We first hypothesized that blocks of different speeds and/or gauge encoding could engage neurons and modulate their spiking timescale. This was not the case. TAU values were not significantly modulated depending on the state of the gauge (less vs. more than half full, fig. 3b right), nor related to different speeds (Wilcoxon signed-ranks test (Median=1) with Bonferroni correction, for gauge state and gauge speed, all p>0.6).
Conversely, we assessed whether temporal signatures observed for certain cell types contributed to code specific aspects of the task. We used mixed effect models on groups of single units to test the contribution of population activity to encoding task relevant information: feedback in categorization trials (i.e. reward vs. no-reward), and gauge size. The rationale was that feedback information was relevant within the intertrial period, whereas Gauge information was relevant across trials between two successive checks. Previous analyses had revealed that both MCC and LPFC units encode such information, although MCC units showed greater contributions(Stoll et al., 2016). We classed both FS and RS units as either short or long TAU units using a median split. A time-resolved generalized mixed linear models (glmm) revealed notable dissociations between these populations. During the intertrial period, the population of MCC RS units with short TAU was mostly involved in encoding feedback information, which was relevant only for the current trial (Fig. 4a). By contrast, RS units with long TAU were mostly involved in encoding gauge information, which contributed to regulate decisions across
8
trials (Stoll et al., 2016) (Fig. 4a, lower right). Long and short TAU RS populations in LPFC contributed mostly to encode feedback during the intertrial period (Fig. 4a, right).
Interestingly FS units in the MCC were mostly engaged in the first second after feedback onset, with a strong bias toward encoding negative feedback (Fig. 4a, upper left, positive estimates). Effects were more transient and involved short TAU units in the LPFC (Fig. 4a).
Spiking timescales are anatomically organized in MCC
Spiking timescales measured in MCC and LPFC covered several orders of magnitudes (10-1000 ms;
Fig. 2c). Because single unit recordings spanned large regions, such wide range could reflect anatomical
organization of segregated populations with distinct homogeneous intrinsic properties. Such organization has been observed in MCC with human fMRI (Meder et al., 2017). We indeed found that average TAU values in MCC were higher in more posterior parts, in particular for RS units (ANOVA on Blom transformed TAU: MCC, monkey A: F(5,112)=2.8, p=0.041, monkey H: F(5,54)=3.09, p=0.033, LPFC, monkey A: F(6,110)=0.34, p=1, monkey H: F(6,64)=2.49, p=0.066; linear regression on Blom transformed TAU: MCC, monkey A: t(1,112)=8.99, p=0.0067, monkey H: t(1,54)=2.22, p=0.28, LPFC, monkey A: t(1,110)=1.09, p=0.60, monkey H: t(1,64)=0.25, p=1 ; all p-values are FDR corrected for n=2 comparison per monkey) (Fig 4b). This suggests an antero-posterior gradient of spiking timescales. No such effect was observed in LPFC. Similar analyses for LAT revealed no consistent inhomogeneity within MCC or LPFC (Fig. S2b).
The consequence of such an organization, knowing the respective functional involvement of units with long and short TAU (Fig 4a), should be an antero-posterior functional gradient. We tested this by separating MCC cells in posterior versus anterior subgroups and tested their contribution to feedback and gauge encoding (Fig. 4b). Indeed, posterior RS units’ activity contributed to positive encoding of gauge size, preceded in time by encoding of positive feedback (negative estimates) (Fig. 4c lower and
upper right), while anterior RS units showed primarily a contribution to feedback encoding (Fig. 4c upper right). Finally, anterior FS units were primarily (in time and in strength) contributing to encoding
negative feedback. This remarkable contribution of FS to feedback encoding is studied and discussed further below.
In summary, MCC regular spiking units with relatively short or long TAU contributed to the encoding of task elements relevant over short and long terms, respectively. The spiking timescales seemed to be organized along the rostro caudal axis in MCC. This suggests a correspondence between cell type, temporal signatures and their functional involvement in processing specific aspects of cognitive information in different functional subdivisions of cortical regions. The crucial questions thus remain of the mechanistic origin of temporal signatures and of how they relate to cognitive functions.
9
Figure 4. Encoding of feedback and gauge size for different unit types and spiking timescales and rostro-caudal distribution. (a) Estimates (-coefficients) obtained from the MCC (grey) and LPFC (blue) unit
populations obtained from time-resolved glmm for Feedback (reward vs no reward; top graphs) and Gauge size (bottom) (see ‘Group analyses using glmm’ in Methods). Estimates are obtained at successive time points covering the entire inter-trial period between feedback onset and the lever onset in the following trial. Significant effects are indicated by a red triangle (p<0.05 corrected), shadings indicate standard deviations. Positive values depict a population activity bias towards negative feedback (top) and positive slope of linear coding for gauge size (bottom). Data is presented for FS and RS units (left and right respectively for each panel) and have been performed on subpopulation with short or long TAU values (determined by a median split). Short and long TAU populations are represented by light and dark color intensity. Note in particular the dissociation for RS MCC units with short and long TAU respectively coding for feedback and gauge size. (b) Averaged TAU values along the postero-anterior axis in the MCC and LPFC, for both monkeys. (c). Estimates reflecting coding strength of Feedback and Gauge size for MCC unit populations separated by their rostro-caudal location.
Biophysical determinants of temporal signatures in frontal network models
To uncover the source and consequences of distinct temporal spiking signatures in the LPFC and MCC, we designed a fine-grained model of local recurrent frontal networks. This model is unique in combining 1) highly-detailed biophysical constraints on multiple ionic channels, synaptic receptors and architectural frontal specificities, and 2) the cardinal realistic features of mammals cortical
10
neurodynamics including the excitation/inhibition balance, high-conductance state of neuronal activity and asynchronous irregular regime characterizing the awake state (Brunel, 2000; Destexhe et al., 2003; Hennequin et al., 2017). Our specific goal was to evaluate whether biophysical circuit specificities could mechanistically account for differences in LPFC and MCC temporal signatures. We also assessed whether these specificities induce distinct collective network neurodynamics and functional implications, possibly explaining the empirical relationships between temporal signatures, cell type, and information processing.
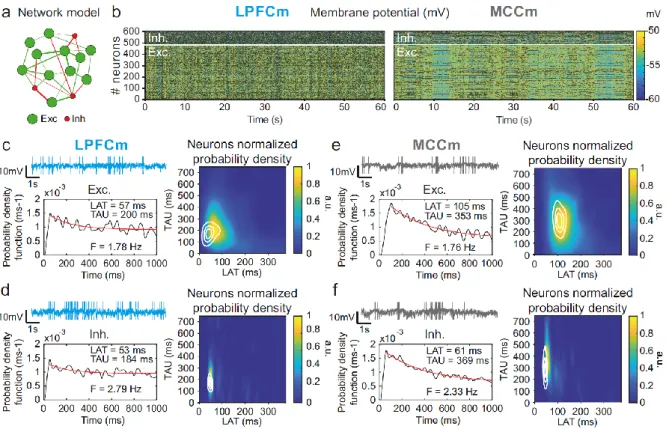
Figure 5. Temporal signature of LPFCm and MCCm recurrent network biophysical models. (a) Scheme of the frontal
recurrent networks modelled, with 80% excitatory (green) and 20% inhibitory (red) neurons and sparsity of synaptic connections. (b) Membrane potential in the 484 excitatory (lower part) and 121 inhibitory (upper part) neurons of example network models with parameter set to approximate LPFC dynamics (gCAN=0.025mS.cm-2, gAHP=0.022mS.cm-2,
gGABA-B=0.0035mS.cm-2 ; see text and legend of Fig. 6b for the choice of LPFC and MCC standard gAHP and gGABA-B maximal
conductances) and MCC dynamics (gCAN=0.025mS.cm-2, gAHP=0.087mS.cm-2, gGABA-B=0.0143mS.cm-2). (c) (upper left)
Membrane potential of an example excitatory neuron in the LPFC model (LPFCm). Scaling bars 1s and 10mV (spikes truncated). (lower left) Autocorrelogram of this LPFCm example excitatory neuron (black) and its exponential fit (red, see Online Methods). (right) Bivariate probability density distribution of autocorrelogram parameters in LPFCm excitatory neurons. Contour lines at 50, 75 and 90% of the maximum of the bivariate probability density distribution in LPFCmonkey RS units. (d) Same as (c) for LPFCm inhibitory neurons, with contour lines from the bivariate probability density distribution in LPFCmonkey FS units. (e,f) Same as (c,d), for the MCCm and MCC.
We first explored, using Hodgkin-Huxley cellular models (see Online Methods), whether specific frontal temporal signatures may arise from ionic or synaptic properties of individual neurons. Extensive explorations of these models identified, among many ionic and synaptic conductances tested, the maximal cationic non-specific (gCAN) and potassium after-hyperpolarization (gAHP) conductances as the
sole couple affecting both LAT and TAU. However, their regulation could not fully reproduce the monkey data set (see Supplementary Fig. S4 and S5). Thus, we then assessed whether collective
11
dynamics at the level of recurrent networks models could better account for frontal temporal signatures (Fig. 5a, see Online Methods). One-dimensional explorations of the large parameter space failed to identify single biophysical determinants accounting, alone, for differences between LPFC and MCC (RS and FS) temporal signatures (Supplementary Fig. S6 and Table S1). However, these explorations targeted four parameters of interest regulating either LAT or TAU confirming those already revealed in cellular models (gCAN and gAHP) and uncovering, in addition, NMDA and GABA-B
maximal conductance (gNMDA and gGABA-B) whose slow time constants strongly affected network
dynamics.
Two-dimensional explorations using these key parameters (Fig. 5 and supplementary Fig. S7) identified a single specific setup which demonstrated network dynamics that reproduced the shift from the LPFC-like temporal signature to that resembling the MCC with striking precision. An increase of both gAHP and gGABA-B, in the presence of gCAN, drove the model from an LPFC-like temporal signature
(LPFCm model) (Fig. 5c & d; map and contours: bivariate probability density model and monkeys’ distributions, respectively) towards that of the MCC (MCCm model, Fig. 5e-f). Specifically, gAHP
increased LAT and decreased TAU in excitatory (likely equivalent to RS) neurons (Fig. 6a left) and had no effect in inhibitory (likely FS) neurons (Fig. 6a right). Besides, gGABA-B decreased LAT in both excitatory
and inhibitory neurons (Fig. 6a top) and increased TAU in an intermediate range (Fig. 6a bottom). A bivariate probability density-based similarity measure (see Online Methods) revealed that monkey temporal signatures were robustly reproduced by the model in two large contiguous regions in the (gAHP, gGABA-B) plane, with both conductances increased in the MCC (Fig. 6b).
Several lines of evidence further indicated the model’s relevance. First, the model properly accounted for the larger LAT variability in monkey RS vs FS units (Fig. 5). Moreover, it reproduced the complex relations between LAT and first-order latency (ISI distribution latency) remarkably well, in all populations (Fig. 7c and Supplementary Fig. 7). Furthermore, both the firing frequency and input-output gain were lower in MCCm excitatory neurons (Fig. 6d), because of its higher gAHP (Naudé et al.,
2012), as found experimentally(Medalla et al., 2017).
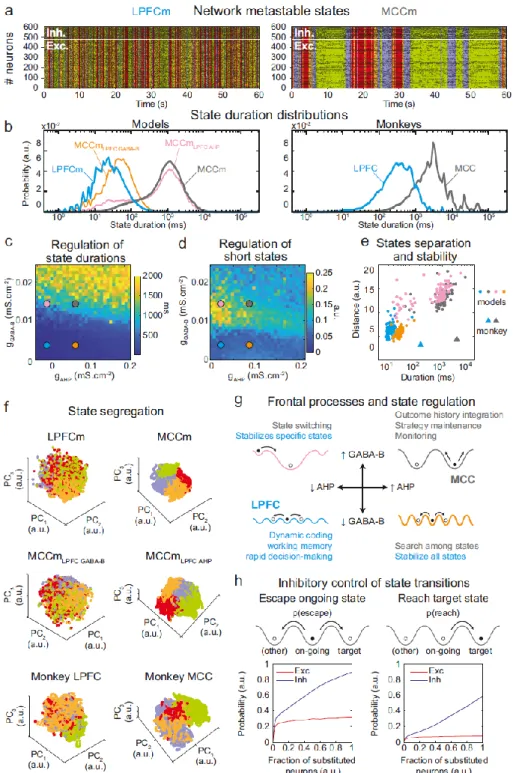
Metastable states underlie LPFC and MCC temporal signatures
The asynchronous irregular (presumably chaotic) dynamics of network models was highly structured in time (Fig. 5b). Hidden Markov models (HMM) revealed that it organized through collective transitions between so-called metastable (quasi-stationary) states in the models LPFCm and MCCm (Fig. 7a), as found in frontal areas (Abeles et al., 1995; Seidemann et al., 1996; Xydas et al., 2011). Moreover, while LPFCm states maximally lasted a few hundred milliseconds (Fig. 7b, left, blue), MCCm states persisted up to several seconds (Fig. 7b, grey). This suggested that such a difference in metastability may also parallel the difference of temporal signature in monkey LPFC and MCC areas. Applying HMM to experimental data revealed that, as predicted by the model, neural activity was organized as metastable states at slower timescales in the MCC (vs the LPFC, Fig. 7b, right). State durations were globally shorter in models (compared to monkeys), as they contained neither temporal task structure nor learning (see discussion) and were not optimized to fit data.
12
Figure 6. Similarity to monkey LPFC and MCC temporal signatures critically depends on AHP and GABAB
conductance in the network model. (a) Mean population LAT (top) and TAU (bottom) in Exc (left) and Inh (right)
neurons, as a function of AHP and GABA-B maximal conductances. Blue and grey disks indicate the (gAHP, gGABA-B)
parameter values of the LPFCm and MCCm models, respectively. (b) Similarity of the temporal signature between the network model and monkey data in the LPFC (left) and MCC (right), as a function of AHP and GABA-B maximal conductances (see Online Methods). In (a) and (b), the value for each (gAHP, gGABA-B) is averaged over 5 simulations.
Contour line at 80% of maximum similarity. LPFCm and MCCm (gAHP, gGABA-B) parameter values calculated as
coordinates of the contour delimited area’s weighted average. (c) Bivariate probability density distribution of the autocorrelogram LAT and first- order latency (the latency of the ISI distribution) in RS units in monkey LPFC (left) and excitatory neurons in the example LPFCm model (right). The model accounts for two distinct neuronal subsets in RS neurons, where LAT is determined by first-order latency solely (due to gAHP-mediated refractoriness; diagonal band), or in conjunction with other factors (gGABA-B slow dynamics-mediated burstiness and recurrent synaptic weight variability; horizontal band). (d) Single excitatory neuron frequency/intensity relationship in the LPFCm (blue) and MCCm (grey) models in response to a constant injected current.
13
Long states essentially required high gGABA-B in the MCCm, as they disappeared when gGABA-B was
lowered to its LPFCm value (MCCmLPFC GABA-B model, Fig. 7b left, orange curve). In contrast, they only
marginally depended on gAHP. MCCm and an MCCm model with the gAHP derived from that of LPFCm
(MCCmLPFC AHP) showed state duration distributions that were essentially similar, although there was a
small increase in the probability of short states at lower gAHP (pink vs gray curves). In the (gAHP, gGABA-B)
space, gGABA-B systematically proved to be essential in increasing the duration of states, with a border
region that clearly separated short states (<0.1s) from longer states (>1s) (Fig. 7c) At this intermediate border, lower gAHP increased the probability of short states (grey vs pink dots; distributions were even
bimodal at lowest gAHP values, not shown), as witnessed by departure from log-normality (Fig. 7c). As
such, the temporal structure of states in the LPFCm was dominated by short and unimodal state duration distributions (Fig. 7c and 7d, blue dots), as in monkeys (Fig. 7b, right) and previous studies(Abeles et al., 1995; Seidemann et al., 1996). In the MCCm, by contrast, the distribution displayed large durations and a slight departure from log-normality (Fig. 7c and 7d, grey dots), resulting in a majority of long states (>1s) coexisting with short states, as found in data (Fig. 7b).
State duration, i.e. stability, scaled with spatial separation in the neural space of activity (Fig.
7e, see Online Methods). Indeed, the shorter states of network models with lower gGABA-B (LPFCm and
MCCmLPFC GABAB, blue and orange dots) were less distant, compared to those of networks models with
higher gGABA-B (MCCm and MCCmLPFC AHP, grey and pink dots). While states were largely intermingled in
the LPFCm and MCCmLPFC GABAB (Fig. 7f, upper & middle left), they clearly segregated in the MCC and
MCCmLPFC AHP (Fig. 7f, upper & middle right). As predicted by the model, segregation between states
was indeed higher in the monkey MCC (Fig. 7e, large grey triangle, and Fig. 7f, lower right), compared to the LPFC (Fig. 7e, large blue triangle, and Fig. 7f, lower left). This suggests that the higher stability of states in monkey MCC arose from a larger segregation of representations in the space of neural activity.
Altogether, these results suggested that itinerancy between metastable states constitutes a core neurodynamical principle underlying the diversity of computational processes and functions operated in primate frontal areas (Fig. 7g, see Discussion). From this perspective, the conditions governing transitions between states is critical. We thus evaluated how perturbations of selective neuronal populations would escape ongoing states and reach specified target states (Fig. 7h). In the MCCm, we substituted the membrane potentials and synaptic opening probabilities of a fraction of excitatory (vs inhibitory) neurons of the ongoing HMM state by those of a target state. This could mimic the effect of internal chaotic fluctuations or external inputs aimed at reaching that target state. Surprisingly, escaping the ongoing state or reaching the target state remained quite unlikely when substituting excitatory neurons, whatever the fraction (Fig. 7h, left). By contrast, both probabilities of escaping and reaching scaled with the fraction of substituted inhibitory neurons, with high maximal probabilities (mean: 0.89 and 0.59 for escaping and reaching, respectively – Fig. 7h, right panel). Interestingly, the probability of escaping a state could attained 0.24 even with as few as 2% of substituted inhibitory neurons, indicating the significant impact of single inhibitory neurons on state itineracy.
Thus, inhibition is a major factor controlling targeted transitions between metastable states in the MCC network model and is also crucial in determining their stability. Excitation had no such role. This result is remarkable, especially considering that MCC FS neurons encoded negative outcomes immediately after feedback onset that triggered behavioral adaptive responses (Fig. 4). This could
14
reflect the involvement of MCC FS neurons in inducing state changes on feedback associated to behavioral flexibility.
Figure 7. Properties of metastable states in the LPFC and MCC (a) LPFCm and MCCm models spiking raster plots (black
dots), with Hidden Markov model states (HMM, colored bands) (b) State duration distributions: probability distributions of being in states of given durations in LPFCm (blue), MCCm (grey), MCCm with LPFCm gAHP (MCCmLPFC AHP pink) and MCCm
with LPFCm gGABA-B (MCCmLPFC GABA-B, orange) models (left) and monkey LPFC (blue) and MCC (grey) areas (right). Each model
was simulated 100 times and analyzed via HMM, while monkey data was analyzed via HMM with 100 different initiation parameter states. Periods above 300s were excluded. (c, d) Regulation of state duration and short states: median state duration (c) and Kolmogorov-Smirnov one-sample test statistic or maximal distance of state duration probability distributions to log-normality, as a measure of the over-representation of short states (d), as a function of gAHP and gGABA-B
maximal conductances. Colored disks indicate parameter values of LPFCm, MCCm, MCCmLPFC AHP and MCCmLPFC GABA-B
15
HMM states (averaged pairwise distance between neural centered standardized frequency centroids (temporal averages) of HMM states), as a function of median state durations. Distances calculated over 100 simulations in models and once for monkey LPFC and MCC data. (f) State segregation: projection of neural activity on the principal components of the PCA space of example model simulations and of monkey data. State colors as in (a). (g) Frontal processes and state regulation: schematic attractor landscapes in the LPFC and MCC. Horizontal and vertical arrows indicate possible regulations of AHP and GABAB conductance levels respectively by intrinsic/synaptic plastic processes or neuromodulation in the LPFC and MCC.
Likely functional processes operating in these landscapes are indicated in blue for the LPFC and grey for the MCC. (h) Inhibitory control of state transitions: probability to escape an ongoing state (left) and to reach a target state (right), when the ongoing state is perturbed by substituting a given proportion of its excitatory (vs inhibitory) neurons’ activity by that of the same neurons in the (perturbing) target state (see Online Methods). Average (full line), +/- s.e.m. (shaded areas, almost imperceptible).
Discussion
We showed LPFC and MCC displayed long population spiking timescales (TAU), with larger values in MCC (TAU~500 vs 200 ms), consistent with previous observations (Chaudhuri et al., 2015; Murray et al., 2014). In fact, LPFC and MCC express distinctive and complex temporal organizations of their activity, which cannot be solely captured by the population spiking timescale.The spiking timescale has been used as a measure characterizing intrinsic areal properties and an inter-area temporal hierarchy. However, the spiking timescale of single units varied over two orders of magnitude within each area (Cavanagh et al., 2018; Murray et al., 2014; Wasmuht et al., 2018). The latency of autocorrelogram also demonstrate informative variability, which suggest important underlying functional richness. Our study demonstrates that the temporal signature (TAU and LAT) of single units, measured through spike autocorrelogram metrics and cell type segregation, can highlight specific local ionic and synaptic mechanisms. Differences in temporal signatures, for instance between LAT of FS and RS in MCC, and within regions, provide important information on the functional properties of the underlying neural network.
Unravelling the multidimensional nature of LPFC and MCC temporal signatures at the level of individual neurons enabled us to constrain refined biophysical recurrent network models and reveal the local biophysical determinants mechanistically accounting for their specific temporal organization. Moreover, we showed that these determinants control neurodynamical features that constitute core computational foundations for the executive cognitive processes operated by these frontal areas.
Functional spatio-temporal organization of temporal signatures in frontal areas
The correlation between temporal signatures and behavior suggests how such biophysical properties could contribute to functional specificities. Spiking timescales distributions have been related to persistent activity, choice value and reward history in the LPFC and MCC (Bernacchia et al., 2011; Cavanagh et al., 2018; Meder et al., 2017; Wasmuht et al., 2018). Here, the spiking timescales of MCC RS units increased on average during periods of engagement in cognitive performance, likely reflecting the global implication of neural processes in task performance at long timescales. MCC units with different temporal signatures differentially contributed to cognitive processes known to engage MCC, namely feedback/outcome processing and outcome history representations (Kennerley et al., 2009; Quilodran et al., 2008; Seo and Lee, 2007). Outcome processing generally enables rapid – trial by trial – adaptation of control and decisions, while outcome history representations contribute to the long-term – across trials – establishment of values guiding strategy adaptation (Behrens et al., 2007; Karlsson et al., 2012).
In our experiment, short spiking timescale units contributed to feedback processing, whereas long spiking timescale units and especially RS units, contributed to encode gauge size, which linearly increase with the accumulation of rewards across trials. In MCC, this temporal dissociation coincided with a spatial organization along the antero-posterior axis: anterior units mainly encoded feedback
16
valence, more strongly and earlier than posterior units, whilst posterior units mostly encoded the long-term information related to gauge size. This antero-posterior gradient strikingly resembles that observed in humans (Meder et al., 2017).
Local molecular basis of frontal temporal signatures
Through extensive parameter exploration of constrained biophysical frontal network models, we identified 2 conductances that precisely reproduced all monkey temporal signatures. In the model, higher TAU (i.e. MCC vs LPFC, posterior vs anterior MCC) was accounted for by stronger synaptic GABA-B levels, consistent with reported higher GAGABA-BA-GABA-B receptor densities (Zilles and Palomero-Gallagher, 2017), stronger and slower inhibitory currents in the MCC (vs LPFC) (Medalla et al., 2017), and stronger GABA-B receptor densities in the posterior (vs anterior) MCC (Palomero-Gallagher et al., 2009). Excitatory synaptic transmission has been proposed to be a crucial determinant of longer spiking timescales in the temporal cortical hierarchy (Chaudhuri et al., 2015). We found that while stronger excitatory transmission increases TAU (possibly accounting for longer MCC TAUs), it also decreases LAT. LAT, however, was longer in the monkey MCC. This suggests that GABA-B inhibitory – rather than excitatory – transmission is the causal determinant of longer spiking timescales, at least in the LPFC and MCC. The model also predicts that higher LAT in the MCC originate from increased refractoriness through higher after-hyperpolarization potassium (AHP) conductances in RS units. Higher AHP implies lower input-output gains in MCC RS units, compared to the LPFC (Naudé et al., 2012), as found empirically (Medalla et al., 2017). Finally, reproducing appropriate temporal signatures required the cationic non-specific (CAN) conductance in the areas’ RS units. This was observed in RS of rodent medial frontal areas (Haj-Dahmane and Andrade, 1997; Ratté et al., 2018), where it regulates, together with AHP, cellular bistability and memory, network persistent activity and computational flexibility (Compte, et al., 2003; Papoutsi et al., 2013; Rodriguez et al., 2018; Thuault et al., 2013). Our conclusions do not preclude the contribution of other factors to temporal signatures such as large-scale hierarchical gradients (Chaudhuri et al., 2015), distinct neuromodulations (see below), or inputs with different spectral contents to LPFC and MCC.
Frontal temporal signatures uncover metastable dynamics
The LPFC and MCC activity, both in models and in monkeys’, was metastable, i.e. organized in sequences of discrete, quasi-stationary states in which activity fluctuates around fixed-point attractors (Abeles et al., 1995; La Camera et al., 2019; Rich and Wallis, 2016; Seidemann et al., 1996). As a general rule, the duration of states increases with the stability of their attractor (i.e. the depth/width of their basin of attraction) and decreases with spiking fluctuations. Fluctuations originate from stochastic inputs or chaotic noise (as in our model), and they trigger state transitions.
States were longer in monkeys, likely because extensive training induced attractors that were more stable, whereas models displayed less stable attractors that simply resulted from just random connectivity without learning. Thus metastability genuinely emerged from synaptic heterogeneity and did not require strong network clustering (La Camera et al., 2019). We showed that high GABA-B levels are crucial to stabilize states because they amplify the heterogeneity of inhibition and widens attractors, as reflected by higher state separation in the MCC. In addition, GABA-B’s long time constant naturally promotes burstiness, i.e. stable discharge episodes. Finally, higher AHP levels, required for higher LAT in MCC RS units, limited the occurrence of the shortest states, limiting frequent transitions between states.
In monkeys and biophysical models, temporal signatures, which correlate with state stability, actually reflect the underlying temporal organization of neurodynamics into metastable states.
17
Interestingly, state durations (up to >10s) were longer than spiking timescales (<0.5s), reconciling the apparent discrepancy between typical spiking timescales in frontal areas (<1s) and the functional timescales at which those areas operate (up to tens of seconds, Bernacchia et al., 2011).
Functional significance of metastable states in frontal areas
Metastable states can be linked to specific representations in the brain at a variety of levels of abstraction, from stimuli to mental states (Engel et al., 2016; La Camera et al., 2019; Mazzucato et al., 2015, 2019; Rich and Wallis, 2016; Taghia et al., 2018). In general, state transitions contain appreciable randomness, with high transition rates signing internal deliberation, whilst more stable states predicting forthcoming decisions (La Camera et al., 2019). We suggest that itinerancy among metastable states constitutes a core neurodynamical process supporting executive functions in frontal areas, which allows to scan choices and strategies, generate deliberation and solve on-going tasks.
Specifically, in the MCC (Fig. 7g, gray landscape) GABA-B-mediated long metastable states underlying long spiking timescales may contribute to the maintenance of ongoing strategies (Durstewitz et al., 2010; Enel et al., 2016; Stoll et al., 2016) and to the integration of outcome history (Kennerley et al., 2006; Meder et al., 2017; Seo and Lee, 2007; Tervo et al., 2014). At shorter timescales, short states might instantiate dynamic coding, flexible computations and rapid decision-making in the LPFC (Fig. 7g, blue landscape) (Rich and Wallis, 2016; Rigotti et al., 2013; Stokes, 2015). Short states may be lengthened in the LPFC when AHP is increased (Fig. 7g, orange landscape), favoring longer timescales and a global stabilization of, for instance, working memory processes (Cavanagh et al., 2018; Durstewitz and Seamans, 2008). Conversely, decreasing GABA-B destabilizes all long states in the MCC model, globally favoring fast transitions (Fig. 7g, orange landscape). This mechanism might contribute to abandon prior beliefs and to rapid search for adapted representations, e.g. in uncertain environments (Karlsson et al., 2012; Quilodran et al., 2008; Stoll et al., 2016). In the LPFC model with increased GABA-B or in the MCC model with decreased AHP, activity destabilizes certain long states, favoring transitions to remaining long states (Fig. 7g, pink landscape). Such a configuration might be relevant for flexible behaviors, directed exploration and switching (Durstewitz et al., 2010; Pasupathy and Miller, 2005; Russo et al., 2020; Stoll et al., 2016). Regulating GABA-B and AHP to dynamically adapt computations and temporal signatures could be achieved through neuromodulatory or fast plastic processes (Froemke, 2015; Satake et al., 2008).
Macroscopic gradients of inhibitions and excitations appear as important determinants of the large scale organization of cortical dynamics (Wang, 2020; Womelsdorf et al., 2014b). Our results indicate a complementary fundamental dual role of local inhibition in regulating state durations and stability on one hand, and setting the timing and direction of state transitions, on the other. Moreover, transitions can be easily triggered using very few inhibitory neurons. Our study suggests that interneurons and inhibition might be causal in error-driven state transitions in the MCC. Such transitions, initiated by FS neurons immediately after feedback onset, would allow escaping currently unsuccessful states, reaching alternatives or exploring new states.
In conclusion, we showed that local ionic and synaptic determinants specify the scale of temporal organization of activity in frontal cortical areas. These determinants might produce the particularly long states observed in monkey MCC dynamics and could explain its contribution to functions operating over extended behavioral periods. More generally, our results suggest that the diversity of spiking timescales observed across the cortical hierarchy reflects the local excitability- and synaptic inhibition-mediated regulation of metastability, which sets the temporal organization of computational processes.
18
Acknowledgement
This work was supported by the Medical Research Foundation (FRM) (Equipe DEQ20160334905, and VF: FDT201904008187), the French National Research Agency (DECCA ANR-10-SVSE4-1441 and PARABIST ANR-16-NEUC-0006-01), and was performed within the framework of the labex CORTEX ANR-11-LABX-0042 of Université de Lyon. EP is employed by the Centre National de la Recherche Scientifique. We thank C. Nay for administrative support and C. Wilson and J. Naudé for helpful discussions and proofreading the manuscript.
Author contributions
VF, FS and EP acquired and analyzed experimental data; VF, MS, BD and EP designed the analysis procedures; MS and BD designed, constrained, simulated models and analyzed modelling results; VF, FS, MS, BD and EP wrote the article.
Declaration of interests
The authors declare no conflict of interest.
Data availability
All spike time series from monkey recordings and scripts for temporal signatures extraction are freely accessible on the zenodo repository (https://doi.org/10.5281/zenodo.3947745). Scripts of computational models are available upon request.
References
Abeles, M., Bergman, H., Gat, I., Meilijson, I., Seidemann, E., Tishby, N., and Vaadia, E. (1995). Cortical activity flips among quasi-stationary states. Proceedings of the National Academy of Sciences 92, 8616–8620.
Beasley, T.M., Erickson, S., and Allison, D.B. (2009). Rank-based inverse normal transformations are increasingly used, but are they merited? Behav. Genet. 39, 580–595.
Beaulieu, C., Kisvarday, Z., Somogyi, P., Cynader, M., and Cowey, A. (1992). Quantitative distribution of gaba-immunopositive and -immunonegative neurons and synapses in the monkey striate cortex (area 17). Cerebral Cortex 2, 295–309.
Behrens, T.E.J., Woolrich, M.W., Walton, M.E., and Rushworth, M.F.S. (2007). Learning the value of information in an uncertain world. Nature Neuroscience 10, 1214–1221.
Bernacchia, A., Seo, H., Lee, D., and Wang, X.-J. (2011). A reservoir of time constants for memory traces in cortical neurons. Nature Neuroscience 14, 366–372.
Blom, G. (1958). Statistical Estimates and Transformed Beta-Variables (Wiley).
Brunel, N. (2000). Dynamics of sparsely connected networks of excitatory and inhibitory spiking neurons. J Comput Neurosci 8, 183–208.
Brunel, N., and Wang, X.J. (2001). Effects of neuromodulation in a cortical network model of object working memory dominated by recurrent inhibition. Journal of Computational Neuroscience 11, 63–85.
Cavanagh, S.E., Towers, J.P., Wallis, J.D., Hunt, L.T., and Kennerley, S.W. (2018). Reconciling persistent and dynamic hypotheses of working memory coding in prefrontal cortex. Nature Communications 9.
Chaudhuri, R., Bernacchia, A., and Wang, X.-J. (2014). A diversity of localized timescales in network activity. ELife 3, e01239.
19
Chaudhuri, R., Knoblauch, K., Gariel, M.-A., Kennedy, H., and Wang, X.-J. (2015). A Large-Scale Circuit Mechanism for Hierarchical Dynamical Processing in the Primate Cortex. Neuron 88, 419–431. Compte, A., Constantinidis, C., Tegnér, J., Raghavachari, S., Chafee, M.V., Goldman-Rakic, P.S., and
Wang, X.-J. (2003). Temporally Irregular Mnemonic Persistent Activity in Prefrontal Neurons of Monkeys During a Delayed Response Task. Journal of Neurophysiology 90, 3441–3454.
Dale, H. (1935). Pharmacology and Nerve-endings (Walter Ernest Dixon Memorial Lecture): (Section of Therapeutics and Pharmacology). Proc. R. Soc. Med. 28, 319–332.
Destexhe, A., and Paré, D. (1999). Impact of network activity on the integrative properties of neocortical pyramidal neurons in vivo. J. Neurophysiol. 81, 1531–1547.
Destexhe, A., Mainen, Z.F., and Sejnowski, T.J. (1998). Kinetic models of synaptic transmission. Methods in Neuronal Modeling 2, 1–25.
Destexhe, A., Rudolph, M., and Paré, D. (2003). The high-conductance state of neocortical neurons in vivo. Nat. Rev. Neurosci. 4, 739–751.
Durstewitz, D., and Seamans, J.K. (2008). The Dual-State Theory of Prefrontal Cortex Dopamine Function with Relevance to Catechol-O-Methyltransferase Genotypes and Schizophrenia. Biological Psychiatry 64, 739–749.
Durstewitz, D., Vittoz, N.M., Floresco, S.B., and Seamans, J.K. (2010). Abrupt Transitions between Prefrontal Neural Ensemble States Accompany Behavioral Transitions during Rule Learning. Neuron 66, 438–448.
Enel, P., Procyk, E., Quilodran, R., and Dominey, P.F. (2016). Reservoir Computing Properties of Neural Dynamics in Prefrontal Cortex. PLOS Computational Biology 12, e1004967.
Engel, T.A., Steinmetz, N.A., Gieselmann, M.A., Thiele, A., Moore, T., and Boahen, K. (2016). Selective modulation of cortical state during spatial attention. Science 354, 1140–1144.
Faber, E.S.L., and Sah, P. (2007). Functions of SK channels in central neurons. Clin. Exp. Pharmacol. Physiol. 34, 1077–1083.
Froemke, R.C. (2015). Plasticity of cortical excitatory-inhibitory balance. Annu. Rev. Neurosci. 38, 195–219.
Haj-Dahmane, S., and Andrade, R. (1997). Calcium-Activated Cation Nonselective Current Contributes to the Fast Afterdepolarization in Rat Prefrontal Cortex Neurons. Journal of Neurophysiology 78, 1983–1989.
Helton, T.D., Xu, W., and Lipscombe, D. (2005). Neuronal L-type calcium channels open quickly and are inhibited slowly. J. Neurosci. 25, 10247–10251.
Hennequin, G., Agnes, E.J., and Vogels, T.P. (2017). Inhibitory Plasticity: Balance, Control, and Codependence. Annu. Rev. Neurosci. 40, 557–579.
Hill, D.N., Mehta, S.B., and Kleinfeld, D. (2011). Quality metrics to accompany spike sorting of extracellular signals. J. Neurosci. 31, 8699–8705.
Jahr, C.E., and Stevens, C.F. (1990). Voltage dependence of NMDA-activated macroscopic conductances predicted by single-channel kinetics. The Journal of Neuroscience : The Official Journal of the Society for Neuroscience 10, 3178–3182.
Karlsson, M.P., Tervo, D.G.R., and Karpova, A.Y. (2012). Network Resets in Medial Prefrontal Cortex Mark the Onset of Behavioral Uncertainty. Science 338, 135–139.
Kennerley, S.W., Walton, M.E., Behrens, T.E.J., Buckley, M.J., and Rushworth, M.F.S. (2006). Optimal decision making and the anterior cingulate cortex. Nature Neuroscience 9, 940–947.
Kennerley, S.W., Dahmubed, A.F., Lara, A.H., and Wallis, J.D. (2009). Neurons in the Frontal Lobe Encode the Value of Multiple Decision Variables. Journal of Cognitive Neuroscience 21, 1162– 1178.
Khamassi, M., Quilodran, R., Enel, P., Dominey, P.F., and Procyk, E. (2015). Behavioral Regulation and the Modulation of Information Coding in the Lateral Prefrontal and Cingulate Cortex. Cerebral Cortex 25, 3197–3218.
Kolling, N., Scholl, J., Chekroud, A., Trier, H.A., and Rushworth, M.F.S. (2018). Prospection, Perseverance, and Insight in Sequential Behavior. Neuron 99, 1069-1082.e7.
20
La Camera, G., Fontanini, A., and Mazzucato, L. (2019). Cortical computations via metastable activity. Curr. Opin. Neurobiol. 58, 37–45.
Markov, N.T., Ercsey-Ravasz, M., Van Essen, D.C., Knoblauch, K., Toroczkai, Z., and Kennedy, H. (2013). Cortical High-Density Counterstream Architectures. Science 342, 1238406–1238406. Mazzucato, L., Fontanini, A., and La Camera, G. (2015). Dynamics of multistable states during ongoing
and evoked cortical activity. J. Neurosci. 35, 8214–8231.
Mazzucato, L., La Camera, G., and Fontanini, A. (2019). Expectation-induced modulation of metastable activity underlies faster coding of sensory stimuli. Nat. Neurosci. 22, 787–796. Medalla, M., and Barbas, H. (2009). Synapses with Inhibitory Neurons Differentiate Anterior
Cingulate from Dorsolateral Prefrontal Pathways Associated with Cognitive Control. Neuron 61, 609–620.
Medalla, M., Gilman, J.P., Wang, J.-Y., and Luebke, J.I. (2017). Strength and Diversity of Inhibitory Signaling Differentiates Primate Anterior Cingulate from Lateral Prefrontal Cortex. The Journal of Neuroscience 37, 4717–4734.
Meder, D., Kolling, N., Verhagen, L., Wittmann, M.K., Scholl, J., Madsen, K.H., Hulme, O.J., Behrens, T.E.J., and Rushworth, M.F.S. (2017). Simultaneous representation of a spectrum of dynamically changing value estimates during decision making. Nature Communications 8.
Murray, J.D., Bernacchia, A., Freedman, D.J., Romo, R., Wallis, J.D., Cai, X., Padoa-Schioppa, C., Pasternak, T., Seo, H., Lee, D., et al. (2014). A hierarchy of intrinsic timescales across primate cortex. Nature Neuroscience 17, 1661–1663.
Naudé, J., Paz, J.T., Berry, H., and Delord, B. (2012). A Theory of Rate Coding Control by Intrinsic Plasticity Effects. PLoS Comput Biol 8, e1002349.
Nowak, L.G., Azouz, R., Sanchez-Vives, M.V., Gray, C.M., and McCormick, D.A. (2003). Electrophysiological Classes of Cat Primary Visual Cortical Neurons In Vivo as Revealed by Quantitative Analyses. Journal of Neurophysiology 89, 1541–1566.
Palomero-Gallagher, N., Vogt, B.A., Schleicher, A., Mayberg, H.S., and Zilles, K. (2009). Receptor architecture of human cingulate cortex: Evaluation of the four-region neurobiological model. Human Brain Mapping 30, 2336–2355.
Papoutsi, A., Sidiropoulou, K., Cutsuridis, V., and Poirazi, P. (2013). Induction and modulation of persistent activity in a layer V PFC microcircuit model. Front Neural Circuits 7, 161.
Pasupathy, A., and Miller, E.K. (2005). Different time courses of learning-related activity in the prefrontal cortex and striatum. Nature 433, 873–876.
Pohle, J., Langrock, R., van Beest, F., and Schmidt, N.M. (2017). Selecting the Number of States in Hidden Markov Models - Pitfalls, Practical Challenges and Pragmatic Solutions. ArXiv:1701.08673 [q-Bio, Stat].
Quilodran, R., Rothé, M., and Procyk, E. (2008). Behavioral Shifts and Action Valuation in the Anterior Cingulate Cortex. Neuron 57, 314–325.
Ratté, S., Karnup, S., and Prescott, S.A. (2018). Nonlinear Relationship Between Spike-Dependent Calcium Influx and TRPC Channel Activation Enables Robust Persistent Spiking in Neurons of the Anterior Cingulate Cortex. J. Neurosci. 38, 1788–1801.
R_core_team (2014). R: A language and environment for statistical computing. R Foundation for Statistical Computing, Vienna, Austria. URL http://www.R-project.org/.
Rich, E.L., and Wallis, J.D. (2016). Decoding subjective decisions from orbitofrontal cortex. Nat. Neurosci. 19, 973–980.
Rigotti, M., Barak, O., Warden, M.R., Wang, X.J., Daw, N.D., Miller, E.K., and Fusi, S. (2013). The importance of mixed selectivity in complex cognitive tasks. Nature 497, 585–590.
Ritter-Makinson, S., Clemente-Perez, A., Higashikubo, B., Cho, F.S., Holden, S.S., Bennett, E., Chkhaidze, A., Eelkman Rooda, O.H.J., Cornet, M.-C., Hoebeek, F.E., et al. (2019). Augmented Reticular Thalamic Bursting and Seizures in Scn1a-Dravet Syndrome. Cell Rep 26, 1071. Rodriguez, G., Sarazin, M., Clemente, A., Holden, S., Paz, J.T., and Delord, B. (2018). Conditional
Bistability, a Generic Cellular Mnemonic Mechanism for Robust and Flexible Working Memory Computations. J. Neurosci. 38, 5209–5219.
21
Rothe, M., Quilodran, R., Sallet, J., and Procyk, E. (2011). Coordination of High Gamma Activity in Anterior Cingulate and Lateral Prefrontal Cortical Areas during Adaptation. Journal of
Neuroscience 31, 11110–11117.
Russo, E., Ma, T., Spanagel, R., Durstewitz, D., Toutounji, H., and Köhr, G. (2020). Coordinated prefrontal state transition leads extinction of reward-seeking behaviors. BioRxiv
2020.02.26.964510.
Satake, T., Mitani, H., Nakagome, K., and Kaneko, K. (2008). Individual and additive effects of
neuromodulators on the slow components of afterhyperpolarization currents in layer V pyramidal cells of the rat medial prefrontal cortex. Brain Res. 1229, 47–60.
Seidemann, E., Meilijson, I., Abeles, M., Bergman, H., and Vaadia, E. (1996). Simultaneously recorded single units in the frontal cortex go through sequences of discrete and stable states in monkeys performing a delayed localization task. J. Neurosci. 16, 752–768.
Seo, H., and Lee, D. (2007). Temporal filtering of reward signals in the dorsal anterior cingulate cortex during a mixed-strategy game. The Journal of Neuroscience : The Official Journal of the Society for Neuroscience 27, 8366–8377.
Song, S., Sjöström, P.J., Reigl, M., Nelson, S., and Chklovskii, D.B. (2005). Highly Nonrandom Features of Synaptic Connectivity in Local Cortical Circuits. PLOS Biology 3, e68.
Stokes, M.G. (2015). “Activity-silent” working memory in prefrontal cortex: a dynamic coding framework. Trends Cogn. Sci. (Regul. Ed.) 19, 394–405.
Stoll, F.M., Fontanier, V., and Procyk, E. (2016). Specific frontal neural dynamics contribute to decisions to check. Nature Communications 7, 11990.
Taghia, J., Cai, W., Ryali, S., Kochalka, J., Nicholas, J., Chen, T., and Menon, V. (2018). Uncovering hidden brain state dynamics that regulate performance and decision-making during cognition. Nat Commun 9, 2505.
Tervo, D.G.R., Proskurin, M., Manakov, M., Kabra, M., Vollmer, A., Branson, K., and Karpova, A.Y. (2014). Behavioral Variability through Stochastic Choice and Its Gating by Anterior Cingulate Cortex. Cell 159, 21–32.
Thomson, A.M. (2002). Synaptic Connections and Small Circuits Involving Excitatory and Inhibitory Neurons in Layers 2-5 of Adult Rat and Cat Neocortex: Triple Intracellular Recordings and Biocytin Labelling In Vitro. Cerebral Cortex 12, 936–953.
Thuault, S.J., Malleret, G., Constantinople, C.M., Nicholls, R., Chen, I., Zhu, J., Panteleyev, A., Vronskaya, S., Nolan, M.F., Bruno, R., et al. (2013). Prefrontal cortex HCN1 channels enable intrinsic persistent neural firing and executive memory function. J. Neurosci. 33, 13583–13599. Villalobos, C., Shakkottai, V.G., Chandy, K.G., Michelhaugh, S.K., and Andrade, R. (2004). SKCa
channels mediate the medium but not the slow calcium-activated afterhyperpolarization in cortical neurons. J. Neurosci. 24, 3537–3542.
Wang, X.-J. (2020). Macroscopic gradients of synaptic excitation and inhibition in the neocortex. Nat. Rev. Neurosci. 21, 169–178.
Wang, H., Stradtman, G.G., Wang, X.-J., and Gao, W.-J. (2008). A specialized NMDA receptor function in layer 5 recurrent microcircuitry of the adult rat prefrontal cortex. PNAS.
Wasmuht, D.F., Spaak, E., Buschman, T.J., Miller, E.K., and Stokes, M.G. (2018). Intrinsic neuronal dynamics predict distinct functional roles during working memory. Nat Commun 9, 3499.
Womelsdorf, T., Ardid, S., Everling, S., and Valiante, T.A. (2014a). Burst firing synchronizes prefrontal and anterior cingulate cortex during attentional control. Current Biology : CB 24, 2613–2621. Womelsdorf, T., Valiante, T.A., Sahin, N.T., Miller, K.J., and Tiesinga, P. (2014b). Dynamic circuit
motifs underlying rhythmic gain control, gating and integration. Nature Neuroscience 17, 1031– 1039.
Xue, M., Atallah, B.V., and Scanziani, M. (2014). Equalizing excitation–inhibition ratios across visual cortical neurons. Nature 511, 596–600.
Xydas, D., Downes, J.H., Spencer, M.C., Hammond, M.W., Nasuto, S.J., Whalley, B.J., Becerra, V.M., and Warwick, K. (2011). Revealing ensemble state transition patterns in multi-electrode neuronal recordings using hidden Markov models. IEEE Trans Neural Syst Rehabil Eng 19, 345–355.
22
Zilles, K., and Palomero-Gallagher, N. (2017). Multiple Transmitter Receptors in Regions and Layers of the Human Cerebral Cortex. Front Neuroanat 11, 78.
23
FIGURE LEGENDS
Figure 1. Midcingulate cortex (MCC) and lateral prefrontal cortex (LPFC) spike count autocorrelograms. (a)
Population exponential fit: autocorrelograms were computed for each unit and the fit was performed on all the units of each area (as in Murray et al. 2014). (b) Single unit fits were used to capture individual spiking timescales and produce the distribution of TAU values for each region. Dotted lines represent the median of TAU. (c) Clustering of spike shape. We extracted spike width and valley to peak ratio (V2P) from each unit average waveform. A hierarchical clustering led to 3 groups of units (colored groups RS1, RS2, FS). In the paper, units with narrow spike width were termed as fast spiking (FS), whereas units with broader waveform were marked as regular spiking (RS: RS1 + RS2). The histogram indicates the number of MCC and LPFC units belonging to each of the 3 clusters.
24
Figure 2. Spike autocorrelogram and temporal signatures in MCC and LPFC. (a) 3 single
examples of spike count (purple) versus normalized spike autocorrelograms (green) contrasting the outcome of the 2 methods. The measured time constant (TAU) is indicated for both when possible. Numbers of spikes used for each method is also indicated. (b) TAU values extracted from each methods are significantly correlated (spearman rho(282) = 0.46,p<10-15). (c) Distributions of TAUs (upper histograms) and peak latencies (LAT - lower histogram) for FS (left) and RS (right) units. ‘n’ indicates the number of units. TAU values were longer in MCC than in LPFC for both FS and RS (linear model fit on BLOM transformed TAU for normality, TAU = Region * Unit type, Region: t=-4.68, p<10-6, Unit type: ns, interaction: ns). Peak latencies significantly differed between MCC and LPFC for RS but not for FS units (medians: MCC FS= 48.5 ms, RS= 102.0 ms , LPFC FS= 48.5 ms , RS= 51.8 ms ; linear model fit on BLOM transformed Latency for normality, Latency = Region * Unit type, interaction: t-value=-3.57, p< 10-3).
25
Figure 3. Behavioral engagement in task and spiking timescale changes. (a) Schematic representation of the
task. At the start of each trial, animals can either initiate a delayed response task (WORK option) which can lead to 1 reward delivery, or use the CHECK option to check the current size of the gauge (or collect the bonus reward). Each reward in the task contributes to increase the gauge size and bring the bonus availability closer. The graph (right) schematized the speed of increase of the gauge size which varies between blocks (fast or slow blocks). (b) Boxplots of indices for each unit type and region calculated to estimate potential changes in TAU between Engage and Pause (left), and between empty and full gauge (right). TAUs increased in Engage vs. Pause only for MCC RS units.
26
Figure 4. Encoding of feedback and gauge size for different unit types and spiking timescales and rostro-caudal distribution. (a) Estimates (-coefficients) obtained from the MCC (grey) and LPFC (blue) unit
populations obtained from time-resolved glmm for Feedback (reward vs no reward; top graphs) and Gauge size (bottom) (see ‘Group analyses using glmm’ in Methods). Estimates are obtained at successive time points covering the entire inter-trial period between feedback onset and the lever onset in the following trial. Significant effects are indicated by a red triangle (p<0.05 corrected), shadings indicate standard deviations. Positive values depict a population activity bias towards negative feedback (top) and positive slope of linear coding for gauge size (bottom). Data is presented for FS and RS units (left and right respectively for each panel) and have been performed on subpopulation with short or long TAU values (determined by a median split). Short and long TAU populations are represented by light and dark color intensity. Note in particular the dissociation for RS MCC units with short and long TAU respectively coding for feedback and gauge size. (b) Averaged TAU values along the postero-anterior axis in the MCC and LPFC, for both monkeys. (c). Estimates reflecting coding strength of Feedback and Gauge size for MCC unit populations separated by their rostro-caudal location.