HAL Id: hal-02989952
https://hal.archives-ouvertes.fr/hal-02989952
Submitted on 13 Nov 2020
HAL is a multi-disciplinary open access
archive for the deposit and dissemination of
sci-entific research documents, whether they are
pub-lished or not. The documents may come from
teaching and research institutions in France or
abroad, or from public or private research centers.
L’archive ouverte pluridisciplinaire HAL, est
destinée au dépôt et à la diffusion de documents
scientifiques de niveau recherche, publiés ou non,
émanant des établissements d’enseignement et de
recherche français ou étrangers, des laboratoires
publics ou privés.
RuO 4 and its influence on magnetic order
K. Jenni, F. Wirth, K. Dietrich, L. Berger, Yvan Sidis, S. Kunkemöller, C.
Grams, D. Khomskii, J. Hemberger, M. Braden
To cite this version:
K. Jenni, F. Wirth, K. Dietrich, L. Berger, Yvan Sidis, et al.. Evidence for current-induced phase
coexistence in Ca 2 RuO 4 and its influence on magnetic order. Physical Review Materials, American
Physical Society, 2020, 4 (8), �10.1103/PhysRevMaterials.4.085001�. �hal-02989952�
magnetic order
K. Jenni,1 F. Wirth,1 K. Dietrich,1 L. Berger,1 Y. Sidis,2 S. Kunkem¨oller,1
C. P. Grams,1 D. I. Khomskii,1 J. Hemberger,1 and M. Braden1, ∗
1
II. Physikalisches Institut, Universit¨at zu K¨oln, Z¨ulpicher Str. 77, D-50937 K¨oln, Germany
2Laboratoire L´eon Brillouin, C.E.A./C.N.R.S., F-91191 Gif-sur-Yvette CEDEX, France
(Dated: July 2, 2020)
Combining quasistatic and time-resolved transport measurements with X-ray and neutron diffrac-tion experiments we study the non-equilibrium states that arise in pure and in Ti substituted
Ca2RuO4 under the application of current densities. Time-resolved studies of the current-induced
switching find a slow conductance relaxation that can be identified with heating and a fast one that unambiguously proves an intrinsic mechanism. The current-induced phase transition leads to complex diffraction patterns. Separated Bragg reflections that can be associated with the metallic and insulating phases by their lattice parameters, indicate a real structure with phase coexistence that strongly varies with temperature and current strength. A third contribution with a c lattice constant in between those of metallic and insulating phases appears upon cooling. At low current densities, this additional phase appears below ∼100 K and is accompanied by a suppression of the antiferromagnetic order that otherwise can coexist with current carrying states. A possible origin of the intermediate phase is discussed.
INTRODUCTION
The interaction of magnetic, orbital, and lattice de-grees of freedom in strongly correlated electron materials frequently leads to the competition of different phases. As a result small external stimuli can trigger phase tran-sitions and exotic quantum states. Especially the elec-tric control of non-thermal phase transitions is of wide interest in view of possible applications [1, 2]. It is, how-ever, very difficult to establish a true non-equilibrium character of a new phase and to fully exclude Joule heat-ing or microscopic phase separation, which were shown to be relevant in many 3d transition-metal oxides [3, 4]. For electric-field induced phenomena it was shown that the motion of defects can be essential [5, 6]. Therefore, a thorough understanding of the transition mechanisms is essential for the interpretation of any non-equilibrium phase.
In this paper, we investigate the antiferromagnetic (AFM) Mott insulator Ca2RuO4, which is a ”bad metal”
(with low conductance) at high temperatures in thermal equilibrium and which transforms into a Mott insula-tor upon cooling below 357 K [7–9]. The metal-insulainsula-tor transition is accompanied by strong structural changes [10–12]. At the transition the c lattice parameter shrinks and in-plane parameters elongate, coupled with a transi-tion from elongated RuO6octahedra at high temperature
to flattened octahedra in the insulating state. This seems to be the essential element to change the orbital occupa-tion and to induce insulating behavior [13, 14]. But upon cooling also the tilting of the RuO6 octahedra increases
and the octahedron basal plane becomes elongated along the orthorhombic b direction [10–12]. This latter distor-tion seems to pin the magnetic moment parallel to the b axis [15]. The strong structural changes are not restricted
to the metal-insulator transition at 357 K but extend over a large temperature interval down to about the onset of AFM order at TN=110 K. Note, that Ca2RuO4 is a
lay-ered material resulting in rather low three-dimensional AFM ordering temperatures.
Besides by heating, the metal-insulator transition can be induced by applying hydrostatic pressure above 0.5 GPa [12, 16], by substitution for example with Sr [17] and by applying an electric field [18]. The electric field needed to drive the phase transition is unusually small (E = 40 V/cm) compared to the Mott energy gap; it is about two orders of magnitude below a typical break-through field of a Mott insulator [19, 20]. Following this discovery [18] several other studies have confirmed current-induced quasi-metallic states in Ca2RuO4[21–
24]. In particular, by using a non-contact infrared ther-mometer it was shown that the metallic phase can be sta-bilized by an external current at a sample temperature well below the metal-insulator transition [23]. The low-temperature observation of the quasi-metallic states sug-gests a truly electric mechanism and thus excludes Joule heating of the entire sample as the origin [21–23]. How-ever, if the sample becomes inhomogeneous and splits in metallic and insulating parts the heating becomes inho-mogeneous as well. Local heating remains a problematic issue in almost all experimental studies.
It was reported that Ca2RuO4 exhibits strong
diamag-netism and anomalous transport properties [21] at mod-erate current densities of 1 to 2 A/cm2, but the same
group recently showed that the strong diamagnetism is an experimental artefact [25]. At low temperature the mag-netoresistance turns negative and the Hall coefficient ex-hibits a sign change[21]. Strong diamagnetism contrasts with the ferromagnetic or quasiferromagnetic instabili-ties reported for the metallic phases reached by applying
pressure or by substitution [12, 16, 26, 27].
For moderate current densities, nano-imaging optical techniques report nano-stripe structured areas of phase coexistence with different optical reflectivity [24]. This documents that the real structure of current carrying Ca2RuO4 can be non-homogeneous. Diffraction
ex-periments at a high current density of 10 A/cm2 pro-posed new structural phases in a current carrying sample [28], but the crystal structures strongly resemble those Ca2RuO4 exhibits at higher temperatures and pressure
[10–12]. Other diffraction experiments on a crystal with 3% Mn substitution report evidence for a modified or-bital arrangement [29]. The latter study, furthermore, does not find any evidence for strong diamagnetism.
Here we report transport and single-crystal diffraction studies using neutron and X-ray radiation. The diffrac-tion experiments with a careful recording of the sam-ple temperature indicate comsam-plex phase coexistence of at least three different phases distinguished by different c lattice parameters. In particular at low current den-sities, in addition to the initial metallic and insulating phases an additional component appears.
EXPERIMENTAL
Single crystals of Ca2RuO4were grown by the
floating-zone technique and characterized by resistivity and mag-netization measurements [15, 30]. Due to the metal-insulator transition at 357 K and the accompanied struc-tural transition the crystals tend to shatter into mm sized pieces upon cooling to room temperature in the furnace. A small amount of 1% Ti substitution broadens the tran-sition, which can result in large single crystals of up to 1 cm3volume. Additionally and more importantly for this
study, Ti-substituted crystals permit to pass the metal-insulator transition several times without destroying the sample. The magnetism is not strongly influenced by the Ti, since it is isovalent to Ru and nonmagnetic [30]. In the experiments presented here crystals containing 1% of Ti and pure ones were used. For the application of the DC current in the quasistatic conductance and in the diffraction experiments, the plate-shaped crystals were glued to a copper plate using conductive silver paste. The ab planes are parallel to the plate. The copper plate as well as the sample were contacted with copper wires, resulting in a current direction parallel to the c axis. We choose this current direction, because it offers the best conditions for thermalizing the sample thereby reducing heating issues. In addition cracking of the sample in thin plates parallel to current is suppressed
Time-resolved pulsed transport measurements were performed in a high bandwidth coaxial setup suitable for frequencies up to the GHz range employing a cur-rent source [Keithley 2400] together with a 200 MHz oscilloscope [Agilent U2702A] and a fast pre-amplifier
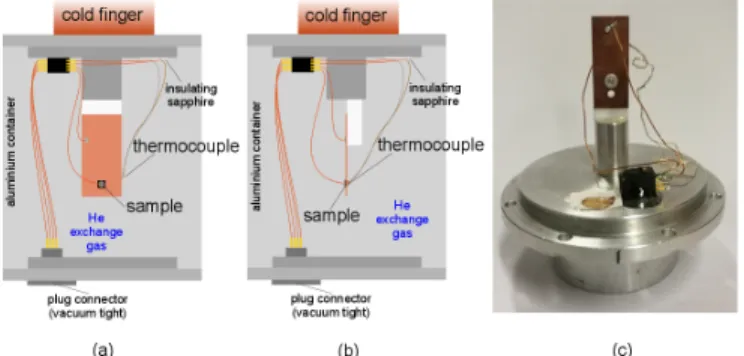
FIG. 1. Illustration of the experimental setup to perform
X-ray and neutron diffraction experiments on Ca2RuO4 with
a current flowing parallel to the crystallographic c direction (perpendicular to the Ru layers). Note, that the thermal cou-ple opposite to the samcou-ple crystal allows for improved esti-mate of the sample temperature.
[StanfordResearch 560]. The time-resolved temper-ature measurements were performed using a fast, thin (250 µm) foil-type thermocouple [T-type] with a response time in the millisecond range. The sample was prepared as small platelet with a thickness of 0.5 mm and a cross section of 0.8 mm2 covered with silver electrodes.
The X-ray diffraction (XRD) experiments were con-ducted on a D5000 powder diffractometer using Cu Kα
radiation equipped with a Helium cryostat where the sample chamber is cooled by He flow. Thermal con-tact to the single crystalline samples is guaranteed by the exchange gas inside the chamber. For the neutron diffraction experiments the sample setup was incorpo-rated into a sealed aluminum can including He exchange gas and a vacuum tight connector. The can was then cooled using closed-cycle refrigerators. The elastic neu-tron scattering experiments were performed at the ther-mal two-axis diffractometer 3T1 at the Laboratoire L´eon Brillouin (LLB). Neutrons with a wavelength of 2.4 ˚A were extracted by a vertically focusing pyrolithic graphite (002) monochromator. In order to achieve the high reso-lution required to distinguish the different contributions in Ca2RuO4 we used collimations of 15’ and 10’ before
monochromator and detector, respectively, and higher order contaminations were suppressed with a pyrolithic graphite filter. To apply the current and to read the volt-age generated by the thermocouple a [Keithley 2400] source meter and a [Keithley 2128] nanovoltmeter were used.
To monitor the sample temperature as exactly as pos-sible in the neutron experiment one contact of a thermal couple was placed on the backside of the 0.5 mm thick copper plate, precisely at the sample position. As the reference temperature of the thermocouple the cryostat sensor was used, so that we can precisely determine the temperature at the sample position. The experimental mounting used in most of the neutron experiments is shown in Fig. 1. In the X-ray diffraction experiment the
FIG. 2. Switching characteristics of pure and 1%
Ti-substituted Ca2RuO4in dependency of temperature. (a)-(f)
Characteristic j-E curves display the current-induced phase transition in a voltage controlled setup (The electric field has been corrected for the circuit resistance effects). Here red coloring denotes data taken for ramping the voltage up and blue for ramping down. (g)-(h) The calculated resistivities from the two-point measurements above show a clear drop at a temperature dependent critical electric field. (i) and (j) represent the corresponding power densities in the j-E charac-teristic. The threshold power density, at which the switching occurs, is constant for all measured temperatures. Dark col-oring is used for the up direction, light colcol-oring for the down direction.
thermocouple had to be mounted at the same side of the copper plate at a distance of 2 mm from the crystal.
RESULTS
Quasi-static transport studies of the insulator metal transition
Nakamura et al. [18] found that the insulator-metal transition in Ca2RuO4can be induced when applying an
electric field of E = 40 V/cm at room temperature. At this field the sample resistance drops leading to a jump in current density j. For the transport studies we use a two-contact circuit with a finite pre-resistance that lim-its the current when the samples becomes metallic, and we drive the sample with controlled voltage. In con-trast, for the temperature-dependent diffraction studies we drive the crystal by controlling the current, as oth-erwise the current would strongly change with temper-ature. When ramping the current up in the current-controlled mode the electronics regulates the voltage to reach the demanded current and initially exceeds the crit-ical voltage or electric field and thus enforces the par-tial insulator-metal transition. We confirm the current-induced insulator-metal transition [18] in both samples, pure and Ti substituted ones, with critical electric fields of the same order (Fig. 2). The critical field denotes the value, at which the material changes from insulating to conducting characteristics. Upon cooling the sample re-sistivity increases and the critical electric field increases as well [Fig. 2(g),(h)] similar to reports in [18, 31]. The more insulating the sample becomes, the higher fields are necessary to transform it to the metallic state. For this reason any changes of current or voltage in the XRD and neutron experiments were applied above 250 K, where the samples are still conductive enough and where stronger cooling power is provided.
While the critical electric field increases, the criti-cal current density decreases with decreasing tempera-ture. The resulting critical power density does not ex-hibit a temperature dependence but stays constant for the measured temperature range between 220 and 300 K [Fig. 2(i), (j)]. which indicates that the current-induced insulator-metal transition is not simply due to heating of the entire crystal. Many aspects of the electric-field-driven insulator-metal transition in Ca2RuO4 resemble
that in VO2, for which it was also reported that the
threshold power density does not vary with temperature [32]. Both Ca2RuO4 samples, pure and substituted ones,
show comparable switching behavior. The substituted sample exhibits a slightly lower resistivity which is con-nected to higher critical current densities. The thresh-old electrical power density is therefore more than a fac-tor two higher than that in the pure sample. [Fig. 2(i), (j)]. Nevertheless the Ti substitution does not effect the current-induced insulator-metal transition significantly, for which reason the substitution can be disregarded for the following analysis of results.
The form of the j-E characteristic, see Fig. 2, that has consistently been reported by many groups [18, 23, 31] inevitably leads to the formation of inhomogeneous current-carrying states. This effect has been shown on general grounds, and it is well known in the physics of semiconductors [33] that the state with negative differ-ential resistance dVdI < 0 is absolutely unstable. There-fore, the S-shaped j-E (or I-V ) characteristic leads to
the formation of filaments predominantly parallel to the current (but in real system usually forming a percolation network), whereas the N-shaped I-V curve results in the formation of insulating and metallic domains (Gunn do-mains) perpendicular to the current (Gunn domains usu-ally move with current leading to the oscillating behavior - Gunn oscillations). The formation of metallic filaments in an insulating matrix is well documented in many sys-tems with insulator-metal transitions, notably in VO2
[32, 34–36] and in SrTiO3[37]; they lead to a
percola-tion picture of conducpercola-tion and to switching phenomena. Due to the impact of strain, however, the arrangement of the metallic parts can essentially change, see discussion below.
As a result of the inhomogeneous state the current is predominantly concentrated in narrow metallic channels, in which the local current density is much higher than the average one, so that the local Joule heating jEV = ρj2
(in the current-controlled regime, as used in most experi-ments) and the resulting local temperature in the current carrying parts will also be higher than that estimated by bulk probes. The question whether the metal-insulator switching often observed in systems with metal-insulator transition is due to intrinsic effects or caused by local heating is difficult to answer.
Time-resolved analysis of the current-induced insulator-metal transition
In order to elucidate the question what induces the rise in conductivity, the electric field connected to the forced current or simple Joule heating, we performed time-resolved pulsed experiments as illustrated in Fig. 3. Most likely one has to consider phase separation into an insulating and a percolating phase carrying most of the current. The idea of the time-resolved study is to disen-tangle time scales of a field-driven switching process and of presumably unavoidable heating effects.
The upper panel of Fig. 3 displays the pulse pattern used to induce additional conductivity. Switching-on a smaller current of about 3 A/cm2 leads to a
mono-exponential drop in resistivity (middle panel) of about 15% with a slow time constant of τR = 570 ms. At
the same time the sample temperature rises with a sim-ilar time constant saturating 3.2 K above the starting value of 298 K. Obviously, the resistivity changes in this below-threshold regime are coupled to the heating. Af-ter switching-off the current at t = 3 s the temperature decays to 298 K again. Considering a power dissipation of about ρj2 ≈15 W/cm3, and thus still of the order of
6 mW in the sample crystal even for this smaller driv-ing current, such heatdriv-ing has to be expected. The red curves in Fig. 3 denote results for the larger driving cur-rent of 15 A/cm2. Here a small base current of 1 A/cm2
is applied before and after the pulse to enable the
deter-0 1 2 3 0 1 0
j
(A
/c
m
2)
3 0 0 K
τT D = 7 2 0 m s τR D = 9 1 5 m sρ
(Ω
c
m
)
τR = 5 7 0 m s τR 1 = 6 0 m s τR 2 = 3 3 0 m s 0 1 2 3 4 5 6 0 1 0 2 0 3 0∆
T
(
K
)
t ( s )
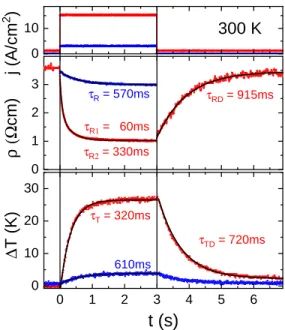
τT = 3 2 0 m s 6 1 0 m sFIG. 3. Pulsed current measurements of sample
resistiv-ity (middle panel) and temperature (bottom) in Ca2RuO4.
For driving currents below the threshold (3 A/cm2, blue, top
panel) the resulting change in ρ can be modeled with an mono-exponential decay with a decay time similar to the rise time found for the concomitant heating (bottom panel).
For larger driving currents above the threshold (15 A/cm2,
red, top panel) the change in ρ only can be modeled em-ploying a bi-exponential decay: A slowly relaxing component
τR2 ≈ 300 ms in accord with the rise time of temperature
(bottom) and a significantly faster process with τR1≈ 60 ms,
which seems to be directly induced via the current or, corre-spondingly, via the electric field.
mination of the resistivity in these regimes. The drop in resistivity now amounts up to 70% but it is not possible to describe the underlying time dependence using only one relaxation time. A bi-exponential fit reveals a much faster decay time of τR1≈ 60 ms, together with a slower
one of τR2≈ 330 ms. The latter is in accord with the
cor-responding rise time of the temperature (bottom). The faster process seems not to be induced by simple heating (even though a considerable increase in temperature of up to 28 K can be monitored). This second mechanism has to be attributed to the direct induction of a more con-ductive phase via the current or, correspondingly, via the electric field. It is interesting to note that after switching-off this larger driving current, the electrical relaxation time exceeds the thermal one. The field-induced phase appears to be metastable which is in accord with the ob-served hysteresis in the j-E curves, see [18] and Fig. 2.
The observation of two relaxation rates in the resis-tance unambiguously confirms an intrinsic origin of the current induced switching. There are several processes that can be associated with the faster conductance en-hancement, such as a purely electronic mechanism or fil-ament formation. The fact that even this faster process
happens on a time scale above milliseconds suggest some structural implication.
X-ray and neutron diffraction studies as function of current density and temperature
Since the metallic and insulating phases in Ca2RuO4differ strongly in their lattice constants,
diffraction is a suitable experimental technique to investigate phase changes in this material. Especially the lattice parameter c strongly increases by ≈ 3% between the insulating phase at room temperature and the metallic phase at ∼360 K [10, 11], which allows one to distinguish these two phases. However, a good resolution is required in neutron diffraction experiments. One expects to observe (00L) reflections at lower 2θ values when the material becomes metallic. The metallic phase (MP) of Ca2RuO4 was initially labeled as L phase
due to its longer c axis, while the insulating phase (IP) is frequently labeled as S (for short) phase [7, 10].
As described above, switching the Ca2RuO4crystals
from the insulating to the metallic state involves large power densities. Note that a power density of 100 W/cm3
would result in a temperature drift of 36 K/s for a ma-terial without any thermal contact just by taking the specific heat into account [38]. As illustrated in the time-resolved experiments, heating of the sample during the diffraction studies cannot be completely avoided and must be carefully taken into consideration. The contro-versial diffraction results [18, 28, 29, 31] most likely stem from differing heating conditions. With an additional sensor placed close to the crystal and with the good elec-tric and thermal contact of the sample to a large Cu plate heating effects could be reduced and better documented in most of our experiments.
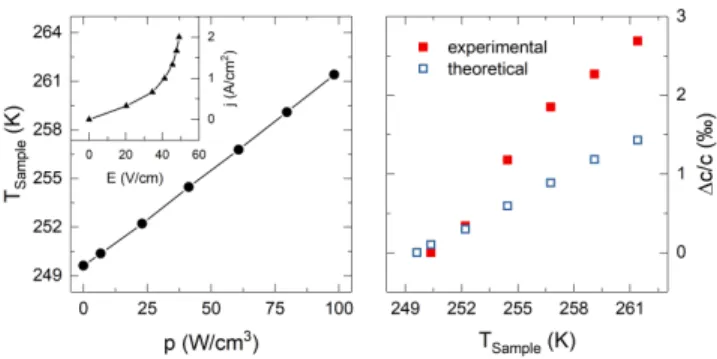
FIG. 4. Sample temperature (thermocouple) in comparison to power density and relative lattice change while ramping up current at the fixed cryostat temperature of 250 K. The purely temperature-driven relative lattice change (open squares) is taken from [11] for the given temperature range. The exper-imental lattice change is derived from the (006) reflection in the neutron diffraction experiment.
As a first example, we show the ramping up of the cur-rent density in a neutron diffraction experiment in Fig. 4. The cryostat temperature was set to 250 K, which is ad-vantageous compared to simple experiments at ambient conditions, because it provides strong cooling power. The thermocouple with its sensor placed opposite to the crys-tal on the Cu plate shows that heating occurs even at these rather low current densities. Note that the thermo-couple can only give a lower estimate of the true sample temperature. Similar to several other studies we observe an increase of the c lattice parameter of the insulating phase. Half of this can be attributed to the temperature change detected in the thermal couple and thus to heat-ing of the entire sample, but most likely an even larger part of the c parameter enhancement is simply due to heating. In the scenario of phase separation the metallic parts will sense even higher local heating.
Some studies seem to partially ignore the heating and report an important intrinsic change of the insulating phase with small currents, a modified short-c phase. However, this modified short-c phase in Ref. [28] ex-hibits a c lattice constant increase just up to the maxi-mum value that the insulating Ca2RuO4 phase reaches
upon heating without a current (before the insulator-metal transition takes place at 357 K). Furthermore, the modified short-c phase proposed at 130 K with a large current density of 10 A/cm2 perfectly agrees with
the current-free insulating phase at the temperature of 240 K: The lattice constants reported in [28] amount to a=5.404, b=5.547, and c=11.848 ˚A compared to a=5.407, b=5.560, and c=11.854 ˚A for current-free Ca2RuO4 at
240 K, taken from [11], and also the internal parameters perfectly agree [39].
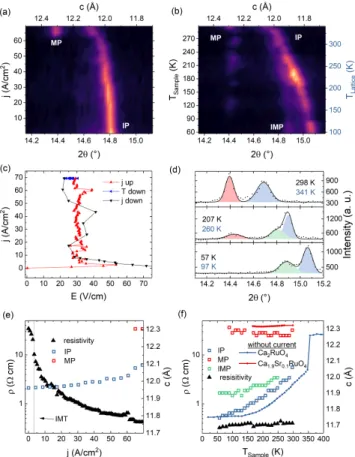
XRD experiments with a Ti-free sample show a sec-ond (002) reflection appearing when the current density is increased to j = 69 A/cm2 at a temperature of 294 K
[Fig. 5 (a)]. Note, however, that the sample was already mounted into a cryostat and temperature stabilized in order to reduce the local heating. The characteristic j-E curve [Fig. 5(c)] and the resistivity [Fig. 5(e)] in-dicate that the sample becomes already conductive at much lower current densities (≈ 2.6 A/cm2), where no
significant change in the diffraction pattern is observable [Fig. 5(a)]. At high temperature, the Bragg reflection associated with the metallic phase exhibits a similar in-tensity as that of the insulating phase, but it becomes rapidly weaker upon cooling [Fig. 5(b),(d)] in spite of the rather large current flowing. The c lattice parameter of the metallic phase stays constant upon cooling in agree-ment with measureagree-ments on Sr-substituted materials, in which the metal-insulator transition occurs at lower tem-peratures [11] Fig. 5(f)]. The 2θ value of the Bragg peak associated with the insulating phase increases upon cool-ing followcool-ing the pronounced shortencool-ing of the c lattice parameter of the insulating phase at low temperature. The cryostat temperature has been corrected by the
off-FIG. 5. X-ray diffraction study of the (002) reflection
un-der an applied current density of up to j = 69 A/cm2 on pure
Ca2RuO4. Panels (a) and (b) show the evolution of different
phases characterized by different c lattice parameters while ramping up current and cooling down with constant current, respectively. The coexistence of phases, visible in the three
reflections, is strongly temperature dependent. (c) The
j-E curve is measured simultaneously to the XRD experiment while ramping up current, cooling down and decreasing the current. (d) The quantitative analysis of 2θ scans clearly
dis-plays the phase mixture of three phases. Here the
metal-lic (MP) and insulating (IP) phase are colored in red and blue, respectively. The third phase is colored in green and is
labeled as intermediate phase (IMP). TSample (black)
repre-sents the cryostat temperature corrected by the thermocouple
while TLattice (blue) is calculated by comparing the
reflec-tion angle of insulating phase with the temperature depen-dency of a current free sample, taken from [11], i.e. ignoring any intrinsic change. (e),(f) Resistivity and lattice parameter in dependence to current density and sample temperature, respectively. The resistivity displays the occurrence of the insulator-metal transition long before the metallic phase be-comes visible in the XRD measurement (e) and the decreasing resistivity while cooling down coincides with the phase exis-tence of the intermediate phase (f). The temperature
depen-dency of c lattice parameter of Ca2RuO4, from [11], is added
for comparison. The low temperature lattice parameter of the
metallic phase (red line) is taken from data of Ca1.9Sr0.1RuO4
from the same reference.
set indicated by the thermal couple scaled by a factor 2.5 in order to take the slight displacement of the
thermo-couple in the X-ray diffraction experiment into account. Nevertheless the observed c values of the insulating phase lie above the reported temperature dependence of the in-sulating phase without any current [Fig. 5(f)]. At high temperature, the insulating phase reflection exhibits sig-nificant broadening, see Fig. 5(d), which can be easily recognized from the comparison with the metallic phase peak [Fig. 5(d)]. Below ∼260 K a third reflection ap-pears that unambiguously indicates phase coexistence of at least three phases with different c lattice parameters: besides the insulating phase (IP) and the metallic phase (MP) there is an intermediate phase (IMP), see Fig. 5(d).
FIG. 6. Evolution of c lattice parameter recorded by elas-tic neutron scattering in a measuring sequence of increasing current (a), decreasing temperature (b), increasing tempera-ture (c), and decreasing current (d). Longitudinal scans are
taken across the (006) reflection in pure Ca2RuO4at
vari-ous current densities and temperatures. The blue circles
rep-resent the temperature dependency of Ca2RuO4 lattice
pa-rameters without current, taken from [11] and is used to
de-termine TLattice from the experimental lattice parameter of
the insulating phase. The low temperature lattice parame-ter of the metallic phase (red balls) is taken from data of
Ca1.9Sr0.1RuO4 from the same reference and plotted against
TLattice. The small grey dots represent the measured points
and the color maps are obtained with an interpolation al-gorithm.(e) The j-E curve is measured simultaneously to the neutron diffraction experiment while ramping up current, cooling down, heating up and decreasing the current. (f) Sam-ple resistivity is derived from the two-point measurement and displayed for the measurement sequence.
neu-FIG. 7. Mapping of reflections around (006) Bragg peak for two different samples, temperatures, and current densities. The small grey dots represent the measured points and the color maps are obtained with an interpolation algorithm.
tron diffraction experiments that also aimed to charac-terize the magnetic ordering in the low current-density range. In a first set of experiments (Fig. 6) the current density was ramped up to j = 6.2 A/cm2. An additional
thermocouple could not be used in this experiment. The color maps in Fig. 6(a)-(d) represent the lattice parame-ter c extracted from longitudinal scans across the (006) Bragg position and its change during a full measurement cycle of ramping up the current, cooling, reheating, and ramping the current down. At a cryostat temperature of 250 K the current increase leads to an increased c lattice parameter while no additional reflection becomes visible [Fig. 6(a)]. The j-E curve clearly indicates a transition from insulating to metallic state at only j = 1.55 A/cm2, see Fig. 6(f). The shift of the insulating phase reflection can mostly be assigned to a thermal drift of the sam-ple and therefore it can be used to roughly estimate the sample temperature, although this will overestimate the temperature due to the neglecting of the intrinsic shift, see discussion below. A current density of j = 6.2 A/cm2
heats up the sample by ∼ 50 K. When cooling the sample under fixed current a phase separation at low tempera-tures occurs similar to the XRD observation. The signif-icant broadening of the insulating phase peak increases until two reflections can be distinguished, which we as-sign to the insulating phase and the intermediate phase [Fig. 6(b)]. Interestingly this phase segregation is not reversible as the two distinct reflections stay separated when increasing the temperature again, see Fig. 6(c). The phase separation and the appearance of the inter-mediate phase is associated with a reduction of the re-sistance, see Fig. 6(e) and (f), which also reduces the sample heating. Therefore, the sample temperature with the cryostat stabilized at 250 K is lower after the cooling
and heating cycle. In addition to the insulating and in-termediate phase reflections a weak third peak becomes visible at high temperatures with a c lattice parameter close to the metallic phase. This third phase also disap-pears quickly when reducing the current density at Tcryo
= 250 K at the end of the full cycle. Below 3 A/cm2
the intermediate phase reflection fades out and only one reflection persists [Fig. 6(d)]. The presented full mea-surement cycle documents a complex real structure aris-ing from phase segregation with strong hysteresis. The amount of insulating, intermediate and metallic phase are not only determined by current strength and tem-perature but also depend on the history of the sample, similar to reports in [29].
The mappings of the reflection against longitudinal (00ξ) and transversal (ξ00) directions clearly reveal the phase coexistence (see Fig. 7). At high current densities the phase separation is already visible at high temper-atures whereas at low current densities the coexistence only appears at low temperatures. It can be concluded that the samples show more than the two conventional insulating and metallic phases at low temperatures. The different positions of the Bragg peaks in the transverse direction (see Fig. 7) indicate that the different lattices are slightly tilted against each other similar to ferroelas-tic domains in a martensiferroelas-tic transition, see e.g. [40, 41]. Using a two-axis diffractometer the accessible Q space is limited to a scattering plane spanned by two crystal-lographic directions. Therefore, a full structural anal-ysis is not possible. But the twinning of the crystals with respect to the orthorhombic distortion allows one to measure the (200) and (020) reflections in addition to the (006) reflection [Fig. 8(a)]. In this set of neu-tron experiments with a sneu-tronger closed cycle
refrigera-FIG. 8. (a) Longitudinal scans across the (006) Bragg peak, left column, and (200) Bragg peaks, right column, at
vari-ous temperatures and with applied current (j = 1.5 A/cm2)
on pure Ca2RuO4. The black line represents the sum of
Gaussians while the single contributions are marked by the colored areas. In the left column the blue area illustrates the metallic phase, green the intermediate phase whereas the dif-ferent twin fractions visible in the longitudinal scans of (200) are displayed in yellow (a axis twin) and purple (b axis twin). (b) Comparison of the temperature dependence of the sam-ple resistance and the fitted peak intensity of intermediate phase. (c) Comparison of the temperature dependence of the resistance and the fitted peak width of both twin fractions.
tor [Sumitomo RDK 205D] and with a thermocouple indicated in Fig. 1 we cooled the crystal with a further reduced current density of j = 1.5 A/cm2. We find
quali-tatively the same phase segregation and the appearance of the intermediate phase reflection below ∼50 K, as it is shown in the longitudinal scan across the (006) Bragg po-sition, see Fig. 8(a). The longitudinal scans across (200) show two reflections. The a-axis twin results in higher 2θ values and the b-axis twin in lower values, respectively, because the lattice parameter a is smaller than b. The a-axis peak does not exhibit a strong temperature de-pendence, neither in 2θ nor in peak width. However, the b-axis reflection shifts to higher 2θ values synonymous with the decrease of the lattice parameter b. Only at 39 K the lattice parameter b increases again. Additionally to the shift, the Bragg peak of the b-axis twin is signifi-cantly broadened below 50 K [Fig. 8(c)]. This broadening can be attributed to the appearance of the intermediate phase, whose b lattice parameter is expected to be slightly smaller since it exhibits a more metallic character. Both, the appearance of the intermediate phase and the broad-ening of the b-axis reflection below 50 K, coincide with a drop in sample resistance [Fig. 8(b),(c)]. This again connects the appearance of the intermediate phase to an increased conductivity.
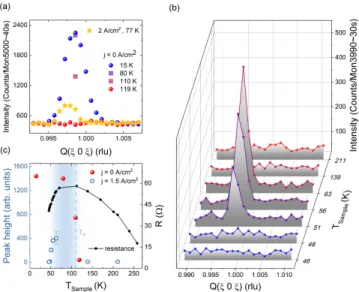
Sow et al. showed that below 50 K Ca2RuO4exhibits
anomalous properties under applied current [21]. In their magnetization measurements they could not find any an-tiferromagnetic transition for nonzero current densities. Ti substituted Ca2RuO4exhibits the B-centered AFM
order [30], which leads to a magnetic (101) Bragg re-flection [30]. We studied this reflection depending on temperature and under applying a small current den-sity (Fig. 9). Without current application the peak intensity rapidly decreases only close to the transition temperature TN = 110 K and becomes zero already
at 119 K [Fig. 9(a)]. Single point counts on the maxi-mum of the longitudinal scan over (101) at 80 K show that the intensity has little changed up to this tempera-ture in agreement with previous reports [10, 30]. While applying a current of 120 mA (j = 2 A/cm2) the lowest sample temperature reached is 70 K as determined by the thermocouple. At this experimental configuration (Tsample= 77 K, j = 2 A/cm2) the (101) reflection remains
visible, although with reduced intensity compared to the current-free phase at 80 K. It can be clearly stated that magnetically ordered regions survive the application of small currents. The reduction of peak intensity can be caused by various factors such as reduction of ordered phase volume or reduction of the transition temperature and ordered moment. By applying lower current densi-ties (j = 1.5 A/cm2) it is possible to cool the sample
be-low 50 K (as indicated by the thermocouple). Figure 9(b) shows the temperature dependent evolution of the (101) reflection. The peak intensities in (c) reflect the appear-ance of the magnetic Bragg peak at 63 K, well below the transition temperature of current free Ca2RuO4.
Sur-prisingly the Bragg peak at the magnetic position does not persist to low temperatures but suddenly disappears upon further cooling. The suppression of the AFM or-dering can be associated with the appearance of the in-termediate phase and the reduction of the resistance, see Fig. 8 and 9.
DISCUSSION
The totality of diffraction studies in our and in pre-vious [18, 28, 29, 31] experiments remains puzzling and cannot be fully reconciled. Most likely different exper-imental conditions - in particular concerning tempera-ture control and measurement - have a large impact on the real structure of the Ca2RuO4 crystals that carry
fi-nite current density below the metal-insulator transition. Our comprehensive diffraction studies indicate that for the largest part of the studied current and temperature ranges the samples are structurally inhomogeneous pre-senting a complex phase coexistence. Phase coexistence must even be expected in view of the S-shaped j-E char-acteristics [33].
Our experiments for currents perpendicular to the planes as well as all previous experiments agree
concern-FIG. 9. Influence of current application on the magnetic (101)
reflection in substituted Ca2RuO4. (a) Longitudinal scans
over (101) and single-point count rates at different temper-atures. The magnetic signal is reduced but persists with a
low current density of j = 1.5 A/cm2. (b) Temperature
de-pendence of longitudinal scans over the (101) reflection with
an applied current density of j = 1.5 A/cm2. (c)
Tempera-ture dependence of the sample resistance recorded simulta-neously with the neutron scattering in comparison with the peak heights from panel (b) (obtained by fitting with Gaus-sians). The red spheres represent the peak height of the (101) reflection measured without current from panel (a).
ing the fact that only very high current densities applied at elevated temperature result in strong Bragg scatter-ing that can be associated with the high-temperature metallic state of Ca2RuO4, i.e. a c lattice constant close
to 12.25 ˚A. When ramping up a high current density of the order of j = 10 A/cm2 and above, it seems
unavoid-able to heat the crystal and several groups report that the c value of the insulating phase increases close to ∼12.05 ˚A[18, 28, 29], which is the largest c value the insu-lating phase of Ca2RuO4 attains upon heating (without
current) before it transforms to the metallic phase [11]. Even though there is no doubt that metallic conduction is induced at temperatures well below the metal-insulator transition as can be seen in e.g. our time-resolved studies, any results with large current densities have to be consid-ered with great care. Our temperature dependent mea-surements at large current densities unambiguously show that even in this case the metallic phase Bragg contribu-tions rapidly diminish upon cooling. When analyzing the total scattering one must, however, keep the spatial ex-tension of the different phases in mind. If the spatial extension of the metallic phase falls below the coherence length of the diffraction experiment, the metallic phase scattering will become broadened in Q space. For our XRD experiment with a conventional X-ray tube we can estimate the spatial coherence to be in the range of 40 nm
[42], while the coherence length in the neutron experi-ments amounts to around 20 nm . In our and all previ-ous diffraction studies the use of tiny crystals [18, 28, 29] rendered it impossible to characterize such weak diffuse scattering.
The low-current state in Ca2RuO4 also exhibits a large
negative magnetoresistance [21] that is difficult to ex-plain without magnetism. However, a similar observa-tion in an imperfect bulk-insulating topological insulator was attributed to the Zeeman effect on barely correlating current paths [43].
Small metallic phase regions embedded in an insulat-ing matrix will nevertheless impact the Bragg scatterinsulat-ing of the insulating phase, because the average c lattice con-stant within the coherence volume increases. Such effects can explain the behavior of the Bragg contributions of insulating and intermediate phases. The c constant of the insulating phase with finite current is very close to that of the current-free insulating phase, and the small deviations can stem from some current-induced heating combined with the admixture of short-range (i.e. exten-sion below the coherence length) metallic parts, but the diffraction studies cannot exclude an intrinsic effect due to e.g. homogeneous loss of orbital polarization. In par-ticular when ramping the current density up the inclusion of more and more metallic phase regions yields a contin-uous increase of c. The crystal structure reported for a large current density of 10 A/cm2 at 130 K [28] exactly
corresponds to that of current-free Ca2RuO4 at 240 K
[11, 39], therefore it can also be explained by metallic admixtures (combined with heating). However, the DFT analysis proposing this structure as semimetallic [28] can be questioned in view of the well established insulating properties of Ca2RuO4 at 240 K.
In pure and in substituted crystals we find the inter-mediate phase under various conditions, and evidence for a similar phase can also be found in the room tempera-ture X-ray studies by Cirillo et al. [31]. The intermedi-ate phase appears to be crucial for the understanding of the anomalous properties at low current densities, which must result from some important intrinsic change. Our neutron experiments for current densities of 1 to 2 A/cm2
suggest that the intermediate phase appears or becomes enhanced in the temperature range below 100 K. In addi-tion we still find Bragg scattering at the posiaddi-tion where AFM order contributes a Bragg peak in the normal insu-lating state. This observation indicates that AFM order-ing can coexist with current carryorder-ing parts in one crystal. However, the AFM Bragg scattering disappears when the intermediate phase forms. Most likely the intermediate phase represents a more regular and more homogeneous arrangement compared to the modified insulating phase, but again a homogeneous loss of electronic order cannot be excluded on the basis of the diffraction studies. In the percolative picture of small metallic phase regions in an insulating matrix the intermediate phase is attributed to
a stronger and more homogeneous content of metallic re-gions with most likely also a more regular arrangement. The occurrence of the intermediate phase is accompanied with an enhanced conductance in agreement with a more regular arrangement.
The optical room-temperature studies by Zhang et al. [24] reveal a regular micro-stripe pattern of metal-lic phase and insulating phase regions. Such a regu-lar arrangement is common in martensitic phase tran-sitions that create strong local strain [40, 41, 44–46]. In martensite transitions the domains may even form well-defined superstructures [41, 47] arising from a reg-ular arrangement of very small domain sizes causing su-perlattice reflections. A similar strain mechanism was also proposed to explain stripe-like phenomena in vari-ous transition-metal oxides [48]. Indeed the differences in the lattice constants between metallic phase and insulat-ing phase in Ca2RuO4 without currents are huge. And
these differences strongly increase upon cooling. The low-temperature c parameter of insulating Ca2RuO4 is
∼0.5 ˚A shorter than that of the metallic phase, and the difference in the orthorhombic b parameter amounts to ∼0.25 ˚A. In contrast the a parameter is almost identi-cal. The optical experiment examines an a, b surface and finds stripes perpendicular to orthorhombic b, which is the expected arrangement for martensitic domains that reduce the strong in-plane strain along b. Similar domain arrangements must, however, also exist perpendicular to the planes, as the c strain would be even larger. Both strain effects should result in a relative tilting of metallic phase and insulating phase domains. Since the relative strains will increase by a factor three upon cooling, the microstripe pattern will considerably change. The lattice strain seems to be the driving force for the rearrange-ment of the phase volumes and in particular for the oc-currence of the intermediate phase at low temperatures. We speculate that the intermediate phase is a more fine mesh of insulating and metallic parts, so that the aver-age is better defined with intermediate lattice constants. For this finer mesh there is enhanced mutual influence of one state on the other state, which explains the disap-pearance of AFM ordering. However, studies with local probes are required to fully resolve the structural na-ture of the intermediate phase. Considering the strain effects and the fact that the insulator-metal transition can be induced by only moderate hydrostatic pressure above 0.5 GPa [12, 16], one may assume that Ca2RuO4
grown on a substrate causing tetragonal strain will even more easily undergo the insulator-metal transition at low temperature.
It also appears most important to understand the re-lation between the two mechanisms explained above: the formation of conducting filaments typically parallel to the current arising from the general phase instability [33] and the impact of the crystal strain due to the large dif-ferences in lattice constants that will also favor domain
formation similar to the well known effects in marten-site transitions [40, 41]. One may only speculate how these two phenomena actually couple: under the influ-ence of current, in a negative part of the j-E curve of Fig. 2, the system becomes unstable. It first tends to form conducting filaments predominantly parallel to the current, in which the insulator-metal transition and lo-cal heating imply strong structural changes. But then the strong strain imposes its own pattern in this inhomoge-neous state leading to the formation of more complicated microstructures, with metallic inclusions not just parallel to the current, but largely determined by strain. There-fore, the current has to meander, which finally leads to percolating network. The general picture of the origin and of the main characteristics of the current carrying state in Ca2RuO4 are certainly related to both
mecha-nisms.
CONCLUSION
X-ray and neutron diffraction studies as function of temperature and applied current density reveal a com-plex real structure indicating that phase segregation and phase coexistence are essential for the physics of the cur-rent carrying state in Ca2RuO4. Evidence for phase
seg-regation is deduced from the S-shaped quasistatic j-E curves and from two distinct time scales visible in pulsed transport measurements. When crystals are cooled with controlled current density we observe three different con-tributions to the Bragg peaks that can be easily assigned to phases with distinct c lattice parameters. Except at very high current densities and at elevated temperatures, there are only minority phases corresponding to the high-temperature metallic state of Ca2RuO4 with c lattice
constants of the order of 12.25 ˚A. The relative weight of these metallic contributions to the Bragg scattering continuously decreases upon cooling. The suppression of the Bragg peaks associated with the long-c-axis metallic state, however, does not exclude the persistence of such regions. The spatial extent of metallic regions can just become considerably lower than the coherence length of the diffraction experiment (of the order of 20 to 40 nm). For the lower current densities, below j = 2 A/cm2, for which anomalous low-temperature properties have been reported, metallic long-c Bragg scattering is irrelevant. The two other Bragg scattering contributions correspond to c lattice parameters close to the much smaller values expected for the insulating state. One phase, labelled insulating phase, exhibits rather similar though signifi-cantly larger c values compared to the current-free in-sulating state, while an intermediate contribution, inter-mediate phase, appears with about ∼0.1 ˚A larger c con-stants. Upon cooling, heating and ramping the current densities up or down the phase ratio between insulat-ing and intermediate states considerably varies, which is
associated with changes in the resistance. Most impor-tantly we find evidence for AFM ordering even in sam-ples carrying moderate current densities, but this AFM ordering seems to be suppressed when parts of the sample transform to the intermediate state.
The characters of the insulating and intermediate phases in the current carrying states cannot yet be fully established, but it cannot be excluded that they simply arise from phase coexistence and regular microarrange-ments of metallic and insulating regions. The general tendency to phase segregate and the impact of the local strain are proposed to drive the complex real structure in current carrying Ca2RuO4 at low temperature.
This work was funded by the Deutsche Forschungsgemeinschaft (DFG, German Research Foundation) -Project number 277146847 - CRC 1238, projects A02, B02 and B04.
∗
e-mail: braden@ph2.uni-koeln.de
[1] F. Chudnovskiy, S. Luryi, and B. Spivak, “Switching
device based on first-order metal- insulator transition in-duced by external electric field,” Future Trends in Micro-electronics: The Nano Millennium , 148 (2002).
[2] C. Vaju, L. Cario, B. Corraze, E. Janod, V. Dubost, T. Cren, D. Roditchev, D. Braithwaite, and O. Chau-vet, “Electric-pulse-driven electronic phase separation, insulator-metal transition, and possible superconductiv-ity in a mott insulator,” Advanced Materials 20, 2760 (2008).
[3] M. M. Qazilbash, M. Brehm, B.-G. Chae, P.-C. Ho, G. O. Andreev, B.-J. Kim, S. J. Yun, A. V. Balatsky, M. B. Maple, F. Keilmann, H.-T. Kim, and D. N. Basov, “Mott
Transition in VO2Revealed by Infrared Spectroscopy and
Nano-Imaging,” Science 318, 1750 (2007).
[4] A. S. McLeod, E. Van Heumen, J. G. Ramirez, S. Wang, T. Saerbeck, S. Guenon, M. Goldflam, L. Anderegg,
P. Kelly, A. Mueller, M. K. Liu, I. K. Schuller, and
D. N. Basov, “Nanotextured phase coexistence in the
cor-related insulator V2O3,” Nature Physics 13, 80 (2017).
[5] J. Jeong, N. Aetukuri, T. Graf, T. D. Schladt, M. G.
Samant, and S. S. P. Parkin, “Suppression of
Metal-Insulator Transition in VO2 by Electric Field–Induced
Oxygen Vacancy Formation,” Science 339, 1402 (2013).
[6] K. Szot, R. Dittmann, W. Speier, and R. Waser,
“Nanoscale resistive switching in SrTiO3 thin films,”
physica status solidi (RRL) Rapid Research Lett. 1, R86 (2007).
[7] S. Nakatsuji, S.-I. Ikeda, and Y. Maeno, “Ca2RuO4 :
New Mott Insulators of Layered Ruthenate,” Journal of the Physical Society of Japan 66 (1997).
[8] S. Nakatsuji, T. Ando, Z. Mao, and Y. Maeno, “Metal
insulator transition in Ca2−xSrxRuO4,” Physica B
259-261, 949 (1999).
[9] C. S. Alexander, G. Cao, V. Dobrosavljevic, S. Mccall, J. E. Crow, E. Lochner, and R. P. Guertin, “Destruction
of the Mott insulating ground state of Ca2RuO4 by a
structural transition,” Phys. Rev. B 60, 8422 (1999).
[10] M. Braden, G. Andr´e, S. Nakatsuji, and Y. Maeno,
“Crystal and magnetic structure of Ca2RuO4 :
Mag-netoelastic coupling and the metal-insulator transition,” Phys. Rev. B 58, 847 (1998).
[11] O. Friedt, M. Braden, G. Andr´e, P. Adelmann, S.
Nakat-suji, and Y. Maeno, “Structural and magnetic aspects of
the metal-insulator transition in Ca2−xSrxRuO4,” Phys.
Rev. B 63, 174432 (2001).
[12] P. Steffens, O. Friedt, P. Alireza, W. G. Marshall, W. Schmidt, F. Nakamura, S. Nakatsuji, Y. Maeno,
R. Lengsdorf, M. M. Abd-Elmeguid, and M. Braden,
“High-pressure diffraction studies on ca2ruo4,” Phys.
Rev. B 72, 094104 (2005).
[13] Z. Fang and K. Terakura, “Magnetic phase diagram of
Ca2RuO4governed by structural distortions,” Phys. Rev.
B 64, 020509 (2001).
[14] G. Zhang and E. Pavarini, “Mott transition, spin-orbit
effects, and magnetism in Ca2RuO4,” Phys. Rev. B 95,
075145 (2017).
[15] S. Kunkem¨oller, D. Khomskii, P. Steffens, A. Piovano,
A. A. Nugroho, and M. Braden, “Highly Anisotropic
Magnon Dispersion in Ca2RuO4 : Evidence for Strong
Spin Orbit Coupling,” Phys. Rev. Lett. 115, 1 (2015). [16] F. Nakamura, T. Goko, M. Ito, T. Fujita, P. Alireza,
D. Forsythe, and S. R. Julian, “From Mott insulator to
ferromagnetic metal : A pressure study of Ca2RuO4,”
Phys. Rev. B 65, 220402 (2002).
[17] S. Nakatsuji and Y. Maeno, “Quasi-Two-Dimensional
Mott Transition System Ca2RuO4,” Phys. Rev. Lett. 84,
2666 (2000).
[18] F. Nakamura, M. Sakaki, Y. Yamanaka, T. Suzuki,
Y. Maeno, and E.-f.-i. Mott,
“Electric-field-induced metal maintained by current of the Mott
insulator Ca2RuO4,” Scientific Reports (2013),
10.1038/srep02536.
[19] S. Whitehead, “Dielectric Breakdown of Solids” (Oxford University Press, Oxford, 1953).
[20] Y. Taguchi, T. Matsumoto, and Y. Tokura, “Dielectric
breakdown of one-dimensional Mott insulators Sr2CuO3
and SrCuO2,” Phys. Rev. B 62, 7015 (2000).
[21] C. Sow, S. Yonezawa, S. Kitamura, T. Oka, K. Kuroki, F. Nakamura, and Y. Maeno, “Current-induced strong
diamagnetism in the Mott insulator Ca2RuO4,” Science
358, 1084 (2017).
[22] H. Zhao, B. Hu, F. Ye, C. Hoffmann, I. Kimchi, and
G. Cao, “Nonequilibrium orbital transitions via applied electrical current in calcium ruthenates,” Phys. Rev. B 100, 241104 (2019).
[23] R. Okazaki, Y. Nishina, Y. Yasui, F. Nakamura,
T. Suzuki, and I. Terasaki, “Current-Induced Gap
Sup-pression in the Mott Insulator Ca2RuO4,” Journal of the
Physical Society of Japan 82, 103702 (2013).
[24] J. Zhang, A. S. McLeod, Q. Han, X. Chen, H. A. Bechtel, Z. Yao, S. Gilbert Corder, T. Ciavatti, T. H. Tao, M. Aronson, G. Carr, M. C. Martin, C. Sow, S. Yonezawa, F. Nakamura, I. Terasaki, D. Basov, A. J. Millis, Y. Maeno, and M. Liu, “Nano-Resolved Current-Induced Insulator-Metal Transition in the Mott Insulator
Ca2RuO4,” Phys. Rev. X 9, 011032 (2019).
[25] G. Mattoni, S. Yonezawa, and Y. Maeno, “Diamagnetic-like response from localized heating of a paramagnetic material,” Applied Physics Letters 116, 172405 (2020). [26] O. Friedt, P. Steffens, M. Braden, Y. Sidis, S. Nakatsuji,
and Y. Maeno, “Strongly Enhanced Magnetic Fluctua-tions in a Large-Mass Layered Ruthenate,” Phys. Rev.
Lett. 93, 147404 (2004).
[27] P. Steffens, O. Friedt, Y. Sidis, P. Link, J. Kulda,
K. Schmalzl, S. Nakatsuji, and M. Braden,
“Mag-netic excitations in the metallic single-layer ruthenates
Ca2−xSrxRuO4 studied by inelastic neutron scattering,”
Phys. Rev. B 83, 054429 (2011).
[28] J. Bertinshaw, N. Gurung, P. Jorba, H. Liu, M. Schmid, D. T. Mantadakis, M. Daghofer, M. Krautloher, A. Jain, G. H. Ryu, O. Fabelo, P. Hansmann, G. Khaliullin,
C. Pfleiderer, B. Keimer, and B. J. Kim, “Unique
Crystal Structure of Ca2RuO4 in the Current
Stabi-lized Semimetallic State,” Phys. Rev. Lett. 123, 137204 (2019).
[29] H. Zhao, B. Hu, F. Ye, C. Hoffmann, I. Kimchi, and
G. Cao, “Nonequilibrium orbital transitions via applied electrical current in calcium ruthenates,” Phys. Rev. B 100, 241104 (2019).
[30] S. Kunkem¨oller, E. Komleva, S. V. Streltsov, S.
Hoff-mann, D. I. Khomskii, P. Steffens, Y. Sidis, K. Schmalzl,
and M. Braden, “Magnon dispersion in Ca2Ru1−xTixO4
: Impact of spin-orbit coupling and oxygen moments,” Phys. Rev. B 95, 1 (2017).
[31] C. Cirillo, V. Granata, G. Avallone, R. Fittipaldi, C. At-tanasio, A. Avella, and A. Vecchione, “Emergence of a metallic metastable phase induced by electrical current
in Ca2RuO4,” Phys. Rev. B 100, 1 (2019).
[32] A. Mansingh, R. Singh, and S. Krupanidhi, “Electrical switching in single crystal vo2,” Solid-State Electronics 23, 649 (1980).
[33] A. F. Volkov and S. M. Kogan, “Physical phenomena in semiconductors with negative differential conductivity,” Sov.Phys Uspekhi 11, 881 (1969).
[34] S. Kumar, M. D. Pickett, J. P. Strachan, G. Gibson, Y. Nishi, and R. S. Williams, “Local temperature redis-tribution and structural transition during joule-heating-driven conductance switching in vo2,” Advanced Materi-als 25, 6128 (2013).
[35] C. N. Berglund, “Thernal filaments in vanadium diox-ide,” IEEE Transactions on Electron Devices 16, 432 (1969).
[36] S. Zhang, M. A. Kats, Y. Cui, Y. Zhou, Y. Yao, S. Ra-manathan, and F. Capasso, “Current-modulated optical properties of vanadium dioxide thin films in the phase transition region,” Appl. Phys. Lett. 105, 211104 (2014). [37] S. Stille, C. Lenser, R. Dittmann, A. Koehl, I. Krug, R. Muenstermann, J. Perlich, C. M. Schneider, U. Klem-radt, and R. Waser, “Detection of filament formation in forming-free resistive switching srtio3 devices with ti top electrodes,” Applied Physics Letters 100, 223503 (2012).
[38] The specific heat at room temperature is taken from Ref.
[49] for 8.5 % Mn doped Ca2RuO4. The temperature
increase rate is calculated with ∆T = Cp
pnV, where p
is the power density in W cm−3, Cp the specific heat
in J mol−1K−1, and nV the amount of substance in
mol cm−3.
[39] The values of atomic distance between the Ru site and the basal oxygen sites Ru-O(1)(avg.) reported in ref. [28]
for the S∗phase at 130 K (in ref. [10, 11] for the S phase at
240 K) amount to 2.003(2.004) ˚A. The Ru-O(2) distance
amounts in both cases to 1.979 ˚Awhich yields an averaged
Ru-O distance of 1.995(1.996) ˚A. The rotation angle Φ
of the RuO6 octahedra around the c axis amounts to
11.874(11.91) degrees. The basal plane is titled in respect to the ab plane by Θ-O(1) 12.43(12.23) degrees and the tilt angle Θ-O(2) between the Ru-O(2) bond and the c axis amounts to 10.65(10.2) degrees.
[40] A. Khachaturian, “Theory of structural transformations in solids” (Wiley, New York, 1983).
[41] A. G. Khachaturyan, S. M. Shapiro, and S.
Semen-ovskaya, “Adaptive phase formation in martensitic trans-formation,” Phys. Rev. B 43, 10832 (1991).
[42] S. Bartzsch, and U. Oelfke, “Line focus x-ray tubes a new concept to produce high brilliance x-rays,” Phys. Med. Biol. 62, 8600-8615 (2017).
[43] O. Breunig, Z. Wang, A. A. Taskin, J. Lux, A. Rosch, and Y. Ando, “Gigantic negative magnetoresistance in the bulk of a disordered topological insulator,” Nature Communications 8, 15545 (2017).
[44] J. Dec, “Paraelastic and ferroelastic interfaces,” Phase Transitions 45, 35 (1993).
[45] A. L. Roytburd, “Elastic domains and polydomain phases in solids,” Phase Transitions 45, 1 (1993).
[46] J. W. Seo and D. Schryvers, “TEM investigation of the microstructure and defects of CuZr martensite. Part I: Morphology and twin systems,” Acta Materialia 46, 1165 (1998).
[47] S. Kaufmann, U. K. R¨oßler, O. Heczko, M. Wuttig,
J. Buschbeck, L. Schultz, and S. F¨ahler, “Adaptive
Mod-ulations of Martensites,” Phys. Rev. Lett. 104, 145702 (2010).
[48] D. I. Khomskii and K. I. Kugel, “Why stripes? Spon-taneous formation of inhomogeneous structures due to elastic interactions,” Europhysics Letters (EPL) 55, 208 (2001).
[49] T. F. Qi, O. B. Korneta, S. Parkin, J. Hu, and G. Cao, “Magnetic and orbital orders coupled to negative thermal
expansion in Mott insulators Ca2Ru1−xMxO4 (M = Mn