HAL Id: hal-00668570
https://hal.archives-ouvertes.fr/hal-00668570
Submitted on 10 Feb 2012
HAL is a multi-disciplinary open access
archive for the deposit and dissemination of
sci-entific research documents, whether they are
pub-lished or not. The documents may come from
teaching and research institutions in France or
abroad, or from public or private research centers.
L’archive ouverte pluridisciplinaire HAL, est
destinée au dépôt et à la diffusion de documents
scientifiques de niveau recherche, publiés ou non,
émanant des établissements d’enseignement et de
recherche français ou étrangers, des laboratoires
publics ou privés.
A detection system to measure muon-induced neutrons
for direct Dark Matter searches
V.Yu. Kozlov, E. Armengaud, C. Augier, A. Benoit, L. Bergé, O. Besida, J.
Blümer, A. Broniatowski, V. Brudanin, A. Chantelauze, et al.
To cite this version:
V.Yu. Kozlov, E. Armengaud, C. Augier, A. Benoit, L. Bergé, et al.. A detection system to measure
muon-induced neutrons for direct Dark Matter searches. Astroparticle Physics, Elsevier, 2010, 34 (2),
pp.97. �10.1016/j.astropartphys.2010.06.001�. �hal-00668570�
Accepted Manuscript
A detection system to measure muon-induced neutrons for direct Dark Matter
searches
V.Yu. Kozlov, E. Armengaud, C. Augier, A. Benoit, L. Bergé, O. Besida, J.
Blümer, A. Broniatowski, V. Brudanin, A. Chantelauze, M. Chapellier, G.
Chardin, F. Charlieux, S. Collin, X. Defay, M. De Jésus, P. Di Stefano, Y.
Dolgorouki, J. Domange, L. Dumoulin, K. Eitel, J. Gascon, G. Gerbier, M. Gros,
M. Hannawald, S. Hervé, A. Juillard, H. Kluck, R. Lemrani, P. Loaiza, A.
Lubashevskiy, S. Marnieros, X.-F. Navick, E. Olivieri, P. Pari, B. Paul, S.
Rozov, V. Sanglard, S. Scorza, S. Semikh, A.S. Torrentó-Coello, L. Vagneron,
M-A. Verdier, E. Yakushev
PII:
S0927-6505(10)00113-1
DOI:
10.1016/j.astropartphys.2010.06.001
Reference:
ASTPHY 1497
To appear in:
Astroparticle Physics
Received Date:
24 February 2010
Revised Date:
1 June 2010
Accepted Date:
11 June 2010
Please cite this article as: V.Yu. Kozlov, E. Armengaud, C. Augier, A. Benoit, L. Bergé, O. Besida, J. Blümer, A.
Broniatowski, V. Brudanin, A. Chantelauze, M. Chapellier, G. Chardin, F. Charlieux, S. Collin, X. Defay, M. De
Jésus, P. Di Stefano, Y. Dolgorouki, J. Domange, L. Dumoulin, K. Eitel, J. Gascon, G. Gerbier, M. Gros, M.
Hannawald, S. Hervé, A. Juillard, H. Kluck, R. Lemrani, P. Loaiza, A. Lubashevskiy, S. Marnieros, X.-F. Navick,
E. Olivieri, P. Pari, B. Paul, S. Rozov, V. Sanglard, S. Scorza, S. Semikh, A.S. Torrentó-Coello, L. Vagneron,
M-A. Verdier, E. Yakushev, A detection system to measure muon-induced neutrons for direct Dark Matter searches,
Astroparticle Physics (2010), doi:
10.1016/j.astropartphys.2010.06.001
This is a PDF file of an unedited manuscript that has been accepted for publication. As a service to our customers
we are providing this early version of the manuscript. The manuscript will undergo copyediting, typesetting, and
review of the resulting proof before it is published in its final form. Please note that during the production process
errors may be discovered which could affect the content, and all legal disclaimers that apply to the journal pertain.
ACCEPTED MANUSCRIPT
A detection system to measure muon-induced neutrons for direct Dark Matter searches
V.Yu. Kozlov∗,a, E. Armengaudb, C. Augierc, A. Benoitd, L. Berg´ee, O. Besidab, J. Bl¨umera,f, A. Broniatowskie, V. Brudaning,
A. Chantelauzea, M. Chapelliere, G. Chardine, F. Charlieuxc, S. Colline, X. Defaye, M. De J´esusc, P. Di Stefanoc,1, Y. Dolgoroukie,
J. Domangeb,e, L. Dumouline, K. Eitela, J. Gasconc, G. Gerbierb, M. Grosb, M. Hannawaldb, S. Herv´eb, A. Juillardc, H. Klucka,
R. Lemranib, P. Loaizai, A. Lubashevskiyg, S. Marnierose, X.-F. Navickb, E. Olivierie, P. Parih, B. Paulb, S. Rozovg, V. Sanglardc,
S. Scorzac, S. Semikhg, A.S. Torrent´o-Coellob, L. Vagneronc, M-A. Verdierc, E. Yakushevg
aKarlsruhe Institute of Technology, Institut f¨ur Kernphysik, Postfach 3640, 76021 Karlsruhe, Germany
bCEA, Centre d’ ´Etudes Nucl´eaires de Saclay, IRFU, 91191 Gif-sur-Yvette Cedex, France
cInstitut de Physique Nucl´eaire de Lyon, Universit´e de Lyon (Universit´e Claude Bernard Lyon 1) et IN2P3-CNRS, 4 rue Enrico Fermi, 69622 Villeurbanne, France
dInstitut N´eel, CNRS, 25 Avenue des Martyrs, 38042 Grenoble cedex 9, France
eCentre de Spectroscopie Nucl´eaire et de Spectroscopie de Masse, UMR8609 IN2P3-CNRS, Univ. Paris Sud, bˆat 108, 91405 Orsay Campus, France
fKarlsruhe Institute of Technology, Institut f¨ur Experimentelle Kernphysik, Gaedestr. 1, 76128 Karlsruhe, Germany
gLaboratory of Nuclear Problems, JINR, Joliot-Curie 6, 141980 Dubna, Moscow Region, Russian Federation
hCEA, Centre d’ ´Etudes Nucl´eaires de Saclay, IRAMIS, 91191 Gif-sur-Yvette Cedex, France
iLaboratoire Souterrain de Modane, CEA-CNRS, 1125 route de Bardonn´eche, 73500 Modane, France
Abstract
Muon-induced neutrons constitute a prominent background component in a number of low count rate experiments, namely direct searches for Dark Matter. In this work we describe a neutron detector to measure this background in an underground laboratory, the Laboratoire Souterrain de Modane. The system is based on 1 m3of Gd-loaded scintillator and it is linked with the muon veto of
the EDELWEISS-II experiment for coincident muon detection. The system was installed in autumn 2008 and passed since then a number of commissioning tests proving its full functionality. The data-taking is continuously ongoing and a count rate of the order of 1 muon-induced neutron per day has been achieved.
Key words: Neutron background, Muon-induced neutrons, Dark matter, Underground physics
1. Introduction
1
A common challenge in rare-event searches is an accurate
2
and precise understanding of all background components. A
3
typical approach is based on a combination of Monte-Carlo
4
simulations and dedicated measurements. In this work we
5
present a detection system to study the production of
muon-6
induced neutrons in an underground laboratory. The main goal
7
is to perform a quantitative analysis of this background
com-8
ponent in the specific environment of Laboratoire Souterrain
9
de Modane (LSM) within the context of EDELWEISS-II [1, 2]
10
and EURECA [3] direct dark matter (DM) search experiments.
11
∗Corresponding author, Valentin.Kozlov@kit.edu
1Present address: Department of Physics, Queen’s University, Kingston,
ON, K7L 3N6, Canada
Such experiments probe nature for weakly interacting massive
12
particles (WIMP), as the most promising DM candidate, by
13
means of nuclear recoils originating from a WIMP-nucleon
14
elastic scattering. The expected interaction rate of WIMPs is
15
extremely small, i.e. below 0.01 event per day and per kilogram
16
of the target material, thus rising up the importance of the
back-17
ground knowledge. The recent developments in discrimination
18
techniques of the DM detectors [4] allow a very powerful
rejec-19
tion of the electromagnetic background while neutrons reaching
20
a detector with energies of the order of 1 MeV, in the case of
21
EDELWEISS-II, can cause a signal potentially
indistinguish-22
able from the WIMP-nucleon scattering. The neutrons arise
23
in an underground laboratory either from natural radioactivity
24
having initial energies below 10 MeV, which can be effectively
25
ACCEPTED MANUSCRIPT
shielded, or being produced in a muon-induced cascade with
26
energies up to several hundred MeV and able to travel far from
27
a production vertex. In this paper we concentrate on
study-28
ing the latter ones. The effect of the muon-induced neutron
29
background can be reduced considerably by tagging the
origi-30
nal muons with a muon veto around an experiment. However,
31
the neutrons produced in the rock by muons passing outside of
32
the setup and hence missed by the veto, can still reach the DM
33
detectors. These neutrons can also lead to an in-situ production
34
of secondary neutrons via spallation, especially in a lead (Pb)
35
material commonly used around the DM detectors for an e
ffi-36
cient gamma attenuation. In addition, a fraction of muons can
37
be missed due to a non-ideal muon veto efficiency and result in
38
a neutron production inside the shielding, again predominantly
39
in the Pb material.
40
In general, to measure the muon-induced neutron
back-41
ground is a challenging task due to its low intensity and its
42
dependence on the actual experimental set-up. For instance,
43
one could look for coincidences between the muon veto and the
44
DM detectors but as the current data-taking of
EDELWEISS-45
II shows, only few muon-induced events are identified in an
46
exposure of several hundred kg.days [2, 5]. To perform
corre-47
sponding Monte-Carlo simulations is not a simple issue either,
48
since many parameters have to be taken into account, e.g. the
49
muon energy spectrum and the flux in an underground
labora-50
tory, production of neutrons by hadronic and electromagnetic
51
muon-induced showers, material dependency of this
produc-52
tion, three dimensional topology of interactions. As reviewed in
53
[7, 8], measurements of neutron production rates in liquid
scin-54
tillator at different laboratory depths can be well described by
55
most frequently used packages, GEANT4 [9] and FLUKA [10],
56
which are in agreement with each other within ≤30% at the
57
muon energies specific for an underground laboratory.
How-58
ever, the calculated neutron yield for Pb and an ordinary rock
59
can vary up to a factor of 2 between the packages, being lower
60
in GEANT4 [7]. Experimental neutron production rates in Pb
61
measured in [11, 12] and scaled to the same mean muon energy
62
appear to be inconsistent within a factor of 3 among each other
63
and may suggest that both simulation packages underestimate
64
the neutron yield in heavy targets [7, 13]. On the other hand,
65
recent studies performed in [14] with an existing experimental
66
setup though not fully optimized to the specific needs of
muon-67
induced neutron detection result in a measured neutron yield
68
in Pb being 1.8 (3.6) times smaller than predicted in GEANT4
69
(FLUKA). Overall, these measurements give a spread of
neu-70
tron production rate in Pb of nearly one order of magnitude
71
which can affect the sensitivity of DM experiments by the same
72
factor.
73
In order to measure the muon-induced neutron background
74
and to develop the corresponding background model optimized
75
for the LSM laboratory hosting the EDELWEISS-II experiment
76
and the future one, EURECA, we have designed and installed
77
a dedicated neutron counter. Having the neutron detector
in-78
location of present and planned DM set-ups allows to avoid
79
several uncertainties in the simulations, e.g. arising from
calcu-80
lations of the muon energy spectrum and the muon flux in the
81
laboratory. The goal is to investigate the muon-induced neutron
82
yield in Pb either with or without tagging the incident muon to
83
an accuracy of better than 25% with equal statistical and
sys-84
tematic uncertanties expected. One should also note here, that
85
the EDELWEISS-II strategy on neutron background
investiga-86
tion is complemented by continuous monitoring of the thermal
87
neutron flux in the vicinity of the DM experiment by means of
88
3He detectors [15]. Another new experiment to study muon-89
induced neutron flux deep underground was proposed by other
90
authors in [16]. The investigation of the neutron background is,
91
in fact, not limited to the field of dark matter and is relevant, for
92
instance, for experiments looking for neutrinoless double beta
93
decay, e.g. NEMO-3 [17] and SuperNemo [18] with their
lo-94
cation in LSM too. Furthermore, the results of our studies of
95
muon-induced neutrons are as well applicable to other
under-96
ground laboratories.
97
The structure of the paper is as follows: in Sect. 2, a
gen-98
eral overview of muon interactions and production of secondary
99
neutrons is given, emphasizing the role for DM search. Sect. 3
100
describes the details of the neutron detector installed in LSM,
ACCEPTED MANUSCRIPT
including the data acquisition system, LED-based control of the
102
liquid scintillator and a safety monitoring. Results of
commis-103
sioning runs demonstrating the performance of the system are
104
discussed in Sect. 4. Sect. 5 presents preliminary data from
105
first physics runs as proof-of-principle. In Sect. 6, we conclude
106
with a summary and an outlook of the anticipated data taking
107
necessary to get full physics results.
108
2. Muon induced neutrons
109
Atmospheric muons are mainly produced in decays of
110
charged pions and kaons created in an interaction of primary
111
cosmic rays with the atoms of the Earth’s atmosphere. The
en-112
ergy spectrum of muons extends above 1 TeV while the mean
113
energy is about 4 GeV at the ground [19]. The overall angular
114
distribution of muons at the sea level is ∝ cos2θ (θ being the 115
zenith angle), at lower energy it becomes increasingly steep,
116
while at higher energy it flattens, approaching a 1/cos θ
dis-117
tribution for Eµ 115 GeV and θ < 70◦ [19]. The total
118
muon energy spectrum in the underground lab can be
calcu-119
lated rather well in the assumption of flat overburden [8, 20]
120
and it becomes harder, e.g. DELS Mµ E = 260 − 290 GeV. To get 121
a corresponding angular distribution for an underground site,
122
a mountain profile has to be taken into account and thus it
123
becomes laboratory specific. When passing through the rock,
124
the muons lose their energy in four main processes: ionization
125
(including the production of high-energy δ-electrons),
produc-126
tion of e−e+-pairs, bremsstrahlung and deep inelastic scatter-127
ing (DIS). These processes naturally also lead to a
develop-128
ment of electromagnetic and hadronic showers. Therefore,
un-129
der the muon-induced background one has to consider, in
gen-130
eral, all particles created both directly by original muons and
131
in secondary cascades. As it was already explained in the
in-132
troduction, neutrons constitute the most dangerous background
133
component for direct DM searches among other muon-induced
134
particles. GEANT4 simulations show (Fig. 1) that most of
135
the neutrons are created in the secondary cascades,
predomi-136
nantly by photonuclear interaction, pion and neutron inelastic
137
scattering, pion absorption at rest and proton inelastic
scatter-138
ing [7, 20]. The contribution of direct muon nuclear
interac-139
tion being the second most important one at low muon
ener-140
gies decreases with higher energies because of larger
electro-141
magnetic and hadronic cascades. Neutrons produced in
elec-142
tromagnetic interactions have typically low energy and can be
143
effectively absorbed. In contrast, the hadronic showers and
es-144
pecially high energy muon DIS reactions lead to a production
145
of energetic neutrons which can travel far away from the
cre-146
ation point, reach the DM set-up, penetrate the entire shielding
147
and cause nuclear recoils in the DM detectors either directly
148
or by a neutron spallation in the high-Z material surrounding
149
the experimental setup. It also has to be noted that neutron
150
production generally increases with the muon energy and the
151
average atomic weight of the material, e.g. in Pb there will be
152
∼100 times more neutrons created compared to CnH2nand ∼10 153
times more compared to rock or concrete of the same thickness
154
[6, 7, 8, 20]. To model the effect of the muon-induced neutrons
155
in application to DM searches, it is thus essential to take into
ac-156
count all the processes aforementioned, track each single
parti-157
cle through different materials down to an energy deposit in DM
158
detectors on an event-by-event base. Monte-Carlo simulations
159
based on the GEANT4 toolkit (version 8.1.p01) were developed
160
in [20] and included all these aspects, profile of the mountain,
161
full geometry of the EDELWEISS-II experiment and topology
162
of an event. The EDELWEISS-II set-up, described elsewhere
163
[1], hosts in a single cryostat an array of Ge bolometers used
164
as DM detectors. The cryostat is surrounded by 20 cm lead
165
shield, followed by 50 cm polyethylene and a modular muon
166
veto [5, 21]. As the simulations show [20], most of neutrons
167
leading to energy deposit in Ge bolometers are due to secondary
168
production in the Pb shield near the cryostat. The rate of this
169
background for the optimized EDELWEISS-II set-up can be
170
as low asΓ ∼ 10−5/kg/day once the anti-coincidence with the 171
muon veto and with other bolometers is required but crucially
172
depends on the shielding concept and the muon veto efficiency.
173
As follows from these simulations and the ones described in [8],
174
these muon-induced neutrons are not a matter of concern for
175
the current phase of EDELWEISS-II aiming for the sensitivity
176
ACCEPTED MANUSCRIPT
E (GeV)m Relative process contribution (%) 10 100 1000 100 10 1 g®N p®N n®N pabs p®N m®N othersFigure 1: Relative contribution of individual processes to the total neutron
pro-duction yield as a function of the muon energy in CnH2n, GEANT4 simulations.
Figure is adopted from [20], the lines are drawn to guide the eye.
of 10−8 pb for the spin-independent WIMP-nucleon scattering 177
cross-section but may become so for the next phase and
espe-178
cially for the next generation DM experiments with the goal
179
of 10−10 pb, such as EURECA. With the neutron counter
de-180
scribed here we intend to gather statistically significant data for
181
validation and further development of our background model
182 [20]. 183 3. Experimental set-up 184 3.1. Measurement principle 185
The LSM underground lab, where the designed neutron
de-186
tector is installed, is situated in the Fr´ejus road tunnel in
187
the French-Italian Alps and has an overburden shielding of
188
4850 m.w.e. This reduces the muon flux down to about
189
5 /m2/day [22], i.e. by more than a factor of 106 comparing
190
to sea level. Such a low rate naturally leads to a low flux
191
of muon-induced neutrons and requires a relatively large size
192
of the instrument. To measure the neutron yield originated
193
from well-identified muons interacting in Pb, the developed
194
neutron counter (NC) has a layer of Pb and its read-out
sys-195
tem is coupled to the muon veto system of the
EDELWEISS-196
II experiment for a good tagging of incident muons. In order
197
to achieve an efficient detection of neutrons, a
Gadolinium-198
loaded liquid scintillator is used. The primary trigger in this
199
case is associated with the muon itself and following triggers
200
correspond to secondary neutrons predominantly created in Pb
201
and captured thereafter on Gadolinium (Gd). A measurement
202
of the neutron production rate without demanding a primary
203
muon tag can only be done by requiring a multiple trigger
oc-204
currence in the NC within a predefined acquisition window
205
(tDAQ ≈ 60 µs). Together with an appropriate energy thresh-206
old this allows to effectively reject accidental background. For
207
these events the primary trigger arises from any particle
pro-208
duced in muon cascades. For instance, high energy gamma’s
209
can first lead to Compton scattering in the NC scintillator
vol-210
ume and only then produce secondary neutrons in the Pb layer
211
via photonuclear reaction. High energy neutrons could create a
212
prompt recoil proton at first and then generate secondary
neu-213
trons being characterized as a multiple neutron capture event.
214
In this mode we study the overall neutron production rate
with-215
out identifying the primary particle. The events with
multiplic-216
ity 2, i.e. a primary trigger and one secondary, may in part
217
contain a contribution of correlated backgrounds, e.g. the fast
218
neutrons originating from natural radioactivity or β-decays of
219
214Bi followed by an α-decay of 214Po: The flux of the am-220
bient neutrons is 10−6 neutrons/cm2/s above 1 MeV [23], the 221
energy spectrum extends to 10 MeV but is strongly suppressed
222
above 4 MeV [23, 24]. Nevertheless, these neutrons can still
223
lead to recoil protons above the NC threshold and then be
cap-224
tured in the scintillator. 214Bi comes from the Uranium-chain, 225
undergoes the β-decay with the endpoint energy of 3.27 MeV
226
to214Po which then α-decays with a half-life of 164.3 µs and
227
Eα = 6.6, 6.9, 7.68 MeV. Thus both β- and α-particles can de-228
posit energy above the NC threshold within the acquisition
win-229
dow of tDAQ ≈ 60 µs. This implies that events with one sec-230
ondary hit need special attention in the analysis while the effect
231
of both background components is negligible for higher
multi-232
plicities in our studies.
ACCEPTED MANUSCRIPT
3.2. General overview
234
The core of the detector consists of 1 m3of liquid scintillator
235
(50x100x200 cm3) loaded with 0.2% of Gd by weight, St. Gob-236
ain Bicron BC525. The neutron capture on Gd has the largest
237
cross-section (σγ = 2.54 · 105 b for157Gd, 15.65% of natural 238
abundance [25]) compared to other stable elements and results
239
in several γ’s with a summed energy of 8 MeV. Adding 0.2%
240
of Gd in organic scintillator leads to a capture time, τcapture, of 241
about 17 µs while a typical time needed for neutrons to
thermal-242
ize is defined by the proton density in the liquid and is ∼10 µs
243
(see Sect. 4.3). Underneath the detector, a 10-cm thick layer of
244
lead bricks is put for studies of the neutron yield. The
thick-245
ness of this layer was chosen by considering the process of
sec-246
ondary neutron production, the probability for these neutrons
247
to reach the scintillator and the mechanical stability of the
in-248
strument. The geometry of the NC scintillator volume was
op-249
timized for the efficiency of neutron detection with specially
250
adapted Monte-Carlo simulations based on GEANT4 (version
251
8.1.p01) and taking into account space and security restrictions
252
of the underground laboratory. In the simulations it was found
253
that most of the secondary neutrons are captured after ∼20 cm
254
of penetration into the scintillator. The registration efficiency
255
of gammas produced by Gd(n,γ) saturates once a 50-cm thick
256
system is realized (Fig. 2), thus defining the thickness of the
257
instrument. However, this efficiency is significantly less than
258
100% because of a partial escape of neutron-capture gammas
259
as a consequence of a limited neutron penetration into the
scin-260
tillator, as well as due to an applied energy threshold. As an
261
example, for En= 10 MeV and a threshold of 3 MeV it reaches 262
a value of ∼33%. For higher neutron energies, the inelastic
263
scattering process (n, 2n) starts to play a role, thus increasing
264
the detection efficiency. Due to the partial γ escape it is
ob-265
vious that, instead of the γ-peak at 8 MeV sum energy
origi-266
nating from the neutron capture on Gd, a continuous spectrum
267
extending to 8 MeV is expected. The detector volume is
di-268
vided in three compartments: a central one containg the 1 m3 269
of scintillator, and two smaller ones on either side to hold the
270
photomultipliers and filled with highly transparent mineral oil
271
(paraffin) (Fig. 3). There are in total 16 PMTs (8 on each side)
272
of Hamamatsu R5912 type2, 8-inch diameter, the gain and the
273
read-out electronics of which are optimized for the neutron
cap-274
ture events. In addition, 6 smaller PMTs (3 on each side) of
275
Philips VALVO XP 2262 type3, 2-inch diameter, are installed 276
in between of these 8-inch photomultpliers. Since a typical
277
muon signal is well above the dynamic range of the PMT’s
278
used for the neutron registration, the 2-inch PMT’s are
oper-279
ated at a gain adapted to the typical muon energy deposit of
280
the order of 100 MeV. The entire container holding all liquids
281
is made of a transparent plexiglass. A collection of
scintilla-282
tion light thus benefits from the total reflection at the outside
283
surfaces. In order to avoid a pressure build-up possible due
284
to a temperature variation, an expansion bag filled with an
ar-285
gon gas is connected to the scintillator volume through a siphon
286
system. The plexiglass chamber is wrapped with an aluminum
287
foil to further improve the light collection. It is then placed in
288
an aluminum vessel as a safety container. Finally, the system
289
is surrounded by iron plates (excluding top plane) to reflect a
290
fraction of neutrons back to the scintillator. To allow a
coin-291
cidence measurement of the incident muon, the NC is coupled
292
electronically with the existing muon veto of the
EDELWEISS-293
II experiment. This veto system (µVeto) is constructed from 42
294
plastic scintillator modules (BC-412 type from St.Gobain) with
295
a total of 100 m2 of surface. It is further extended by an ad-296
ditional module (5x65x315 cm3) placed on top of the neutron 297
detector and the 2-inch PMTs of the NC, described above. The
298
complete set-up is positioned right near the western wall of the
299
EDELWEISS muon veto system.
300
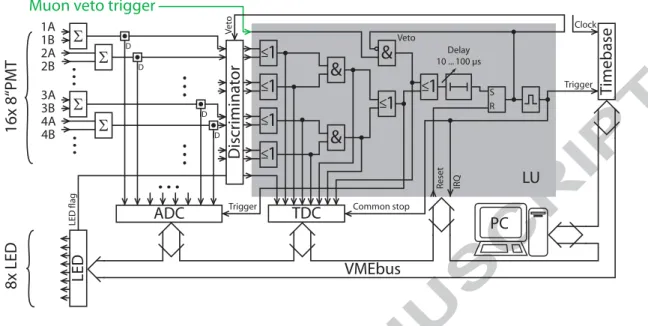
3.3. Data acquisition
301
As was described in Sect. 3.1, two event signatures for
muon-302
induced neutrons are considered: i) A high energy muon
trig-303
gers either the muon system only or the muon veto and the
304
neutron counter together. A delayed signal due to a neutron
305
capture is then looked for in the NC; ii) Multiple trigger
occur-306
2these PMT’s are called neutron PMT’s in the following
3these PMT’s are named correspondently muon PMT’s
ACCEPTED MANUSCRIPT
Paraf
fin
Gd-loaded scintillator
µ
muon veto module
Lead bricks
Leak sensorn'
s siphon8''
8''
2'' 0 6 3 7 1 2 4 5Figure 3: Left: general layout of the neutron counter detector, positions of LED’s are indicated by stars. Right: a view from inside of the installed but not yet filled
scintillator chamber, 8 of the 8-inch and 3 of the 2-inch PMTs are seen. Numbers indicate different PMT groups consisting of two 8-inch PMTs (A,B) each.
Scintillator thickness (cm) 0 20 40 60 80 100 started / N detected N 0 0.05 0.1 0.15 0.2 0.25 0.3 0.35 0.4 0.45 0.5 = 0.5 MeV n E = 2 MeV n E = 10 MeV n E = 15 MeV n E = 50 MeV n E 3 MeV ≥ dep γ E
Figure 2: Neutron detection efficiency, i.e. number of registered neutrons vs. number of incident neutrons, as a function of scintillator thickness (GEANT4 simulation). Neutron is considered to be registered when it is captured and the following γ’s deposit in the scintillator a sum energy above 3 MeV in this case. Neutrons start isotropically with different energies (indicated on the plot) and equally distributed over a horizontal bottom surface of the detector.
rence happens in the NC detector within a defined time window
307
(tDAQ ≈ 60 µs). The developed data acquisition system (DAQ) 308
accounts for both of these possibilities and allows to configure
309
two different measurement subsystems separately optimized for
310
cases i) and ii). It is based on VME electronics, integrated into
311
the µVeto DAQ and uses specially built software in a Linux
en-312
vironment. First, in order to enhance the light collection two
313
neighboring neutron PMT’s (denoted A and B, Fig 3(right) and
314
Fig. 4) are combined into one group with individual high
volt-315
age supply. Thus, already summed signals are used for an event
316
selection and one measurement subsystem consists of 4 PMT
317
groups, 2 on each side. The signals of each group are split and
318
sent to a discriminator, CAEN V895, as well as with a delay
319
to a flash analog-to-digital converter (ADC), CAEN VX1720,
320
250 MS/s. Once a threshold is exceeded, logic ECL signals
321
generated by the discriminator are delivered to a in-home
devel-322
oped Logic Unit (LU), based on field-programmable gate array
323
(FPGA). This LU takes care of the final acceptance of the event,
324
where the event is considered to happen when at least two
op-325
posite PMT groups related to the same measurement subsystem
326
get a light signal above threshold. In the LU module this is
re-327
alized as follows. Signals from two neighboring PMT groups
328
primarily pass through an OR-logic. Two OR-units having as
329
an input the signals of opposite PMT groups are then wired
330
to an AND-logic, which are thus 2 in total and define our two
ACCEPTED MANUSCRIPT
measurement subsystems. A coincidence on any of these two
332
AND-units gives a trigger to the flash ADC to convert an analog
333
signal. After a defined delay of tDAQ≈ 60 µs, the LU generates 334
a common stop signal, i.e. ends the acquisition cycle, actuates
335
the DAQ software and withdraws a time stamp of the triggering
336
event from an external clock (10 µs precision). The latter allows
337
to get a direct correspondence between NC and µVeto events.
338
Each of the described above OR- and AND-outputs is connected
339
to a time-to-digital converter (TDC), LeCroy 1176, which
al-340
lows to have a time information of individual hits within the
341
event with the resolution of 1 ns. The flash ADC allows to
re-342
construct an energy signal of every individual hit within tDAQ 343
without creating a dead time. In addition, the LU card is
trig-344
gered also in case of a muon-like event registered by the µVeto.
345
While the DAQ software records an acquired event, the VME
346
bus is locked to avoid distortion of the data. Once the event is
347
processed, the VME bus is reset and the system is ready for a
348
next event. The dead time to treat an event was measured with
349
a pulse generator and was found to be 6.76 ± 0.08 ms, while the
350
typical raw count rate of the NC is 10 Hz.
351
3.4. Monitoring systems
352
When dealing with liquid scintillators, especially Gd-loaded
353
ones, it is important to control their aging as it can influence
354
the registration efficiency with time. For this purpose the NC
355
is equipped with a dedicated system of light-emission-diodes
356
(LED) of 425 nm wavelength, corresponding to the maximum
357
emission of the scintillator. There are 8 LED’s in total: seven
358
located on the same flank of the NC and one, marked ”0”, in the
359
center of the top plain (Fig. 3(left)). Their control is performed
360
from the DAQ computer via a specifically designed VME-based
361
module. It is possible to adjust the voltage of each LED and an
362
individual time of firing, while the duration of a light pulse is
363
fixed by electronic components resulting in a PMT signal of
364
about 10 ns (FWHM). The corresponding electronics is based
365
on the LED calibration system designed for the Pierre Auger
366
Observatory [26]. The control module also generates at the time
367
of LED ignition a logic pulse, or LED flag, which is then given
368
as an input to the TDC of the DAQ (Fig. 4). This flag allows
369
to clean out the data from the LED entries while searching for
370
the muon-induced events in an offline analysis. The LED’s are
371
typically ignited three times per day with a frequency of 1 Hz
372
in a predefined cycle.
373
Another issue of the liquid scintillator used is its
pseudoc-374
umene base, which requires a careful handling. A safety system
375
was thus designed and installed. It contains several vapour
de-376
tectors, two liquid leak sensors, temperature measurement
out-377
side and inside of the system as well as monitoring of the siphon
378
level. All parameters are accessible online through a web-based
379
interface. More details on this slow control monitoring can be
380
found in [27].
381
4. Commissioning
382
The NC detector was installed in LSM in autumn 2008. After
383
a commissioning period, data-taking started in early 2009.
384
4.1. Control of the scintillator transparency
385
Data acquired each day with the LED’s are analyzed to
mon-386
itor the light properties of the scintillator in the following way:
387
one of the central LED’s, e.g. LED0, is used first to normalize 388
the gain of the PMT’s and to account for any temporal
fluc-389
tuations of PMT’s and electronics. Then for the measurement
390
performed with a non-central LEDi, a ratio of ADC signals of 391
“near” PMT’s, i.e. those located closer to the chosen LEDi , 392
and “far” PMT’s is calculated:
393
ηi=
ADC(i)near PMT0s/ ADC (0) near PMT0s
ADC(i)f ar PMT0s/ ADC (0) f ar PMT0s
, i= 1 .. 7
394
Any changes of ηi over time can thus be attributed only to 395
changes in light transport, predominately in the transparency
396
of the scintillator. The parameters ηi are monitored on an 397
everyday basis and 4-months trends measured with two
non-398
central but symmetrically-positioned LED’s, LED2 and LED4 399
(Fig. 3(left)), show consistent relative changes of the η-ratio
400
(Fig. 5). Analysis of the combined data yields a degradation
401
of 15.5±3.1 % per year as the weighted average. A degrading
402
ACCEPTED MANUSCRIPT
<–1
&
&
< –1
< –1
< –1
< –1
< –1
&
TDC
Common stop Ve to Veto Trigger Trigger IRQ ResetLU
Σ
Σ
Σ
D D D DADC
Discriminat
or
Σ
...
...
...
16x 8“P
M
T
LED
8x LED
Timebase
Delay 10 ... 100 µs Clock LED flagVMEbus
PC
Muon veto trigger
R S 1A 1B 2A 2B 3A 3B 4A 4B
...
...
Figure 4: General layout of the VME-based data acquisition, see Sect. 3.3 for details.
light signal can be compensated by increasing the PMT
sensi-403
tivity accordingly, e.g. by raising the high voltage of the PMTs.
404
In such case this degradation is acceptable for an expected run
405
period of the NC of 2-3 years. The fluctuations of the η-ratio
406
seen in Fig. 5 are typically correlated with variations of the
407
scintillator temperature. The same η-ratio is also reconstructed
408
in GEANT4 simulations of the NC with light propagation
in-409
cluded. The aluminum foil is described with the
groundfront-410
painted model for a diffuse reflection. A value of 0.9 for Al
411
reflectivity is taken, optical properties of the scintillator and the
412
plexiglass are considered. A difference between the absolute
413
η-values of two measurements as seen in Fig. 5 can be
repro-414
duced in the simulations and can be explained by a
misaligne-415
ment of the LED’s and the directional property of the LED light.
416
At present, this simulation agrees with the measurement within
417
20% and further improvement of the light tracking model is
on-418
going.
419
4.2. Identification of muon events
420
Since the described detector is accompanied by two
com-421
plementary systems to identify in particular a muon crossing
422
the NC (µVeto plastic scintillator module on top and the muon
423
PMT’sinside of the NC), their performance has to be checked
424
as well. The average energy of muons passing the mountain
425 date 17/01/09 16/02/09 18/03/09 17/04/09 17/05/09 16/06/09 i η Monitoring parameter 2 2.5 3 3.5 4 4.5 -1 3.6% year ± = 15.6 η / η ∆ : 2 LED 2 η -1 6.0% year ± = 15.1 η / η ∆ : 4 LED 4 η
Figure 5: Long term behaviour of the scintillator transparency: 4-months trends
of the η ratio for two non-central LED’s: LED2(top) and LED4(bottom) (see
ACCEPTED MANUSCRIPT
Entries 903 Mean 218.9 RMS 145.9 / ndf 2 χ 41.1 / 38 Constant 165.1 ± 10.4 MPV 98.0 ± 5.3 Sigma 54.4 ± 4.4 E (MeV) 0 50 100 150 200 250 300 350 400 450 Events / 10 MeV 0 20 40 60 80 100 120 140 160 Entries 903 Mean 218.9 RMS 145.9 / ndf 2 χ 41.1 / 38 Constant 165.1 ± 10.4 MPV 98.0 ± 5.3 Sigma 54.4 ± 4.4 Entries 903 Mean 218.9 RMS 145.9 / ndf 2 χ 41.1 / 38 Constant 165.1 ± 10.4 MPV 98.0 ± 5.3 Sigma 54.4 ± 4.4Figure 6: Energy deposition measured with the muon PMT’s of NC for the events in coincidence with the µVeto module on top of the NC, live time is 177.9 days. Last bin contains events with energy deposition of E≥440 MeV (overflow bin). Landau distribution is fitted to the data and calibrated with MC simulations of muons passing through the NC.
overburden isDELS Mµ E = 260 − 290 GeV, thus one expects
en-426
ergy losses in a 50 cm thick detector following a Landau
distri-427
bution. By selecting events registered by both muon PMT’s and
428
the top µVeto module and reconstructing their energy deposit in
429
the volume of the neutron detector, one finds a good agreement
430
with a Landau expectation (Fig. 6). This spectrum is rather
431
broad due to a superposition of various track lengths ranging
432
from more than 50 cm to very short ones for grazing muons in
433
the NC. The count rate of events that trigger both systems is
434
Γµ= 5.1 ± 0.2 /day, from which one can deduce the muon flux 435
in LSM using the geometrical area and the solid angle of the
436
system. The geometrical overlap is S=1.3 m2, the solid angle 437
is less than 2π due to a 15 cm gap between the µVeto module
438
and the liquid scintillator level in the NC due to the
mechani-439
cal support. In addition, a fraction of muons is missed due to
440
short track lengths of grazing muons leading to energy deposits
441
below the threshold (see the low energy cutoff in Fig. 6). All
442
together, this results in an effective reduction of the measured
443
muon flux estimated to be as large as 30%. Correcting for this,
444
we get an estimated muon flux of 5/m2/day which is in
agree-445
ment with an earlier measurement ofΦµ= 4.98 ± 0.09 /m2/day 446 [22]. 447 E (MeV) 0 2 4 6 8 10 12 Events / 50 keV 0 200 400 600 800 1000 1200 1400 1600 1800
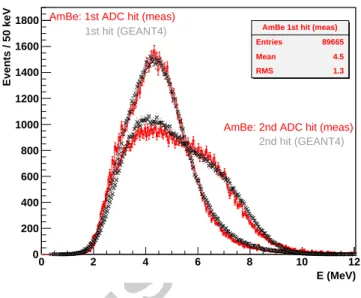
AmBe 1st hit (meas) Entries 89665 Mean 4.5 RMS 1.3
AmBe: 1st ADC hit (meas) 1st hit (GEANT4)
AmBe: 2nd ADC hit (meas) 2nd hit (GEANT4)
Figure 7: Energy spectra acquired with AmBe source (spectra of the first and second ADC hits are shown) (solid lines). Both ADC hits of AmBe measure-ment are compared with corresponding GEANT4 simulations (crosses, dashed line)(see text for details).
4.3. Verification of neutron detection
448
An energy threshold of the NC has to be set such that most
449
of an intrinsic background is excluded but the registration
ef-450
ficiency for γ’s after the neutron capture is still high enough.
451
Hence, this value was chosen to be around 2.5 MeV in the
cen-452
ter of the detector. For the measurement of the neutron yield
453
due to untagged muons the energy threshold is set to an even
454
higher value of 3.5 MeV to further suppress accidental and
455
correlated background. In order to put a proper value of the
456
electronic threshold and to tune the gain of neutron PMT’s, a
457
60Co source was used first. Two gammas of 1173.2 keV and 458
1332.5 keV are emitted in more than 99.9% of decays giving
459
2506 keV of deposited energy when both gammas get fully
ab-460
sorbed in the NC volume. Once the PMT parameters and the
461
discriminator threshold were found with 60Co, a fine tuning
462
of the gain was done with the central LED. Then, an AmBe
463
source was used to verify the ability of the system to detect
464
neutrons. An advantage of this neutron source is that in 60%
465
of the cases the (α,n) reaction on Be leads to an excited12C∗ 466
state, which is then transfered to the ground state within 61 fs
467
by emitting a gamma of 4438 keV. This gamma is a perfect
468
trigger to start the acquisition window in order to look for a
469
ACCEPTED MANUSCRIPT
following neutron capture signal. In this respect it nicely
re-470
sembles the primary trigger during a physics run and gives an
471
additional reference for the energy calibration. It is also to be
472
expected that some of the neutrons from AmBe source will first
473
produce a prompt recoil proton and only then be captured on
474
Gd. Thanks to the flash ADC used one can separately look
475
into an energy spectrum of the first hit and any following one
476
within the same event. As it can be seen from Fig. 7, the
pri-477
mary hits form predominantly a bell-shaped spectrum specific
478
to a prompt gamma while the secondary hits lead to a smoother
479
spectrum which extends to higher energies, as one expects for
480
partially escaping gammas appearing due to the neutron
cap-481
ture (see Sect. 3.2). The same behaviour is also confirmed in
482
GEANT4 simulations (toolkit version 9.2.p01) of AmBe source
483
where elastic scattering off hydrogen, carbon and gadolinium
484
nuclei, inelastic scattering on carbon, capture on gadolinium
485
and hydrogen nuclei and an energy quenching present for less
486
ionizing particles are taken into account (Fig.7, crosses). The
487
initial kinetic energy of neutrons is generated according to an
488
energy distribution of AmBe source. A simplified model with
489
a common fixed threshold and an energy resolution scaled as
490
∆E(E) = ∆E(4.4 MeV) × √E(MeV)/4.4 (MeV) is used in
491
the simulations, with a 2.8 MeV threshold and the energy
res-492
olution ∆E(4.4 MeV) = 700 keV as best fit. While the same
493
values of the threshold and the resolution are used in the
simu-494
lations to fit both measured ADC hits, the energy scaling of two
495
spectra differs by 7%. This is due to a position dependence of
496
the light collection and the fact that 4.4 MeV γ’s are absorbed
497
closer to the place of the AmBe source than neutron-capture
498
gammas. Although the light propagation is not yet taken into
499
account, a general good agreement between the measurement
500
and the simulations is obtained (Fig.7). Another verification
501
of neutron capture on Gd is possible with the timing
informa-502
tion, i.e. by looking into time intervals between the start of the
503
event and any following hit (Fig. 8). Neutrons of several MeV
504
need first to thermalize in the medium of the detector and only
505
then get captured following an exponential law with a
charac-506
teristic time, the capture time, depending on the Gd content of
507 Entries 248768 Mean 18473.1 RMS 12317.1 / ndf 2 χ 159.5 / 139 bckg 43.4 ± 11.9 const 5011.1 ± 78.4 capture τ 16587.6 ± 312.8 TDC #ch (ns) 0 10000 20000 30000 40000 50000 Events / 250 ns 0 500 1000 1500 2000 2500 Entries 248768 Mean 18473.1 RMS 12317.1 / ndf 2 χ 159.5 / 139 bckg 43.4 ± 11.9 const 5011.1 ± 78.4 capture τ 16587.6 ± 312.8 Entries 248768 Mean 18473.1 RMS 12317.1 / ndf 2 χ 159.5 / 139 bckg 43.4 ± 11.9 const 5011.1 ± 78.4 capture τ 16587.6 ± 312.8 ) capture τ exp( - t / ⋅ fit(t) = bckg + const
Figure 8: AmBe measurement: time difference between a start of the event
(first hit) and any following TDC hit within the acquisition time. The falling edge is fit with an exponential function and a flat background component.
Table 1: Capture time simulated in GEANT4 as a function of Gd content. In
order to extract τcapturethe same interval and binning as in the measured data
were used for fitting. No background is assumed.
Gd content, % 0.18 0.19 0.20 0.21 0.22
τcapture, ns 17800 17100 16290 15600 15000
∆τcapture, ns ±100 ±100 ±90 ±80 ±80
the used scintillator. Measured data (Fig. 8) confirm well this
508
description. Fitting the falling part of the spectrum and
consid-509
ering a flat background, one extracts τcapture = 16.6 ± 0.3 µs. 510
The same time constant is obtained in GEANT4 (Tab. 1) where
511
various values of the Gd content can be considered. The
simu-512
lated data are in good agreement with the measured τcaptureand 513
0.20% of Gd admixture specified by the manufacturer (Tab. 1).
514
For further comparison we use the mean time of the measured
515
distribution, htiAmBe= 18.5 µs, because it accounts also for the 516
effect of neutron moderation and can be easily used in case of
517
low statistics.
518
The calibration runs using the60Co and AmBe sources are 519
regularly executed in order to monitor the response of the
de-520
tector under well-defined circumstances.
ACCEPTED MANUSCRIPT
DAQ #nb of secondaries within T 0 1 2 3 4 5 6 7 8 Events -1 10 1 10 2 10 Poisson (calc) Measured =8.8 ∆ = 3 ∆ = 1 ∆ ∆= 1 Entries 24 Mean 16689 ± 2978 RMS 14588 ± 2106 TDC #ch (ns) ∆ 0 10000 20000 30000 40000 50000 60000 Events / 2500 ns 0 1 2 3 4 5 6 7 8 Entries 24 Mean 16689 ± 2978 RMS 14588 ± 2106 Entries 24 Mean 16689 ± 2978 RMS 14588 ± 2106Figure 9: First data from a physics run, events selected with the µVeto module on top of the NC and the muon PMT’s first: number of secondaries within one event vs. Poisson expectation (left) and the time intervals between first and any following TDC hit (right). Live time of both systems running together is 51 days.
DAQ #nb of secondaries within T 0 1 2 3 4 5 6 7 8 Events 1 10 2 10 3 10 4 10 5 10 6 10 Poisson (calc) Measured =57.2 ∆ = 7 ∆ = 1 ∆ ∆= 1 ∆= 1 Entries 91 Mean 18732 ± 1571 RMS 14988 ± 1111 TDC #ch (ns) ∆ 0 10000 20000 30000 40000 50000 60000 Events / 2500 ns 0 2 4 6 8 10 12 14 16 18 Entries 91 Mean 18732 ± 1571 RMS 14988 ± 1111 Entries 91 Mean 18732 ± 1571 RMS 14988 ± 1111
Figure 10: Preliminary data from a physics run, only neutron counter selected events: number of secondaries within one event vs. Poisson expectation (left) and the time intervals between first and any following TDC hit (right). Live time of the NC for this data set is 56 days.
ACCEPTED MANUSCRIPT
5. Preliminary physics data
522
As a proof-of-principle we show in the following a
prelim-523
inary analysis of physics runs. The muon-induced neutrons
524
can be identified by the following features as described before:
525
they produce multiple correlated hits within one event with
dis-526
tribution of time intervals similar to the one obtained for the
527
AmBe source (Fig. 8). The energy distribution of secondary
528
ADC hits extends to higher values, i.e. well above the
back-529
ground spectrum. In the first analysis, we identify a prompt
530
muon together with correlated secondary neutrons as to study
531
the neutron production by the well-tagged muons. The muon
532
candidates are defined by a coincidence of the µVeto module
533
on top of the neutron detector and the muon PMT’s. Then,
534
by using the time stamps of these events, a corresponding set
535
of NC data is selected. Fig. 9(left) shows the measured
num-536
ber of secondaries following a muon event and an expectation
537
of Poisson distributed background of accidental coincidences
538
based on the single hit rate. Only those secondaries are accepted
539
which are at least 200 ns apart from the primary hit and each
540
other, in order to avoid an effect of PMT afterpulses. As can
541
be seen, there is a clear excess of measured secondaries above
542
the background (∆-values on Fig. 9(left)). The corresponding
543
time distribution of these secondary hits (Fig. 9(right)) has a
544
mean value hti = 17 ± 3 µs, which is clearly different from
545
a central value of 29.8 µs specific for a random hit
distribu-546
tion within the DAQ window of 59.6 µs, and in agreement with
547
htiAmBe = 18.5 µs. Furthermore, we performed a Kolmogorov-548
Smirnov (KS) test on unbinned data of Fig. 8 and Fig. 9(right).
549
This yields prob.(KS)=0.1 showing consistency of both spectra
550
at a significance level of α=0.05. In overall, within the 51 live
551
days analysed here we identify 24 neutrons detected after the
552
muons with an accidental background expectation of 0.2. This
553
gives us a count rate of about 0.5 muon-induced neutrons per
554
day.
555
To search for neutrons produced due to untagged muons, we
556
look into neutron counter data only and multiple hit events.
557
This is possible if the neutron PMT’s are tuned in such a way
558
that the rate of accidental coincidences is well below an
ex-559
pected rate of muon-induced neutrons. To fulfill this
require-560
ment, half of the neutron PMT’s was set to a reduced gain.
561
Fig. 10 presents corresponding distributions of the number of
562
secondaries and of related time intervals. As in the first
analy-563
sis, the time cut of 200 ns is applied between consecutive hits.
564
As one can see, there is again a clear excess of measured data
565
above the Poisson-based expectation of the background (
∆-566
values on Fig. 10(left)). The mean value hti= 18.7 ± 1.7 µs is
567
also in good agreement with htiAmBe = 18.5 µs. As above, KS-568
test is applied on unbinned data of Fig. 8 and Fig. 10(right) and
569
results in prob.(KS)=0.3, denoting consistent spectral shapes at
570
a significance level α=0.05. The live time of this data set is
571
56 days. The data selection results in 75 events with
mini-572
mum one secondary produced, among which there are 10 events
573
with 2 or more secondaries detected. The expected accidental
574
background is 7.8 and contributes to events with only one
sec-575
ondary particle. First simulations show that correlated
back-576
ground from ambient neutrons contributes less than 10 events
577
and from the Bi-Po decay chain less than 1 event, both with 1
578
secondary only. The full sample was also checked for a
coin-579
cidence with the µVeto module on top of the neutron detector
580
and the muon PMT’s. Ten events with at least one secondary
581
could be attributed to a tagged muon. Thus, the excess shown
582
in Fig. 10(left) clearly indicates muon-induced neutrons
with-583
out requiring to detect the primary muon.
584
It is evident, that the first physics data show qualitatively the
585
ability of the system to register muon-induced neutrons while
586
a quantitative analysis of the production rate of these neutrons
587
requires longer time of running to gather larger statistics and
588
further detailed simulations to extract accurate detection e
ffi-589
ciencies.
590
6. Conclusion and outlook
591
A neutron detection system based on 1 m3of Gd-loaded scin-592
tillator has been described. The purpose of this dedicated
in-593
strument is to measure specifically the muon-induced neutron
594
background in the environment of present and planned dark
595
matter experiments, e.g. EDELWEISS-II and EURECA, hosted
ACCEPTED MANUSCRIPT
by the LSM underground laboratory. This background is of
597
concern for the DM searches and thus the neutron detector is
598
in-locationof the DM setups. The NC system was installed in
599
fall 2008 and, as the calibration and first physics runs show, it
600
is fully operational. The aim of the measurement is to detect, in
601
particular, the neutron yield in Pb both with or without tagging
602
the primary muons. More detailed and accurate Monte-Carlo
603
simulations taking into account all the aspects, e.g. the muon
604
interaction, the neutron production, a light propagation, are
un-605
der further development. The preliminary analysis of physics
606
data show that the count rate of muon-induced neutrons in the
607
order of 1 neutron/day has been achieved. Data-taking will
con-608
tinue through 2010 and early 2011 to get sufficiently large
sta-609
tistics.
610
Acknowledgments
611
The help of the technical staff of the Karlsruhe Institute of
612
Technology, N. Bechtold, A. Felden, S. Jokisch and G.
Pro-613
kott, and of the Laboratoire Souterrain de Modane is gratefully
614
acknowledged. This work is in part supported by the German
615
Research Foundation (DFG) through the Transregional
Collab-616
orative Research Center SFB-TR27 as well as by the EU
con-617
tract RII3-CT-2004-506222 and the Russian Foundation for
Ba-618
sic Research (grant No. 07-02-00355-a).
619
References
620
References
621
[1] E. Armengaud et al., in preparation; V.Yu. Kozlov for the
EDEL-622
WEISS Collaboration, EPS-HEP09, Krakow, Poland, 2009,
PoS(EPS-623
HEP 2009) 091 (http://pos.sissa.it); V. Sanglard for the EDELWEISS
624
Collaboration, TAUP09, Rome, Italy, 2009, arXiv:0912.1196v1
[astro-625
ph.CO].
626
[2] E. Armengaud et al., Phys. Lett. B 687, (2010) 294; arXiv:0912.0805v1
627
[astro-ph.CO].
628
[3] H. Kraus et al., Nucl. Phys. B (Proc. Suppl.) 173, (2007) 168.
629
[4] A. Broniatowski et al., Phys. Lett. B 681, (2009) 305 and references there
630
in; arXiv:0905.0753v1 [astro-ph.IM].
631
[5] A. Chantelauze, Investigation of the muon-induced background of the
632
EDELWEISS-II experiment, Ph.D. thesis, Universit´e Blaise Pascal,
633
Clermont-Ferrand, 2009.
634
[6] V.A. Kudryavtsev et al., Nucl. Instrum. Meth. A 505, (2003) 688.
635
[7] H. M. Ara´ujo et al., Nucl. Instrum. Meth. A 545, (2005) 398.
636
[8] D.-M. Mei and A. Hime, Phys. Rev. D 73, (2006) 053004.
637
[9] S. Agostinelli et al., Nucl. Instr. Meth. A 506, (2003) 250.
638
[10] A. Fass´o, A. Ferrari, P.R. Sala, in: A. Kling, F. Barao, M. Nakagawa, L.
639
Tavora, P. Vaz (Eds.), Proceedings of the Monte Carlo 2000 Conference
640
(Lisbon, October 2326, 2000), Springer, Berlin, 2001, p. 159; A. Fass´o,
641
A. Ferrari, J. Ranft, P.R. Sala, in: A. Kling, F. Barao, M. Nakagawa, L.
642
Tavora, P. Vaz (Eds.), Proceedings of the Monte Carlo 2000 Conference
643
(Lisbon, October 2326, 2000), Springer, Berlin, 2001, p. 995.
644
[11] G.V. Gorshkov et al., Sov. J. Nucl. Phys., Vol.18, No.1 (1974) 57 and
645
references there in.
646
[12] L. Bergamasco, S. Costa, P. Picchi, Il Nuovo Cimento 13A, (1973) 403.
647
[13] H. Wulandari, et al., hep-ex/0401032.
648
[14] H. M. Ara´ujo et al., Astropart. Phys. 29, (2008) 471; arXiv:0805.3110v1
649
[hep-ex].
650
[15] S. Rozov et al., submitted to J. Phys. G: Nucl. Phys;
651
arXiv:1001.4383v1 [astro-ph.IM].
652
[16] R. Hennings-Yeomans, D.S. Akerib, Nucl. Instr. Meth. A 574, (2007) 89.
653
[17] R. Arnold et al., Phys. Rev. Lett. 95, (2005) 182302.
654
[18] I. Nasteva et al., HEP 2009 (EPS-HEP 2009), Cracow, Poland, 16-22 Jul
655
2009; arXiv:0909.3167v1 [hep-ex].
656
[19] C. Amsler et al. (Particle Data Group), Phys. Lett. B 667, (2008) 1.
657
[20] M. Horn, Simulations of the muon-induced neutron background of
658
the EDELWEISS-II experiment for Dark Matter search, Ph.D.
the-659
sis, Universit¨at Karlsruhe (TH), 2007 and FZKA scientific report 7391
660
(http://bibliothek.fzk.de/zb/berichte/FZKA7391.pdf)
661
[21] A. Chantelauze for the EDELWEISS Collaboration, SUSY2007
Karl-662
sruhe, Germany, 2007; arXiv:0710.5849v1 [astro-ph].
663
[22] Ch. Berger et al., Phys. Rev. D 40, (1989) 2163.
664
[23] R. Lemrani et al., J. Phys. Conf. Ser. 39, (2006) 145.
665
[24] V. Chazal et al., Astropart. Phys. 9, (1998) 163.
666
[25] R.B. Firestone et al., Table of isotopes. 8th edition, New York: Wiley,
667
1998.
668
[26] J. Abraham et al., Nucl. Instr. Meth. A 523, (2004) 50.
669
[27] V.Yu. Kozlov for the EDELWEISS Collaboration, IDM08
Stock-670
holm, Sweden, 2008, PoS (idm2008) 086 (http://pos.sissa.it);
671
arXiv:0902.4858v1 [astro-ph.IM].
672