HAL Id: hal-02339648
https://hal.archives-ouvertes.fr/hal-02339648
Submitted on 4 Nov 2019HAL is a multi-disciplinary open access
archive for the deposit and dissemination of sci-entific research documents, whether they are pub-lished or not. The documents may come from teaching and research institutions in France or abroad, or from public or private research centers.
L’archive ouverte pluridisciplinaire HAL, est destinée au dépôt et à la diffusion de documents scientifiques de niveau recherche, publiés ou non, émanant des établissements d’enseignement et de recherche français ou étrangers, des laboratoires publics ou privés.
How to get an enhanced extended uncertainty associated
with decay heat calculations of industrial PWRs with
the DARWIN2.3 package
J. Huyghe, V. Vallet, D. Lecarpentier, C. Reynard-Carette, C. Vaglio-Gaudard
To cite this version:
J. Huyghe, V. Vallet, D. Lecarpentier, C. Reynard-Carette, C. Vaglio-Gaudard. How to get an en-hanced extended uncertainty associated with decay heat calculations of industrial PWRs with the DARWIN2.3 package. European Physical Journal N (EPJ N), - Nuclear Sciences and Technologies, 2018. �hal-02339648�
How to get an enhanced extended uncertainty associated with decay heat
calculations of industrial PWRs with the DARWIN2.3 package
J. Huyghe1*, V. Vallet1, D. Lecarpentier2, C. Reynard-Carette3 and C. Vaglio-Gaudard1
1 CEA, DEN, DER Cadarache, F-13108 Saint Paul les Durance, France
2 EDF Research and Development, 7 Boulevard Gaspard Monge, 91120 Palaiseau, France
3
Aix Marseille Univ, Université de Toulon, CNRS, IM2NP, Marseille, France
* Corresponding author: jordan.huyghe@cea.fr
Abstract– The decay heat is a crucial issue for in-core safety after reactor shutdown and
back-end cycle. An accurate computation of its value is done at the CEA within the DARWIN2.3 package. The DARWIN2.3 package benefits from a Verification, Validation and Uncertainty Quantification (VVUQ) process. The VVUQ ensures that the parameters of interest computed with the DARWIN2.3 package have been validated over experimental measurements and that biases and uncertainties have been quantified for a particular domain. For the parameter “decay heat”, there are few integral experiments available to ensure the experimental validation over the whole range of parameters needed to cover the French reactor fleet (fissile content, burnup, fuel, cooling time). The experimental validation currently covers PWR UOX fuels for cooling times only between 45 minutes and 42 days, and between 13 and 23 years. Therefore the uncertainty quantification step is of paramount importance in order to increase the reliability and accuracy of decay heat calculations. This paper focuses on the strategy that could be used to answer this issue with the complement and the exploitation of the DARWIN2.3 experimental validation.
Index Terms – Decay heat, DARWIN2.3, uncertainty quantification, transposition,
I. INTRODUCTION
The nuclear decay heat is released by both radioactive decays of unstable fuel and material structures isotopes after the reactor shutdown. The delayed fissions caused by delayed neutrons contribute significantly to the decay heat up to 100 seconds after the reactor shutdown. The decay heat reaches about 7% of the nominal power one second after the reactor shutdown [1] and is still about 1.5% of the nominal power one hour later, i.e. 40 MW for a 900MWe Pressurized Water Reactor (PWR).
The heat removal is one of the 3 key reactor safety functions, the other two being radioactivity containment and nuclear chain reaction control. The decay heat is thus an important parameter for the safety demonstration for a reactor operation under normal or accidental conditions and back-end nuclear cycle. Indeed, the decay heat is a dimensioning parameter for normal and emergency cooling systems of the nuclear core after the shutdown (up to 8 days) for a reactor in operation. It also imposes delays before the different stages of fuel discharging, storage and transportation (from 5 days to 10 years) until the reprocessing step or vitrification process and final storage (from 4 years to more than 300,000 years). Therefore, the accurate control of the decay heat calculation is essential for all the PWRs in the French reactor fleet (UOX and MOX fuels with 235U enrichments going from 1.0 to 5.0 wt% and average plutonium contents going from 4.0 to 11.0 wt%) over a wide range of cooling times (from the reactor shutdown moment to more than 300,000 years).
The parameters required for fuel cycle applications - decay heat but also fuel inventory, activity, neutron, gamma, alpha and beta sources and spectra, radiotoxicity – are provided by the DARWIN2.3 [2] calculation package. This package is developed by the CEA with the support of its French partners (AREVA and EDF); it is the French reference for fuel cycle studies. The package has been extensively validated on a large number of experimental programs based on spent fuel chemical analyses carried out in France since 1993. It has also been validated for decay heat calculations on a more limited number of experimental programs based on elementary fission burst experiments and two integral calorimetric experiments, the MERCI-1 and CLAB experiments.
The objective of the paper is to present the methodological orientations to determine accurately the uncertainty associated with the DARWIN2.3 decay heat estimation. The determination of this uncertainty can be made either by nuclear data covariance matrix propagation or by exploiting the experimental validation through the transposition of the Calculation/Experiment (C/E) discrepancies; these two points will be explained in the next chapters, after a brief description of the DARWIN2.3 package for PWR fuel decay heat calculations. In this framework, the restriction linked to the DARWIN2.3 integral experimental validation exploitation will be illustrated. Perspectives for the estimation of an enhanced extended uncertainty associated with the decay heat calculations will be discussed at the end of the paper.
II. DARWIN2.3 PACKAGE FOR PWR DECAY HEAT CALCULATION
1. Description of the calculation scheme implemented in the DARWIN2.3 package
The DARWIN2.3 package is the French reference for fuel cycle studies [2]. It is used as a reference for the validation of the industrial tool CESAR [3] for nuclear fuel and waste characterization at the AREVA La Hague reprocessing plant. It is dedicated to all fuel cycle studies for PWRs, Boiling Water Reactors, Material Testing Reactor (MTR) but also fast sodium-cooled reactors. DARWIN2.3 enables the estimation of physical quantities that characterize reactor spent fuels. In this chapter, the description of the DARWIN2.3 package is focused on the PWR application, with UOX and MOX fuels.
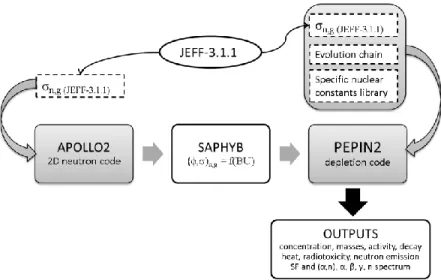
The PWR DARWIN2.3 calculation route is based on the chaining between the APOLLO2 [4] 2D transport code and the DARWIN/PEPIN2 [8] depletion solver with two successive steps (Figure 1). The APOLLO2 calculation step solves the Boltzmann and the Bateman equations, with a simplified depletion chain, containing 162 isotopes corresponding to actinides, structural materials and 126 fissions products. The APOLLO2 calculation route uses the European JEFF-3.1.1 nuclear data library [5], processed in a 281-group-structure Santamarina-Hfaiedh energy mesh (SHEM) [6]. The neutron flux is calculated in a 2D assembly geometry, using a Pij multicell model: the UP1 interface current method based on linearly anisotropic interface flux. The fuel pellets are split into four rings in order to give an accurate representation of 238U absorption as well as fission product concentration profile. Space-dependent self-shielding, above 23 eV, is repeated at recommended burnup steps [7]. In the case of MOX assembly calculation, the UOX environment is taken into account. At the end of the APOLLO2 calculation, a library, called SAPHYB, is generated; it contains, both in the 281-group-energy structure, the fuel microscopic self-shielded cross-sections, spatially homogenized, and the 2D scalar neutron flux, tabulated versus burnup.
The PWR DARWIN/PEPIN2 calculation step solves the fuel Bateman equation, under irradiation or under cooling (i.e. with no neutron flux), with a reference depletion chain containing up to 3800 isotopes. The equation solved under neutron flux (with the 4th order Runge Kutta method) uses the self-shielded cross-sections and the 281-energy group neutron flux transmitted by the APOLLO2 code thanks to the SAPHYB. The irradiation history in DARWIN/PEPIN2 can be detailed with shutdown periods, bore concentration, moderator and fuel temperature tracking. It makes it possible to calculate precisely the depleted fuel inventory. The convolution of the fuel inventory with nuclear data leads to physical quantities such as decay heat, activity and radiotoxicity. The decay heat formula used in the DARWIN/PEPIN2 module (neglecting here the contribution of the fissions induced by delayed neutrons) is recalled in (1).
(1)
where:
is the average decay energy released for a decay of the nuclide i ; is the half life of the nuclide i ;
is the isotopic concentration of the nuclide i.
2. VVUQ process applied to DARWIN2.3 for the bias and uncertainty control
The DARWIN2.3 simulations are used to predict physical fuel cycle parameters with a quantifiable confidence and across the PWR application domain. The rigorous VVUQ process, classically used in many disciplines of science and engineering [9] [10] [11], is implemented for the DARWIN2.3 calculations, to assess the biases and uncertainties associated with the estimation of the physical parameters; it gives strength to the results for R&D and industrial applications. This process requires the following four steps [12]:
- Verification: it shows that the calculation scheme does not present programming errors and gives the expected numerical results;
- numerical Validation: in this step, the DARWIN2.3 results are compared to a ‘reference calculation’, integrating more accurate models than the calculations that have to be validated, and using the same nuclear data library. This numerical validation relies for DARWIN2.3 on several elements. It
relies on the comparisons with TRIPOLI4® [13] Monte Carlo calculations at step 0 (stationary conditions), before depletion; it enables to validate the APOLLO2 multigroup flux calculation and reaction rates, such as 235U fission, 238U radiative capture rates at step 0. The recent coupling of TRIPOLI4® stochastic transport code with the MENDEL [14] deterministic depletion solver allows to perform depletion calculations. Even though this process is not considered as a reference procedure for depletion calculation, the benchmarking between TRIPOLI4® and DARWIN2.3 has been investigated to provide first elements of modelling biases quantification [15] for fuel cycle calculations (material balance); this work tends to show that the modelling biases are limited in comparison with the biases coming from nuclear data;
- experimental Validation: it consists in comparing the calculation results of the set ‘nuclear data library + calculation scheme + codes’ to the values measured with integral experiments, for the decay heat and the material balance of the main actinides and the fission products involved in fuel cycle calculations and burnup credit criticality calculations;
- Uncertainty and bias Quantification: it consists in associating with each parameter calculated by the DARWIN2.3 package, a controlled uncertainty over a range of applications. Generally speaking, there are two ways to achieve this goal: the first one relies on the analysis of the experimental validation results when there are enough experimental data to cover the DARWIN2.3 application domain; in this case, the transposition method is then applied, in order to transpose the Calculation-over-Experiment (C/E) discrepancies. If the experimental validation cannot be exploited for DARWIN2.3, the second way relies on nuclear data covariance propagation studies. The next chapters below are dedicated to the presentation of these two ways of uncertainty quantification applied to the DARWIN2.3 package.
III. NUCLEAR DATA COVARIANCE MATRIX PROPAGATION FOR THE UNCERTAINTY ESTIMATION OF
DARWIN2.3 DECAY HEAT CALCULATION
1. Description of the deterministic propagation method implemented in the DARWIN2.3 package
The Uncertainty Quantification is currently rigorously done by covariance propagation with a deterministic approach. The covariance is a symmetric bilinear form on a vector space of random variables. The consequence is that for a parameter of interest (Y) which can be written as a linear combination of random variables (Xi), for example , its variance is given by the formula (2).
(2)
When Y is not directly a linear combination of random variables, a Taylor series expansion of Y, truncated at first order, allows the application of the formula (2). The matrix form of the formula (2) is
called the “sandwich rule” (see formula (3)), where the are the derivative of Y to (also called sensitivity coefficients).
Recently, the DARWIN2.3 package has been enriched with this covariance propagation method [16]. The DARWIN/PEPIN2 module which manages the sensitivity profile calculations and the nuclear data covariance propagation is called DARWIN/IncerD [17]. Input data are covariances taken from the European evaluation JEFF-3.1.1 for the decay data (decay periods, branching ratios, mean decay energies) and fission yields, and the CEA/Cadarache covariance matrix database COMAC-V2 [18] for cross-sections. The prior calculation uncertainty ε resulting from the propagation of uncertainties of nuclear data covariances is as follows:
(3) where:
- is the sensitivity vector due to nuclear data, - is its transpose,
- is the nuclear data covariance matrix.
When the hypothesis of linearity of the decay heat parameter to the nuclear data is not straightforward, it must be checked to ensure the legitimacy of this method [16]; it is done by comparing the results obtained with this quadratic summation method to those produced with a different uncertainty propagation method that does not need a linearity hypothesis. This is the case of the sampling approach, implemented in the URANIE/MENDEL code system developed at CEA. URANIE [19] is an uncertainty platform and MENDEL is the CEA new generation depletion code. MENDEL can use the same input data as the DARWIN/PEPIN2 code (same SAPHYB input files, nuclear data libraries and filiation chains). The sampling approach consists in selecting distribution laws for each random input (more often, Gaussian laws) and sampling them with a Latin Hypercube Sampling technique in order to have n realizations of each variable. Then, the MENDEL code is called n times with n different sets of input data according to the results of the sampling step. Eventually, the distribution of the decay heat is built and the moments are extracted.
Thus, the linearity hypothesis has been checked and allows the calculation of sensitivity profiles by direct perturbation and the propagation of nuclear data covariances through the DARWIN/PEPIN2 calculation. For the calculation of the sensitivity profiles of the decay heat to the cross-sections with DARWIN/IncerD, there is no accurate Boltzmann/Bateman coupling. The flux and reaction rates are performed in a previous calculation with the neutron code APOLLO2 and then stored in a file which is an input data for DARWIN/PEPIN2. When calculating the decay heat value resulting from the perturbation of a cross-section, it is the nominal value stored in the SAPHYB file that is perturbed
instead of recalculating the neutron spectrum with the APOLLO2 code. However, studies showed that the impact of the coupling can be neglected on the uncertainty propagation calculation for the decay heat, for cooling times between 0.1 second and 300 years [20].
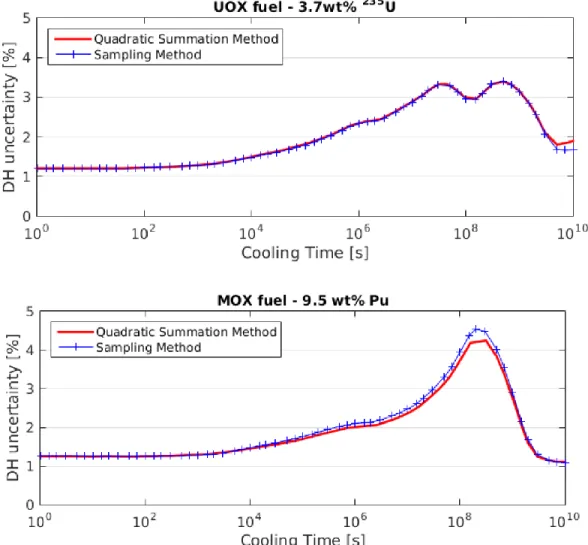
An illustration of the decay heat uncertainty estimated by the deterministic approach for standard PWR fuels is given in Figure 2; the considered fuels are a UOX fuel with 3.7 wt% enriched uranium and a MOX fuel with a mean plutonium content of 9.5 wt%, both at a 50 GWd/t discharge burnup. The uncertainty is below 3.5% (1) for the UOX fuel, and below 4.5% (1) for a MOX fuel, regardless of the cooling time.
The uncertainty estimated with the stochastic approach is also presented in Figure 2. A good accuracy between the deterministic and the stochastic method is observed (the maximum discrepancy is ~0.3%).
Figure 2: Decay heat uncertainty estimated by deterministic (DARWIN/IncerD) / stochastic (URANIE/MENDEL) approaches for UOX and MOX standard PWR fuels at a 50GWd/t discharge
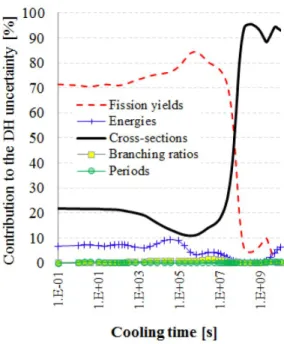
Once the sensitivity profiles are known, the main contributors to the uncertainty can be identified at a given time, as illustrated in Figure 3. In the MOX fuel case, it appears that cross-section uncertainties are responsible for about 20% of the total decay heat uncertainty at 1.0 second and for more than 90% of the total uncertainty after 108 seconds.
Figure 3: Relative contributions to the total decay heat uncertainty for the MOX case.
2. Restrictions due to nuclear data covariance matrix completeness and accuracy
The nuclear data covariance matrices play a major role on this uncertainty propagation; uncertainty propagation results highly depend on the quality, accuracy and availability of the covariance matrices. Covariance matrices are sometimes a subject for debate for experts in nuclear data. It is often hard to know precisely how a covariance matrix was produced and measure its reliability.
It must be emphasized that more than 40,000 nuclear data - corresponding to cross sections, branching ratios, decay energies, half-lives, fission yields - are involved in decay heat calculations. In the JEFF-3.1.1 evaluation, more than 7000 nuclear data do not have uncertainties, which is about 16% of the number of nuclear data in JEFF-3.1.1. Those nuclear data are mainly branching ratios and mean energies (alpha, beta, and gamma). However we need to put something down to the parameters with no uncertainty, a value which is conservative but realistic. The other nuclear data libraries are studied and expert’s advices are used for this task.
There are few covariance matrices for cross-sections or independent fission yields in the JEFF-3.1.1 library. These data are taken in the COMAC-V2 database which receives the benefit of a constant work for improvement. Even if the major part of the covariance matrices may be associated with the
JEFF-3.1.1 library, some of the covariance matrices come from a different evaluation than the one giving the centered values. It is the case of the 241Am which was re-evaluated at the CEA recently for JEFF-3.2 and whose capture cross-section was increased by about 15%. Another example is the case of the
242Pu which is a major contributor to the decay heat uncertainty through the build-up of 244Cm, a strong
contributor to decay heat (about 40% of the total decay heat around 10 years). The covariance matrix for 242Pu radiative capture cross-section actually comes from the ENDF/B-VII.1 evaluation. The collapsed uncertainty results in about 11% at one standard deviation and is responsible for more than 80% of the total decay heat variance of MOX fuels at 10 years of cooling. A new evaluation of the covariance matrix for this isotope would have an impact on the prior decay heat uncertainty of MOX fuels.
There is also a crucial lack of correlation matrices for independent fission yields, although they are strongly correlated by physical constraints of conservation and normalization. A subgroup at the Working Party of International Nuclear Data Evaluation Co-operation (WPEC, NEA) [21], whose purpose was to come up with a new methodology to produce fission yields evaluations associated with covariance matrices was proposed in 2013 and came to an end in 2016: as a conclusion, covariance matrices will be produced for the next JEFF evaluation for fission yields, based on the GEF code [22]. Covariance matrices were also produced at the CEA, associated with JEFF-3.1.1 fission yields [23] ; its large impact on decay heat uncertainty has also been quantified in [23].
Generally speaking, the nuclear data covariance propagation is the starting point for decay heat in the Uncertainty Quantification process defined in chapter II; indeed, it enables to quantify the uncertainty associated with the DARWIN2.3 calculated decay heat, assuming that the modelling calculation bias are limited, before exploiting the experimental validation results with the representativity/transposition method. The nuclear data uncertainty propagation is also necessary to implement the representativity/transposition method, as shown in the next chapter.
IV. EXPLOITATION OF THE INTEGRAL EXPERIMENTAL VALIDATION FOR THE DARWIN2.3 UNCERTAINTY QUANTIFICATION
1. Description of the experimental validation of DARWIN2.3
The current experimental validation of the DARWIN2.3 package for the decay heat is based on the following experiments:
- Elementary Fission Burst experiments [24]: An Elementary Fission Burst (EFB) of a fissile nuclide is the decay heat emitted by the fission of one nuclide by a neutron of a given energy (thermal or fast). Therefore in these experiments, neither the radiative capture effects among the fission products, nor the actinide contribution are taken into account. Nevertheless, these experiments provide valuable information in order to validate fission product contribution to the decay heat.
Historically, EFBs were used to calculate the decay heat by integration over the time and summation over the major fissile nuclides of the fuel. This method has even given birth to an international ISO standard 10645:1992 for decay heat computations [25]. The DARWIN2.3 experimental validation includes the analyses of the DICKENS and AKIYAMA experimental values (with cooling times between around 3 seconds and 8 hours) [26][27][28][29] concerning 235U or
239Pu fission in the thermal energy range; it showed a good agreement with the experimental
elementary decay heat values released with fission of a 235U or 239Pu (thermal and fast spectra); - The MERCI-1 experiment: this integral experiment was conducted in the French experimental
reactor OSIRIS at the CEA Saclay, that consisted in measuring with a calorimeter the decay heat released at short cooling times (45 minutes to 42 days) after irradiating a PWR-UOX fuel pin (with a burnup of 3.5GWd/t and 3.7% enrichment in 235U) [30]. The interpretation of the MERCI-1 experiment shows a maximum discrepancy of 6% at around 12.5 hours of cooling. Between 5 and 42 days, the uncertainties are about 1% at one standard deviation. The associated uncertainty is constant and equal to 1% at two standard deviations;
- CLAB experiments: they consist in calorimetric measurements of PWR-UOX entire assemblies at the Swedish facility CLAB [31]. Measurements are available for fifteen 17x17 assemblies and twenty-one 15x15 assemblies with different fissile contents (enrichment in 235U between 2 and 3.5%), burnup values (between 20 and 47GWd/t) and cooling times (between 12.9 and 23.2 years). The C/E discrepancies obtained with the DARWIN2.3 package are of -2.2% on average with a 3.4% uncertainty at one standard deviation. The dispersion of the results lies between +0.9% and -4.0% [2]. Besides, no correlation was detected with the burnup or the cooling times; - Post-Irradiated Experiments (PIE) on irradiated fuel: they are based on the measurement of
nuclide concentrations contributing to the decay heat also, after fuel chemical dissolution. They can also bring valuable elements for the DARWIN2.3 decay heat experimental validation [2]. Especially at long cooling times (typically over 6 months), only a few isotopes contribute to the irradiated fuel decay heat (less than 50). The major decay heat contributors for both UOX and MOX fuels after 6 months are 144Pr, 106Rh, 134Cs, 242Cm, 137mBa, 90Y, 244Cm, 238Pu and 241Am.
After the demonstration of the analyzed experiment representativity relatively to PWR fuel decay heat, the experimental validation has to be transposed to bring valuable information for the DARWIN2.3 Uncertainty Quantification step.
2. First results concerning the implementation of the representativity and transposition on the DARWIN2.3 integral experimental validation
The representativity and transposition method relies on an experimental data assimilation process. The transposition gives consistent results, when the similarity between the experiment and the “reactor” case is strong. This similarity is quantified by the representativity factor, introduced by Orlov [32]. The representativity factor is a correlation factor corresponding to the scalar product of two sensitivity profiles of a parameter of interest to nuclear data. The representativity factor between two applications (for instance an experiment and a reactor) for a given parameter (for instance the decay heat) is described by the formula (4) where the index A stands for the reactor application and e for the experiment. The vector SA (respectively Se) is the sensitivity to nuclear data in the reactor application
(respectively the experiment), and is the covariance matrix.
(4)
One can also define a weight (see formula (5)) where is the uncertainty associated with the experiment and the prior uncertainty due to nuclear data and calculated with formula (3). The weight provides an indication of the interest of the experiment regarding to a transposition application. In the ideal case where there is no experimental uncertainty ( =0); the weight is maximum and the main source of uncertainty comes from the nuclear data. As a conclusion, the transposition method is the most efficient, that is to say leads to the largest bias and uncertainty reduction due to nuclear data covariances, when and are the closest to unity.
(5)
The transposition method applied to one experiment and one reactor application allows an indirect re-estimation of nuclear data leading to a new calculation bias ( ) and a posterior uncertainty ( ) due to nuclear data covariances (see formulas (6) and (7)).
(6)
(7)
(8)
(9)
Where:
- and are the prior and posterior values of the calculated quantity of interest,
- and are the prior and posterior uncertainties due to nuclear data covariances for the reactor application,
- is the extended representativity vector of the reactor application A, -
(for several experiments (i))
-
is the extended representativity matrix between experiments, - and
- is the experimental uncertainty for the experiment i and is the experimental correlation between the experiments i and j,
-
At CEA, transposition applications have been initiated for fuel cycle application in 2015. The first one concerns the transposition of C/E discrepancies on isotopic concentrations of a 17x17 square lattice PWR MOx fuel on a 15x15 square lattice PWR MOX fuel [35]. Indeed, the current experimental validation report of the DARWIN2.3 package is focused on 17x17 lattices. The use of the representativity/transposition method on the isotopic concentrations was allowed by a strong representativity factor (r=0.99) and led to an uncertainty reduction on nuclide concentration calculations ranging from 0 to 87%.
The second work conducted at CEA is a prospecting study on the use of the transposition for decay heat [20]. The goal was to quantify to what extent a measurement at a given set of parameters (tcooling,
BU) could be used through the transposition at another set of parameters (tcooling’, BU’). The Figure 4
shows the representativity factor obtained as a function of the cooling time for an UOX fuel (235U e%=3.7%) reactor application and one of the CLAB experiment at a cooling time of 4724 days (i.e. ~13 years) and a very similar discharge burnup. The decay heat mainly originates from both short-life fission product decays and actinide decays. One can see in this illustration that the representativity
factor quickly drops under 2000 days (i.e. ~5.5 years) of cooling. Therefore it can be sensed here that it would be difficult to use the transposition to quantify biases and uncertainties due to nuclear data at a shorter cooling time than 2000 days. Bear in mind that the representativity is usually considered as satisfactory when it is close to 0.9.
Figure 4: Representativity factor between a CLAB experiment (t=4724 days, BU=47.3 GWd/t) and an UOX fuel (BU=46.5 GWd/t).
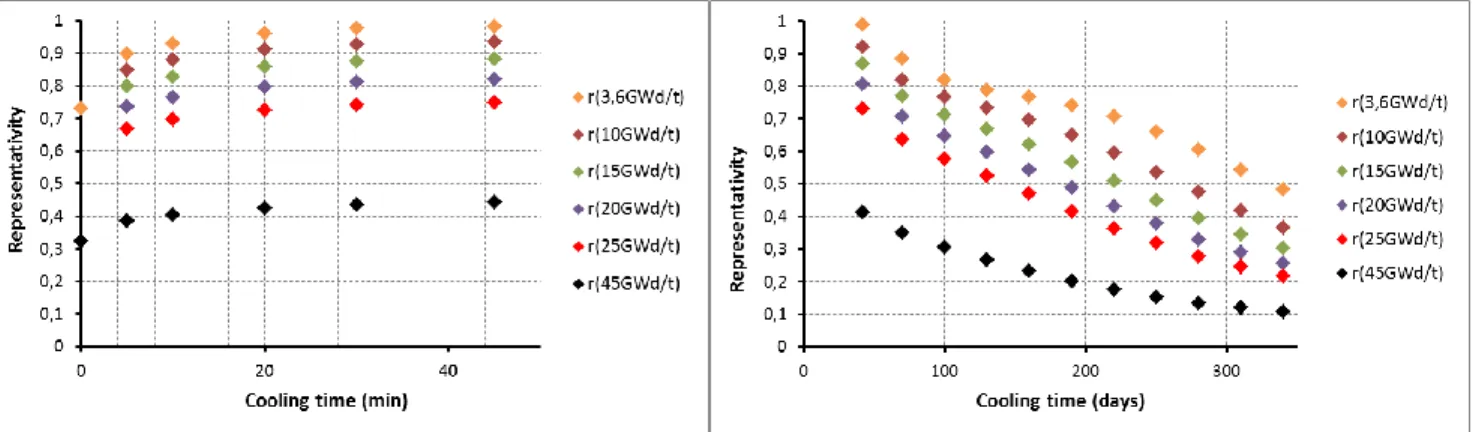
Another work is on progress concerning the exploitation of the MERCI-1 experiment analysis, which is the integral experiment that provides the integral experimental data at the lowest cooling times (45 min). The decay heat exclusively originates from short-life fission product decays. The representativity factor on the decay heat between MERCI-1 and a PWR standard UOX fuel (235U e%=3.7%), is presented in Figure 5. The MERCI-1 fuel sample was irradiated during three cycles in the OSIRIS experimental reactor, with a mean specific power around 65 W/g, with two inter-cycle and shutdown periods; a fine irradiation history was taken into account for decay heat calculations [30]. For the PWR standard PWR fuel, a simplified mean irradiation history was modelled, with a classical specific power (around 40W/g.) With this assumption, it is observed that the representativity is very good, even for low cooling time (5 min), as long as the burnup is close to the MERCI-1 fuel burnup (3.6GWd/t); for higher burn-up (>15GWd/t),the experiment is not representative enough to use the transposition method.
Figure 5: Representativity factor between a MERCI experiment (t=45 min or 42 days, BU=3.6 GWd/t) and a standard PWR UOX fuel for decay heat.
Indeed, the low MERCI-1 representativity for a standard UOX spent fuel (BU>15GWd/t) is due to the contribution of 239Pu fissions to decay heat, and thus to its associated uncertainty, from a burn-up of 15 GWd/t (see Figure 6), and increasing with the burn-up.
Figure 6: Contribution of fission products coming from 235U thermal fissions and 239Pu thermal fissions on the decay heat uncertainty versus fuel burn-up, for a UOX spent fuel.
The bias transposition will be able to be analyzed in a second step for the cases presenting a good representativity.
V. PERSPECTIVES FOR THE ESTIMATION OF AN ENHANCED EXTENDED UNCERTAINTY ASSOCIATED WITH THE DARWIN2.3 DECAY HEAT CALCULATIONS
The recent studies of nuclear data covariance propagation performed at CEA over the last years on the decay heat of UOX and MOX fuels shows that the total uncertainty is reduced, sometimes by a factor 2, in comparison with the uncertainty estimation at the end of the 90’s [36]. This is mainly due to the use of a more stringent method of uncertainty propagation and to improvements on the content of nuclear data libraries. However, this reduction emphasizes the fact that one should be careful when analyzing the results and supports the interest of keeping a critical look on nuclear data covariances.
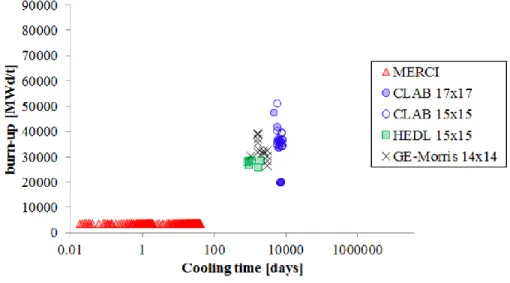
Thus, the DARWIN2.3 experimental validation must be completed, considering the lacks of representativity of the integral experiments. Its exploitation with the representativity and transposition method must also go on, in order to provide elements to validate the order of magnitude of the nuclear data uncertainty for the DARWIN2.3 calculated decay heat on the application domain. First, the DARWIN2.3 validation could be extended with the analysis of two sets of integral decay heat measurements which have been found in the literature: GE-Morris and HEDL measurements. They are used for the validation of other international codes dedicated to decay heat computation such as SCALE/ORIGEN [37] or VESTA2.1 [38]. GE-Morris and HEDL measurements enable to cover lower cooling time ranges than the CLAB experiments, the characteristics are the following (Figure 6):
- General Electric (GE) (UOX assemblies, 3.4%<e%235U<4.0%, 26<BU<39GWd/t, cooling times between 3 and 8 years): San Onofre 1 and Point Beach 2 reactor units [39];
- Hanford Engineering Development Laboratory (HEDL) (UOX assemblies, e%235U = 2.55%, 25<BU<30GWd/t, cooling times between 2 and 6 years): Turkey Point 3 reactor unit [40];
Figure 6: Mapping of the MERCI-1, CLAB, HEDL and GE-Morris PWR-UOX decay heat integral measurements as a function of the cooling time and the discharge burnup
Concerning EFBs, the experimental validation could be extended as well to give elements for short cooling times with the following experiments:
- 235Uth: LOTT experimental values (1973) [41] for cooling times between 17s and more than 100 days
and NGUYEN values (1997) [42] for cooling times between less than 1s and about 5 hours;
- 238Ufast: AKIYAMA values (1982) for cooling times between 30s and about 11 hours and NGUYEN
values (1997) for cooling times between less than 1s and about 14 hours;
- 239Puth: FICHE values (1976) [43] for cooling times between 50s and about 28 hours, JOHANSSON
values (1987) [44] for cooling times between about 300s and about 7 hours, and NGUYEN [45] values (1997) for cooling times between about 1s and about 9 hours;
- 241Puth: DICKENS [28] values (1980) for cooling times between 2.7s and about 3.3 hours.
The experimental validation based on EFBs will have to be added to the experimental data assimilation process that only relies on MERCI-1 and CLAB assimilation for the moment; the objective will be to assimilate all these data at the same time, as recommended by [48] (for which only FEB data assimilation is performed), to get a final uncertainty capable to cover the largest DARWIN2.3 application domain, much wider than the current one covered by the experimental validation.
VI. CONCLUSION
The decay heat is a crucial issue for in-core safety and back-end cycle. In this framework, the accurate control of the decay heat calculation is needed for all the PWRs in the French reactor fleet (UOX and MOX fuels with 235U enrichments going from 1.0 to 5.0 wt% and average plutonium contents going from 4.0 to 11.0 wt%) over a wide range of cooling times (from the reactor shutdown moment to more than 300,000 years). An estimation of the decay heat is provided by the DARWIN2.3 package. The DARWIN2.3 package benefits from the implementation of the VVUQ process. There are very few integral experiments available for decay heat to ensure the experimental validation of the DARWIN2.3 package over the whole range of parameters needed. The Uncertainty Quantification associated with the decay heat calculated by DARWIN2.3 relies today mainly on a deterministic nuclear data covariance propagation. The input data for this propagation are covariances taken from the European evaluation JEFF-3.1.1 for the decay data and fission yields, and the COMAC-V2 database for cross-sections. However, these covariances are often uncompleted, considering the number of nuclear data involved in the decay heat calculation (more than 40,000). Besides, their quality and accuracy are sometimes a subject for debate for experts in nuclear data (in particular concerning fission yield correlation matrix). That is why it is needed to complete and to exploit the DARWIN2.3 experimental validation, to confirm the uncertainty level associated with the decay heat calculation. To do so, a data assimilation work, with the implementation of the representativity and transposition method, has to be done integrating the C/E discrepancies coming from both integral experiments and EFBs.
ACKNOWLEDGEMENT
The authors would like to thanks EDF, FRAMATOME and ORANOfor their financial support on the DARWIN2.3 calculation tool.
REFERENCES
[1] M. Nutt, “Spent fuel”, Argonne National Laboratory, April 2011
[2] L. San Felice, R. Eschbach and P. Bourdot, “Experimental validation of the DARWIN2.3 package for fuel cycle applications”, Nuclear Technology, 184, 217-232, 2013
[3] J.-M. Vidal, “CESAR5.3: An industrial tool for nuclear fuel and waste characterization with associated qualification”, Proc. Int. Conf. WM, Phoenix, Arizona, USA, 2012
[4] R. Sanchez et al., “APOLLO2 Year 2010”, Nucl. Eng. Tech., 42, 5, 474-499, 2010
[5] A. Santamarina et al. “The JEFF-3.1.1 nuclear data library”, JEFF Report 22, NEA No. 6807, OECD 2009
[6] A. Santamarina, N. Hfaiedh, “The SHEM energy mesh for accurate fuel depletion and BUC calculations”, Proc. Int. Conf. Nuclear Criticality-Safety ICNC2007, St Petersburg, 2007
[7] JF. Vidal et al, “New modelling of LWR assemblies using the APOLLO2 code package”, Proc. Joint Int. Topl. Mtg. Mathematics & Computation and Supercomputing in Nuclear Applications (M&C + SNA 2007), Monterey, California, USA, 2007
[8] A. Tsilanizara et al., “DARWIN: an evolution code system for a large range of applications”, Journal of Nuclear Science and Technology, 1, 845-849, 2000
[9] “Predictive science academic alliance – Program-II (PSAAP-II) – Verification, Validation, and Uncertainty Quantification – Whitepaper (U),” LLNL-MI-481471, Lawrence Livermore National Laboratory, Livermore, USA, 2011
[10] W. Oberkampf, “Verification, validation, and predictive capability in computational engineering and physics”, Applied Mechanics Review, 57, 5, 345-384, 2004
[11] M. Avramova, K. Ivanov, “Verification, validation and uncertainty quatification in multi-physics modelling for nuclear reactor design and safety analysis,” Progress in Nuclear Energy, 52, 602-614, 2010
[12] C. De Saint Jean et al., “Verification, validation and uncertainty quantification for neutronic calculation for ASTRID fast reactor detailed design”, Proc. Int. Conf. PHYSOR2016, Sun Valley, Idaho, USA, 2016
[13] E. Brun, E. Dumonteil, F. Malvagi, “Systematic uncertainty due to statistics in Monte Carlo burnup codes : applications to a simple benchmark with TRIPOLI-4-D”, Progress in Nuclear Science and Technology, 2, 879-885, 2011
[14] S. Lahaye et al, “First verification and validation steps of MENDEL release V1.0 cycle code system”, Proc. Int. Conf. PHYSOR2014, Kyoto, Japan, 2014
[15] A. Rizzo, C. Vaglio-Gaudard, J. Fiona-Martin, G. Noguère, R. Eschbach, ‘Work plan for improving the DARWIN2.3 depleted material balance calculation concerning some important isotopes for fuel cycle”, Proc. Int. Conf. Nuclear Data for Science and Technology (ND 2016), Bruges, Belgium, 2016 [16] V. Vallet, “Validation of the uncertainty propagation method for the decay heat within the DARWIN2.3 package”, Proc. ANS Best Estimate Plus Uncertainty Int. Conf. (BEPU 2018), Lucca, Italy, 2018
[17] S. Lahaye, “Comparison of deterministic and stochastic approaches for isotopic concentration and decay heat uncertainty quantification on elementary fission pulse”, EPJ Web of Conferences 11, 2016 [18] P. Archier et al., “COMAC: Nuclear Data Covariance Matrices Library for Reactor Applications”, Proc. Int. Conf. PHYSOR 2014, Kyoto, Japan, 2014
[19] F. Gaudier, “URANIE: the CEA/DEN uncertainty and sensitivity platform”, Procedia-Social and Behavioral Sciences, 2(16), 7660-7661, 2010
[20] V. Vallet, C. Vaglio-Gaudard, C. Carmouze “Application of the bias transposition method on PWR decay heat calculations with the DARWIN2.3 package”, Proc. Int. Conf. GLOBAL2017, Seoul, South Korea, 2017
[21] R. W. Mills, “Improved Fission product yield evaluation methodologies”, WPEC Subgroup Proposal, OECD/NEA, May 2012
[22] D. Rochman et al., “A Bayesian Monte Carlo method for fission yield covariance information”, Annals of Nuclear Energy, 95, 125-134, 2016
[23] N. Terranova, “Covariance Evaluation for Nuclear Data of Interest to the Reactivity Loss Estimation of the Jules Horowitz Material Testing Reactor”, PhD report, Bologna University, Italy, 2016
[24] T.D. Huynh, “JEFF3 et les calculs de puissance résiduelle”, CEA-R-6224 Report, IAEA, 2009 (in French)
[25] International standard, “Énergie nucléaire – Réacteurs à eau légère – Calcul de la puissance résiduelle des combustibles nucléaires”, ISO 10645:1992 (in French)
[26] M. Akiyama et al., Journal of the Atomic Energy Society of Japan 24, 709, 1982
[27] M. Akiyama et al., “Measurement of Fission-product Decay Heat for Fast Reactors”, Proc. Int. Conf. Nuclear Data for Science and Technology, Antwerp, Belgium, 237, 1982
[28] J.K. Dickens et al., “Fission-Product Energy Release for Times Following Thermal-neutron Fission 239,241Pu between 2 and 14000s”, Nuclear Science and Engineering 78, 126, 1981
[29] J.K. Dickens et al., “Fission-Product Energy Release for Times Following Thermal-neutron Fission 235U between 2 and 14000s”, Nuclear Science and Engineering 74, 106, 1980
[30] J.C. Jaboulay, S. Bourganel, “Analysis of MERCI decay heat measurement for PWR UO2 fuel rod”, Nuclear Technology, 177, 73-82, 2012
[31] F. Sturek, L. Agrenius, “Measurements of decay heat in spent nuclear fuel at the Swedish interim storage facility CLAB”, Svensk Kärnbränslehantering AB, SKB Report R-05-62, December 2006
[32] V. V. Orlov et al., “Problems of Fast Reactor Physics related to breeding”, Atomic Energy Review, 18 4, 1980
[33] N. Dos Santos, “Optimisation de l’approche de représentativité et de transposition pour la conception neutronique de programmes expérimentaux dans les maquettes critiques”, PhD report, Grenoble University, France, 2013 (in French)
[34] N. Dos Santos, P. Blaise, A. Santamarina, “A global approach of the representativity concept, Application on a high-conversion light water reactor MOX lattice case”, Proc. Int. Conf. Mathematics and Computational Methods Applied to Nuclear Science & Engineering, Sun Valley, Idaho, USA, 2013
[35] C. Carmouze, “The similarity/transposition theory to assess accurately MOX 15x15 used fuel inventory with DARWIN2.3”, Proc. Int. Conf. GLOBAL2017, Seoul, South Korea, 2017
[36] J. Rebah, “Incertitude sur la puissance résiduelle due aux incertitudes sur les données de produits de fission”, PhD report, University Paris IX Orsay, France, 1996
[37] I. Gauld et al., “Validation of SCALE 5 Decay Heat Predictions for LWR Spent Nuclear Fuel”, Oak Ridge National Laboratory, NUREG/CR-6972, ORNL/TM-2008/015, 2010
[38] W. Haeck et al., “Experimental Validation of Decay Heat Calculations with VESTA 2.1”, Proc. Int. Conf. PHYSOR 2014, Kyoto, Japan, 2014
[39] B. F. Judson et al., “In-Plant Test Measurements for Spent Fuel Storage at Morris Operation – Volume 3: Fuel Bundle Heat Generation Rates”, General Electric, NEDF-24922-3, February 1982 [40] F. Schmittroth, “ORIGEN2 Calculations of PWR Spent Fuel Decay Heat Compared with Calorimeter Data”, Hanford Engineering Development Laboratory, HEDL-TME-83-32 (UC-85), January 1984
[41] M. Lott et al., “Puissance Residuelle Totale emise par les Produits de Fission thermique de l’235U”,
Journal of Nuclear Energy, 27, 597-605, 1973 (in French)
[42] H. V. Nguyen, “Gamma-ray spectra and decay heat following 235U thermal neutron fission”, PhD
[43] C. Fiche, F. Defreche, and A. M. Monnier, "Mesures Calorimetriques de la Puissance Residuelle Totale Emise par les Produits de Fission Thermique de 233 U et 239 Pu", Centre d'Etudes Nucleaires de Cadarache, SEN/022, 1976 (in French)
[44] P.-I. Johansson, “Integral Determination of the Beta and Gamma Heat in Thermal-neutron-induced Fission of 235U and 239Pu, and of the Gamma Heat in Fast Fission of 238U”, Proc. Int. Conf. Nuclear Data for Science and Technology, Mito, Japan, 1987
[45] H.V. Nguyen et al., “Decay heat measurements following neutron fission of 235U and 239Pu”, Proc. Int. Conf. Nuclear Data for Science and Technology, Trieste, Italy, 1997
[46] Y. Kawamoto, G. Chiba, “Feasibility of decay heat uncertainty reduction using nuclear data adjustment method with experimental data”, Journal of Nuclear Science and Technology, 54, 2, 213-222, 2017