HAL Id: hal-02110446
https://hal.archives-ouvertes.fr/hal-02110446
Submitted on 18 May 2020
HAL is a multi-disciplinary open access
archive for the deposit and dissemination of
sci-entific research documents, whether they are
pub-lished or not. The documents may come from
teaching and research institutions in France or
abroad, or from public or private research centers.
L’archive ouverte pluridisciplinaire HAL, est
destinée au dépôt et à la diffusion de documents
scientifiques de niveau recherche, publiés ou non,
émanant des établissements d’enseignement et de
recherche français ou étrangers, des laboratoires
publics ou privés.
Molecular hydrophobicity at a macroscopically
hydrophilic surface
Jenée D. Cyran, Michael A. Donovan, Doris Vollmer, Flavio Siro Brigiano,
Simone Pezzotti, Daria R. Galimberti, Marie-Pierre Gaigeot, Mischa Bonn,
Ellen H. G. Backus
To cite this version:
Jenée D. Cyran, Michael A. Donovan, Doris Vollmer, Flavio Siro Brigiano, Simone Pezzotti, et al..
Molecular hydrophobicity at a macroscopically hydrophilic surface.
Proceedings of the National
Academy of Sciences of the United States of America , National Academy of Sciences, 2018, 116
(5), pp.1520-1525. �10.1073/PNAS.1819000116�. �hal-02110446�
Molecular hydrophobicity at a macroscopically
hydrophilic surface
Jenée D. Cyrana,1, Michael A. Donovana,1, Doris Vollmera, Flavio Siro Brigianob, Simone Pezzottib, Daria R. Galimbertib, Marie-Pierre Gaigeotb, Mischa Bonna,2, and Ellen H. G. Backusa,c,2
aMax Planck Institute for Polymer Research, 55128 Mainz, Germany;bLaboratoire Analyse et Modélisation pour la Biologie et l’Environnement (LAMBE),
Univ Evry, Université Paris-Saclay, CNRS UMR8587, 91025 Evry, France; andcDepartment of Physical Chemistry, University of Vienna, 1090 Vienna, Austria
Edited by B. Montgomery Pettitt, University of Texas Medical Branch, Galveston, TX, and accepted by Editorial Board Member Peter J. Rossky December 16, 2018 (received for review November 6, 2018)
Interfaces between water and silicates are ubiquitous and relevant for, among others, geochemistry, atmospheric chemistry, and chro-matography. The molecular-level details of water organization at silica surfaces are important for a fundamental understanding of this interface. While silica is hydrophilic, weakly hydrogen-bonded OH groups have been identified at the surface of silica, characterized by a high O-H stretch vibrational frequency. Here, through a combination of experimental and theoretical surface-selective vibrational spec-troscopy, we demonstrate that these OH groups originate from very weakly hydrogen-bonded water molecules at the nominally hydro-philic silica interface. The properties of these OH groups are very similar to those typically observed at hydrophobic surfaces. Molecular dynamics simulations illustrate that these weakly hydrogen-bonded water OH groups are pointing with their hydrogen atom toward local hydrophobic sites consisting of oxygen bridges of the silica. An increased density of these molecular hydrophobic sites, evident from an increase in weakly hydrogen-bonded water OH groups, correlates with an increased macroscopic contact angle.
hydrophobicity
|
sum frequency generation spectroscopy|
surface science|
water|
silicaM
olecular-level insights into the structure and dynamics of minerals in contact with aqueous solutions contribute not only to a fundamental understanding of dissolution and sorption processes on mineral surfaces, but also to potential new avenues for their synthetic design (1, 2). Hydrophobic and hydrophilic interactions between mineral oxide surfaces and aqueous solu-tions are in particular relevant for water-mediated catalysis (3, 4) of organic reactions and phase separation processes used in ap-plications ranging from liquid chromatography to mineral froth partitioning of hydrophobic and hydrophilic particles (5, 6). The surfaces of minerals, in particular, silica, have been previously characterized at the molecular level with NMR spectroscopy and mass spectrometry to determine the surface density of hydroxyl groups (7, 8). Spectroscopic evidence from NMR and IR spec-troscopies have shown that, near neutral pH, the surface consists of siloxane (Si-O-Si), silanol (Si-OH), and negatively charged silanolate (Si-O−) groups (7, 9–11). The presence of surface OH groups is not limited to silica: on CaF2interfaces in contact withNaOH solution at pH 12, Ca-OH groups have been identified (12, 13). Similarly at alumina oxide/water interfaces Al-OH groups have been shown to terminate the Al2O3surface (14–16).
For silica, much work on silanol groups has focused on either dry silica surfaces in ultrahigh vacuum environments or under exposure to water vapor (17–21). Isolated silanol groups in air typically display a vibrational resonance around 3,750 cm−1with ∼100 ps vibrational lifetimes (18, 19). However, typically silica surfaces are in contact with aqueous solutions. This raises the question of how the water affects the silica surface.
Surface-sensitive nonlinear optical techniques, like second har-monic generation (SHG) and sum frequency generation (SFG) spectroscopy have been used to elucidate the structure of in-terfacial water at the silica/water interface (10, 20–26). SHG and
SFG are second-order nonlinear optical processes, where two incident beams generate an emitted field at the sum of the two input frequencies. In particular, vibrational SFG (vSFG) utilizes a mid-infrared pulse resonant with a molecular vibration and reveals the vibrational response of the interfacial molecules. The primary focus of vSFG studies on the silica/water interface is on the hydrogen-bonded O-H stretch modes, centered at 3,200 and 3,400 cm−1. However, several studies have, in addition, revealed a peak centered at 3,680 cm−1, which corresponds to O-H vi-brations that are weakly hydrogen bonded, the free O-H (10, 21, 22, 27). At the silica/water interface, the free O-H can originate from the silica surface as a silanol group or an O-H group at the surface of water terminating the hydrogen bond network. The origin of the peak is difficult to ascertain with conventional (homodyne detected) vSFG spectroscopy since information on molecular orientation is contained in the sign of the response, which is lost because the intensity signal is proportional to the square of the response. Owing to the recent developments in phase-resolved vSFG spectroscopy, it is possible to probe buried solid/liquid interfaces and to determine the sign of the response and thereby the absolute orientation of the interfacial O-H groups (12, 23–25). Moreover, the vibrational and reorientational
Significance
Silica, the most abundant mineral on Earth, is exploited in many technologies and naturally occurring geological and atmospheric processes. The physical and chemical interactions between silica and water are the fundamental driving forces for water purifi-cation systems, oil extraction, and coatings. Characterizing the silica/water interface is therefore important to improve existing technologies, in particular for silica coatings, which rely on wettability and thermal-resistant properties to remain effective. We investigated the silica/water interface using a mixture of macroscopic and microscopic techniques, including experimental and theoretical surface-specific sum frequency generation spec-troscopy and contact angle measurements. Strikingly, we ob-served the presence of water molecules non–hydrogen bonded to the nominally hydrophilic silica surface.
Author contributions: J.D.C., M.A.D., F.S.B., S.P., D.R.G., M.-P.G., M.B., and E.H.G.B. de-signed research; J.D.C., M.A.D., D.V., F.S.B., S.P., D.R.G., M.-P.G., and E.H.G.B. performed research; J.D.C., M.A.D., D.V., F.S.B., S.P., D.R.G., M.-P.G., M.B., and E.H.G.B. analyzed data; and J.D.C., M.A.D., D.V., F.S.B., S.P., D.R.G., M.-P.G., M.B., and E.H.G.B. wrote the paper. The authors declare no conflict of interest.
This article is a PNAS Direct Submission. B.M.P. is a guest editor invited by the Editorial Board.
This open access article is distributed underCreative Commons
Attribution-NonCommercial-NoDerivatives License 4.0 (CC BY-NC-ND).
1J.D.C. and M.A.D. contributed equally to this work.
2To whom correspondence may be addressed. Email: [email protected] or
This article contains supporting information online atwww.pnas.org/lookup/suppl/doi:10.
1073/pnas.1819000116/-/DCSupplemental. Published online January 17, 2019.
dynamics of interfacial molecules with this high vibrational fre-quency have been reported (28, 29). Here, we show that a combination of the phase-resolved vSFG and molecular dynamics (MD) simulations provides evidence for very weakly hydrogen-bonded water at the silica/water interface, which cor-relates with the macroscopic wetting properties of the surface. Furthermore, time-resolved vSFG reveals that these weakly hydrogen-bonded water molecules have similar properties as water at the water–air interface. This behavior of water is nor-mally seen for water at hydrophobic interfaces, but not for hy-drophilic interfaces. Thus, we define these water molecules as hydrophobic water, following the terminology in ref. 30. Results
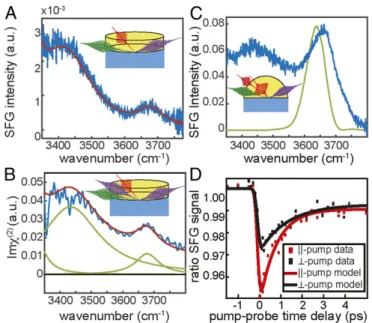
The static vSFG spectrum of water at the buried interface of an Infrasil 302 (fused) silica window inssp polarization combination (s-polarized SFG, s-polarized visible, and p-polarized infrared) is depicted in Fig. 1A (blue line). The experiments are conducted with pure Millipore water (pH∼ 6). Three Lorentzian-shaped resonances in the spectral region from 3,300 to 3,800 cm−1 ad-equately describe the data (red line). The two peaks at low fre-quencies (∼3,200 and 3,400 cm−1) represent hydrogen-bonded O-H
stretch vibrational modes, and the peak at∼3,660 cm−1indicates the presence of weakly hydrogen-bonded OH groups. Although the bandwidth in Fig. 1A does not extend to 3,200 cm−1, the resonance has been well documented previously (24, 31). A detailed description of the experimental setups can be found in theSI Appendix.
The high-frequency peak was not as pronounced in all previous studies with a planar window due to different sample preparation. The peak at ∼3,660 cm−1 is more prominent following heat
treatment (950 °C for 4 h) of the silica (10). This peak was observed by Dalstein et al. (10), and assigned to silanol groups. However, previous studies have contended that the density of silanol groups decreases upon heating the silica substrate, with a sharp decrease above 800 °C (8, 32). Furthermore, the full rehy-droxylation of the silica substrate in contact with water has pre-viously been found to proceed exceedingly slow (8, 9).
The origin of the∼3,660 cm−1peak is ambiguous; both water and silica could have free OH groups, and both are viable options to contribute to the resonance at∼3,660 cm−1. One key difference between the free OH from water and the silanol (Si-OH) group is the molecular orientation: the free OH from water would orient with the hydrogen pointing toward the silica surface, whereas the silanol groups would be pointing toward the bulk water. It should be noted that there are different types of surface silanol groups; however, the net orientation of the OH is similar (8, 9, 33–35). One technique to address the orientation of the free OH reso-nance is phase-resolved vSFG spectroscopy, which measures the complex vSFG spectrum. Depending on the net orientation of the vibrational transition dipole, the response is positive or negative. Thus, phase-resolved vSFG spectroscopy can differentiate be-tween a free OH from water pointing toward the silica surface and a silanol group with the OH directed away from the silica.
The imaginary spectrum from the phase-resolved vSFG ex-periments of the silica/water interface reveals two positive peaks, as illustrated in Fig. 1B. The peak centered around 3,400 cm−1 corresponds to hydrogen-bonded water at the silica/water interface. The positive sign of this peak indicates that these hydrogen-bonded water molecules are oriented with their hydrogen atoms toward the negatively charged surface, in agreement with previous results (23, 24). The peak at ∼3,660 cm−1 is also positive (Fig. 1B) and indicates the net orientation of the hydrogen atom of the OH groups contributing to this vibrational resonance are likewise oriented toward the silica surface. Therefore, the data indicate that the free OH signal originates from water molecules with the hydrogen atom of their OH groups oriented toward the silica surface, rather than from silanol groups. Further spectroscopic evidence utilizing H218O is included in theSI Appendix. Isotopic substitution of 16O to18O shifts the high-frequency O-H stretch vibration to
lower frequencies; this is not expected for silanol groups, which are not expected to exchange oxygens with nearby water. The free OH groups from water oriented toward the silica substrate dom-inate the spectrum, yet silanol groups, pointing toward the water may still be present at the surface.
To further characterize these hydrophobic OH groups at the silica/water interface, we employ time-resolved vSFG spectros-copy and compare their behavior with water in contact with other hydrophobic interfaces. We measure both the population lifetime and reorientation dynamics of the weakly hydrogen bonded–OH species at the silica/H2O interface. Time- and polarization-resolved
measurements have previously been reported for the air/water, octadecylsilane (ODS)/water, and aqueous peptide solution/air interfaces, and we use these results as a comparison for the silica/ water interface (28, 29, 36, 37).
In the time-resolved vSFG experiments, a subset of OH groups was excited with a 150-fs mid-IR excitation pulse spectrally centered at 3,640 cm−1(green line in Fig. 1C), and the time-dependent vSFG intensity spectrum was detected withppp polarization configuration at various times after the pump pulse excitation (Fig. 1D). The pump polarization was alternated betweenp- and s-polarization, which are parallel and perpendicular to the probe pulse, respec-tively, to probe the reorientation dynamics. The excitation pulse breaks the azimuthal symmetry at the interface, and the decay of the induced anisotropy can be followed in real time. In the absence of molecular reorientation, the bleach lifetime should not display any polarization dependence (28, 38).
Fig. 1C shows the static spectrum obtained from negative time delays from the time-resolved vSFG experiments, which clearly Fig. 1. Intensity and phase- and time-resolved surface-specific spectroscopy
of the silica–water interface; vSFG (A) intensity spectrum and (B) phase-resolved (imaginary) spectrum of the silica/water interface collected in ssp polarization combination (blue traces). The red lines are a description of both datasets with one set of Lorentzian line shapes with a small non-resonant signal shown as green lines. The vSFG (C) static intensity spectrum (blue) and (D) time-resolved vSFG data of the silica/water (10 mM NaCl) in-terface. The excitation pulse spectrum used in the time-resolved experiments is illustrated in green (C). The data were collected in ppp polarization combination. The time-resolved traces were collected for parallel-pump (red) and perpendicular-pump (black) polarizations. The solid lines through the time-resolved data originate from the model described in the text. The sample geometries are illustrated in the Insets for the (A) intensity, (B) phase-resolved, and (C) time-resolved setups.
Cyran et al. PNAS | January 29, 2019 | vol. 116 | no. 5 | 1521
CHE
differs from the spectrum in Fig. 1A. For the time-resolved measurements, the polarization combination, salt concentration, and optical geometry were chosen to enhance the free OH signal. To this end, an IR-grade fused hemispherical silica substrate (Infrasil 302) is heated similarly to the previously described silica windows before being put in contact with a 10-mM salt solution. The 10-mM NaCl solution has been previously shown to reduce the intensity of hydrogen-bonded water peaks, thereby increasing the relative intensity of the free OH. The angles of incidence in the vSFG setup were set to take advantage of total internal re-flection (TIR) conditions to further boost the signal (39). The employed ppp (rather than ssp) polarization combination yields higher signal-to-noise for the TIR geometry (39). Combined, these measures result in the high-frequency peak being more enhanced using the hemisphere (Fig. 1C) than the window (Fig. 1A).
The time-resolved results are shown in Fig. 1D, where the ratio of the SFG signals in presence and absence of the pump pulse is plotted as a function of pump-probe delay. The decrease in the ratio around 0 fs is the bleach of the ground state pop-ulation. The offset at long delay times is due to slight heating (about a few degrees) (40) of the sample after vibrational re-laxation. The time-resolved data were fit with a single expo-nential described by a three-level model, where a population of molecules in the ground state is excited to a vibrationally excited state and relaxes further to a heated ground state (41). The ex-citation pulse was modeled by a Gaussian with an FWHM of 150 fs. A single time constant, e.g., the bleach lifetime (τ1), is
extracted from the fits. The bleach lifetimes were 0.8± 0.08 ps and 1.3± 0.2 ps for parallel-polarized (τjj) and perpendicular-polarized (τ⊥) excitation pulses, respectively.
Indeed, the bleach lifetimes of the“free” O-H at the silica/water interface are very comparable to that of∼1 ps reported for the free O-H of water at the water/air interface and 1.3± 0.1 ps for the extended hydrophobic interfaces (28, 36, 42). In contrast, the observed dynamics are an order of magnitude faster than the ∼56 ps bleach lifetime measured for rigid surface silanol groups in contact with water (43). It should be noted, that Heilweil et al. (43) measured silica powder with physisorbed water in CCl4, but
not fully in contact with water and relied on infrared transmission pump-probe measurements, rather than time-resolved SFG, each with distinct selection rules. Therefore, the time-resolved data indicates that the high-frequency peak from water pointing to the silica surface behaves similarly to water at hydrophobic interfaces. Beyond the vibrational bleach relaxation lifetime, the dynamics contain information on the reorientation of the free OH groups at the silica/water interface. Specifically, the time-dependent differ-ence in the parallel and perpendicularly pumped traces reflects a reorientation of excited OH groups. (28, 36) We semiquantitatively compare the results obtained hereτjj= 0.80 ± 0.08 ps and τ⊥=
1.3± 0.2 ps, with results from experiments on free OH groups at the water/air interface (τjj= 0.64 ± 0.04; τ⊥= 0.80 ± 0.07 ps) and
the extended hydrophobic ODS/water surface (τjj= 1.34 ± 0.03;
τ⊥= 1.55 ± 0.04 ps) (28, 36). The difference between the lifetimes
observed for different polarizations shows that reorientation contributes significantly to the bleach dynamics, consistent with the OH groups originating from water. It is further evident that the reorientation dynamics of the OH groups studied here at the water–silica interface are very comparable to the reorientational dynamics of free OH groups of water at the hydrophobic water/ air and water/ODS interfaces.
Summarizing the dynamic studies, it is evident that both the vibrational and reorientational dynamics of the free OH feature occurs on a∼1 ps timescale. This timescale is typical for interfacial water and therefore consistent with the OH group being part of a water molecule, rather than being a surface-bound silanol group. Although the SFG results show there is microscopically water present that behaves like water at a hydrophobic surface, it is well known that macroscopically the silica surface is hydrophilic,
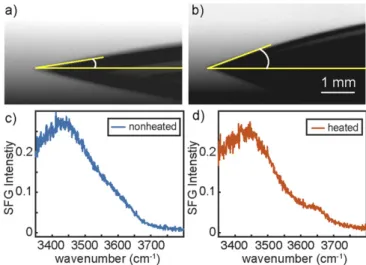
as can be seen from the contact angle measurements for a nonheated and heated silica sample, illustrated in Fig. 2A and B. The contact angles were measured to be 8.9°± 1.0° and 20.0° ± 1.5° for the non-heat-treated and heat-treated silica window, re-spectively. These contact angles are in agreement with previous studies (44). The larger contact angle for the heated sample indicates a macroscopically less hydrophilic surface. Remarkably, the SFG spectra reveal that this surface, as opposed to the non-heated surface, exhibits an enhanced 3,660 cm−1intensity in the SFG spectra (Fig. 2C and D). This points to a clear correlation between the 3,660 cm−1intensity, reflecting microscopic hydro-phobicity, and the macroscopic contact angle. Apparently, water with very weakly hydrogen-bonded OH groups, i.e., hydrophobic water, is present at a hydrophilic surface.
The molecular origin of this very weakly hydrogen-bonded water is not a priori evident: it could originate from a saturation of the hydrogen bond acceptors from the silica, rendering un-paired free OH groups from water. Another explanation could be steric hindrance at the surface, resulting from, e.g., a spatial mismatch between the typical distance between hydrogen bond donors of the interfacial water network, and that of the hydrogen-bonded acceptors at the silica surface.
To unravel the origin of this very weakly hydrogen-bonded water, we performed density functional theory (DFT) MD sim-ulations. Silica surfaces are composed of Si-OH silanols, which have various pKaactivity (11, 45, 46) and Si-O-Si siloxane bridges,
known as hydrophilic and hydrophobic sites, respectively (11, 47). The surface density of silanols reveals the hydrophilic/hydrophobic character of the surface, with 4–5 SiOH/nm2, which is
represen-tative of hydrophilic surfaces and 1–2 SiOH/nm2, which is
repre-sentative of hydrophobic ones (11). SFG phonons (48) do show the existence of hydrophobic surface siloxanes at hydrophilic silica surfaces. Two silica models are used in the DFT-MD simulations, differing by the degree of surface hydroxylation (11), i.e., 4.5 (hydrophilic) and 3.5 (less hydrophilic) SiOH/nm2. The 3.5 SiOH/nm2 surface is chosen as a qualitative model for the effect of the heating treatment in the experiment (11). The simulations are performed at the point of zero charge, which also corresponds to the isoelectric point. Further discussion regarding the effect of surface charge on both the experimental and theoretical spectra can be found in theSI Appendix.
Fig. 2. Correlation between molecular and macroscopic hydrophobicity. Contact angle of water in contact with a nonheated (A) and heat-treated (B) silica window. The representative tangent line fits (yellow) were used to extract the contact angle. (C and D) The corresponding vSFG intensity spectra reveal a correlation between the contact angle and the 3,660 cm−1 quasi-free OH intensity.
The vSFG spectrum (Imχ(2)) of interfacial water has been
extracted from the DFT-MD simulations, following our recent works (49–51) (black lines in Fig. 3, details in theSI Appendix) for the 3,500–3,800 cm−1 spectral region for each silica–water
interface. The vSFG spectral intensity in this range can be traced to the 3-Å-thickness water monolayer at the direct interface with the silica surface (binding interfacial layer [BIL], seeSI Appendix
and refs. 49 and 50) and more specifically to contributions from two distinct water OH groups (dashed red and green lines in Fig. 3; details in theSI Appendix). Within the BIL, water molecules with one OH group pointing toward a siloxane bridging oxygen atom solely produce the positive band at 3,660 cm−1(green line in Fig. 3). The high frequency of these features indicates the quasi-free nature of the OH groups. The water molecules with one OH group pointing toward an in-plane surface silanol site give rise to the broad positive vSFG band, centered at 3,470 cm−1, illustrated as red lines in Fig. 3 and showing only the tail of the band in the 3,500–3,800 cm−1range of interest here. On average,
the latter water population has no dangling O-H, while the O-H pointing toward the siloxane bridge in the former water pop-ulation is the only dangling O-H. The surface silanol sites do not contribute to the vSFG spectral features in the 3,500–3,800 cm−1
range (seeSI Appendix where we show that only the in-plane silanols have vibrational signatures in the 3,500–3,800 cm−1
range, however not vSFG active because of their in-plane ori-entation). Note that although the DFT-MD-vSFG is obtained at the isoelectric point (pH∼ 2) the experiment is measured at pH∼ 7, where the surface is slightly negatively charged, hence providing an overlapping diffuse layer vSFG positive contribution at 3,200–3,400 cm−1(51, 52). This does not affect the 3,660 cm−1
band of interest in this work.
The number of water molecules that belong to these two populations depends on the degree of hydroxylation of the sur-face. We find that the water population with one OH group pointing toward a siloxane bridge increases from 0.8 to 3.0 water molecules/nm2when going from 4.5 to 3.5 SiOH/nm2surface silica
hydroxylation. With increased silanol density, fewer water mole-cules interact with siloxane bridges due to steric hindrance by adjacent silanol groups. Removing one SiOH/nm2from the silica surface leads to the reconstruction of the surface, creating one siloxane bridge and one desorbed water starting from two surface silanols. Without these silanols, the siloxanes are now free to in-teract with water and hence give rise to the observed roughly 4 times increase in water interacting with siloxanes.
There is spectroscopic evidence from experiments and simu-lations of water dangling/quasi-free OH groups at the direct interface with nominal hydrophilic silica surfaces. This counterintuitive result stems from the coexistence of hydrophilic and hydrophobic patches on the silica surface. This is derived from the DFT-MD simulations and illustrated in Fig. 4 by correlating the spatial distribution of surface silanol/siloxane (exposed) sites with the spatial distribution of BIL-water molecules that have one dangling O-H group with the 3,660 cm−1vSFG signature for two surfaces with a different silanol density. The lateral (x–y directions along the solid surface) spatial distribution of silanol groups (represented by gray balls) and siloxane sites (Si-O-Si represented by red O atoms) at the two silica surfaces are presented in Fig. 4A and C, Left. The corresponding density of BIL water with one 3,660 cm−1O-H group is presented in Fig. 4B andD, Right, over the same lateral dimensions and same orientation of the silica surfaces. The maximum density is in red in these plots. A one-to-one correspondence between siloxane sites and quasi-free OH density is clearly observed.
Fig. 4A and C nicely show that there is a nonuniform distri-bution of silanols and siloxanes at the two silica surfaces, with coexisting silanol-rich (hydrophilic) and siloxane-rich (hydro-phobic) domains at the surfaces. The red line in the figures in-dicates the most hydrophobic surface areas where the silanol density is ≤1.5 SiOH/nm2. Clearly, hydrophobic patches are Fig. 3. DFT-MD simulations reveal the origin of hydrophobic sites on the
fused silica surface. (Left) Theoretical vSFG signal (Imχ(2)) in the 3,500–
3,800 cm−1region for two silica surfaces with various degrees of surface hydroxylation (3.5 and 4.5 SiOH/nm2). The black line is the total vSFG signal
and the dotted lines are the microscopic assignments (deconvolved signa-tures, see text andSI Appendix). Green dashed line: vSFG due to the water molecules that have one O-H oscillator pointing toward a siloxane bridge. Red dashed line: vSFG due to the water molecules with one O-H oscillator pointing toward an in-plane silanol group. (Right) Snapshots from DFT-MD simulations illustrating the microscopic origin of the observed spectral con-tributions (see text for details).
D
C
A
B
Fig. 4. Correlation between the spatial distributions of surface silanol/ siloxane exposed sites (Left) and water molecules with a quasi-free OH group (Right). (Left) Top view of the two silica surfaces modeled in the DFT-MD: silanol density of 3.5 SiOH/nm2(A) and 4.5 SiOH/nm2(C). The red lines
in-dicate the hydrophobic patches (i.e., areas of the surface with the lowest silanol densities). The surface SiOH groups are highlighted with gray balls for oxygens and hydrogens, while the Si-O-Si siloxanes are highlighted by the oxygens only (in red). (Right) Density of water quasi-free OH groups spatially resolved above the surface (x–y plane, same dimension and same orientation as in A and C) for the 3.5 SiOH/nm2(B) and 4.5 SiOH/nm2(D) silica–water
in-terfaces modeled in the DFT-MD. The red/green colors refer to the maximum probability to find a water quasi-free OH group, indicated by the scale bar.
Cyran et al. PNAS | January 29, 2019 | vol. 116 | no. 5 | 1523
CHE
present at a nominally hydrophilic silica surface, in agreement with ref. 47. Such hydrophobic patches have also been identified at model solid surfaces (53) and self-assembled monolayers (54). Not surprisingly, the dimension of these patches is dependent on the surface degree of hydroxylation. We find one large hydro-phobic patch made of five siloxane bridges at the 3.5 SiOH/nm2
silica surface, while the hydrophobic patch consists only of two adjacent O-Si-O sites at the 4.5 SiOH/nm2surface. Thus, the latter
surface can be seen as more hydrophilic, which is in agreement with the experimental results showing a smaller contact angle in combination with the absence of a high frequency vSFG signal. Based on the DFT-MD results, we thus conclude that surface hydrophobic patches induce areas in the water layer in direct contact with silica, which are composed of water molecules with one quasi-free O-H group interacting with the siloxane bridges of the hydrophobic patches. These molecular groups are responsible for the 3,660 cm−1vSFG feature.
The relationship between macroscopic contact angle mea-surements and microscopic vSFG spectroscopy can furthermore be rationalized as follows: the decrease in surface silanols, macroscopically probed with the increase in contact angle, re-sults in an increase of exposed O-Si-O siloxane bridges at the surface that consequently result in water quasi-free O-H groups at the direct interface with silica, solely contributing to the vSFG intensity at 3,660 cm−1.
Molecular-level insights into the structure and dynamics of minerals in contact with aqueous solutions contribute not only to a fundamental understanding of dissolution and sorption pro-cesses on mineral surfaces but also to potential new avenues for their synthetic design. This study explores the tunable hydro-phobicity of silica surface chemistry in contact with water, both on a macroscopic and molecular scale. The spectroscopic results and MD simulations unambiguously show that the free OH peak observed at the water-fused silica interface is due to water. The OH groups are oriented toward the surface of silica, specifically toward siloxane bridges, and the dynamics of the free OH groups at the silica/water interface are quantitatively comparable to the free OH at the air–water interface, both regarding its reor-ientational and vibrational dynamics (28, 29). Our study reveals water interacting with hydrophobic patches at the nominally hydrophilic silica/water interface.
Methods and Materials
Samples. Sodium chloride (NaCl) was purchased from Sigma-Aldrich (99%) and H218O (97%) was purchased from Euriso-top. The NaCl was heated to
550 °C for 3 h to remove impurities. The Infrasil 302 silica samples were in two different geometries, 10-mm diameter hemispheres (CVI Melles Griot) and 25 mm× 2 mm windows (Korth Kristalle). The hemispheres and the windows (both heated and nonheated) were sonicated in ethanol, water, and then immersed in 3:1 Piranha solution for 10 min. The“heated” samples were subsequently heated at 950°C for 4 h and after cooling down, the
samples were placed in 3:1 acidic Piranha solution for 10 min. All glassware was sonicated in Deconex, ethanol, and Millipore water for 15 min and fi-nally rinsed thoroughly with Millipore water.
Phase-Resolved SFG Spectrometer. The phase-resolved SFG spectrometer utilizes pulses centered at 800 nm and∼40 fs in duration, which are gen-erated from a Ti:Sapphire regenerative amplifier (Spitfire Ace; Spectra-Physics). A portion of the output is directed to an optical parametric ampli-fier (Light Conversion TOPAS-Prime) with a noncollinear difference frequency generation stage to produce pulses centered around 3,600 cm−1(IR). An-other portion of the regen output (∼1 mJ) is passed through an etalon to provide a 25 cm−1visible pulse (VIS) and sets the spectral resolution of the SFG experiments. The IR and VIS pulses are focused with 5- and 100-cm lenses, respectively, and overlapped in time and space on a gold mirror to generate the local oscillator (LO). The IR, VIS, and LO are directed to a 5-cm focal length curved mirror and focused at the sample, an Infrasil 302 silica window in contact with water. The angles of incidence with respect to the surface normal of the silica–air interface are ∼45° for the IR and 40° for the VIS. The LO is delayed relative to the IR and VIS pulses with a 1-mm-thick fused silica plate. The LO and the SFG signal are directed to a spectrometer (Acton SP-2300; Princeton Instruments) and measured on an electron-multiplying charge-coupled device camera (Newton 970; Andor). The phase-resolved SFG spectra were collected for 5 min in the ssp polarization combination. An intensity spectrum can also be measured with the phase-resolved SFG spectrometer by blocking the LO signal. Further details on the phase-resolved measurements, and data analysis can be found in theSI Appendix. MD Simulations. Born–Oppenheimer DFT-MD simulations have been carried out on amorphous silica/liquid water interfaces, consisting in the Becke Lee Yang Parr (BLYP) (55, 56) representation including the Grimme D2 correction for dispersion (57, 58). Two hydrophobic silica models have been chosen, displaying a surface degree of hydroxylation of 4.5 SiOH/nm2 (i.e., eight
SiOH groups in the simulation box) and 3.5 SiOH/nm2(six SiOH in our
sim-ulation box), respectively. The amorphous silica models are taken from Ugliengo et al. (59). The surfaces in contact with air have a 4.5 and 2.4 SiOH/ nm2coverage in silanols that become 4.5 and 3.5 SiOH/nm2, respectively,
once the surfaces are put in contact with water (seeSI Appendixfor more details). Theoretical vibrational sum frequency generation spectra of the silica/water interfaces (including both water and solid contributions) are calculated using the formalism presented in refs. 51, 60. We refer toSI Ap-pendix for more details about the computational setup and theoretical spectra calculations and their microscopic assignments.
ACKNOWLEDGMENTS. We thank Azadeh Sharifi for assistance with the contact angle measurements; Eric Tyrode, Jonathan Liljebald, and Shumei Sun for helpful discussions; Malte Deiseroth for the analytical solution for the fit function for the time-resolved data; and Hansjörg Menges and Marc-Jan van Zadel for excellent technical support. We thank Wybren-Marc-Jan Buma for suggesting the H218O experiments and P. Ugliengo for sharing amorphous
silica models. High-performance computing resources from Grand équipement national de calcul intensif (GENCI)-France Grant 072484 (CINES/IDRIS/TGCC) are acknowledged. J.D.C. acknowledges the Alexander von Humboldt Founda-tion for financial support. This work was funded by a European Research Council Starting Grant (Grant 336679) and the bilateral France-Germany ANR-DFG DYNAWIN Grant 14-CE35-0011-01 and BA 5008/3.
1. Putnis A (2014) Materials science. Why mineral interfaces matter. Science 343:1441–1442. 2. Brown GE, Jr (2001) Surface science. How minerals react with water. Science 294:
67–69.
3. Minakata S, Komatsu M (2009) Organic reactions on silica in water. Chem Rev 109: 711–724.
4. Kubicki JD, ed (2016) Molecular Modeling of Geochemical Reactions (John Wiley & Sons, West Sussex, United Kingdom).
5. El Hage K, Gupta PK, Bemish R, Meuwly M (2017) Molecular mechanisms underlying solute retention at heterogeneous interfaces. J Phys Chem Lett 8:4600–4607. 6. Farrokhpay S (2011) The significance of froth stability in mineral flotation–A review.
Adv Colloid Interface Sci 166:1–7.
7. Leonardelli S, Facchini L, Fretigny C, Tougne P, Legrand AP (1992) Silicon-29 NMR study of silica. J Am Chem Soc 114:6412–6418.
8. Zhuravlev LT (1987) Concentration of hydroxyl groups on the surface of amorphous silicas. Langmuir 3:316–318.
9. Zhuravlev LT (2000) The surface chemistry of amorphous silica. Zhuravlev model.
Colloids Surf Physicochem Eng Asp 173:1–38.
10. Dalstein L, Potapova E, Tyrode E (2017) The elusive silica/water interface: Isolated silanols under water as revealed by vibrational sum frequency spectroscopy. Phys Chem Chem Phys 19:10343–10349.
11. Rimola A, Costa D, Sodupe M, Lambert J-F, Ugliengo P (2013) Silica surface features and their role in the adsorption of biomolecules: Computational modeling and ex-periments. Chem Rev 113:4216–4313.
12. Khatib R, et al. (2016) Water orientation and hydrogen-bond structure at the fluorite/ water interface. Sci Rep 6:24287.
13. Becraft KA, Richmond GL (2001) In situ vibrational spectroscopic studies of the CaF2/
H2O interface. Langmuir 17:7721–7724.
14. Zhang L, Tian C, Waychunas GA, Shen YR (2008) Structures and charging ofα-alumina
(0001)/water interfaces studied by sum-frequency vibrational spectroscopy. J Am Chem Soc 130:7686–7694.
15. Tong Y, et al. (2015) Optically probing Al-O and O-H vibrations to characterize water
adsorption and surface reconstruction onα-alumina: An experimental and theoretical
study. J Chem Phys 142:054704-12.
16. Tuladhar A, Dewan S, Kubicki JD, Borguet E (2016) Spectroscopy and ultrafast
vi-brational dynamics of strongly hydrogen bonded OH species at theα-Al2O3(112 ̅0)/
H2O interface. J Phys Chem C 120:16153–16161.
17. Casassa MP, Heilweil EJ, Stephenson JC, Cavanagh RR (1986) Time‐resolved mea-surements of OH(v=1) vibrational relaxation on SiO2 surfaces: Isotope and temper-ature dependence. J Chem Phys 84:2361–2364.
18. Heilweil EJ, Casassa MP, Cavanagh RR, Stephenson JC (1985) Temperature de-pendence of the vibrational population lifetime of OH(ν = 1) in fused silica. Chem
Phys Lett 117:185–190.
19. Zhdanov SP, Kosheleva LS, Titova TI (1987) IR study of hydroxylated silica. Langmuir 3:
960–967.
20. Casillas-Ituarte NN, Allen HC (2009) Water, chloroform, acetonitrile, and atrazine adsorption to the amorphous silica surface studied by vibrational sum frequency generation spectroscopy. Chem Phys Lett 483:84–89.
21. Isaienko O, Borguet E (2013) Hydrophobicity of hydroxylated amorphous fused silica surfaces. Langmuir 29:7885–7895.
22. Yang Z, Li Q, Gray MR, Chou KC (2010) Structures of water molecules at solvent/silica interfaces. Langmuir 26:16397–16400.
23. Ostroverkhov V, Waychunas GA, Shen YR (2005) New information on water in-terfacial structure revealed by phase-sensitive surface spectroscopy. Phys Rev Lett 94: 046102.
24. Myalitsin A, Urashima S, Nihonyanagi S, Yamaguchi S, Tahara T (2016) Water struc-ture at the buried silica/aqueous interface studied by heterodyne-detected vibra-tional sum-frequency generation. J Phys Chem C 120:9357–9363.
25. Vanselous H, Petersen PB (2016) Extending the capabilities of heterodyne-detected sum-frequency generation spectroscopy: Probing any interface in any polarization combination. J Phys Chem C 120:8175–8184.
26. Jena KC, Hore DK (2009) Variation of ionic strength reveals the interfacial water structure at a charged mineral surface. J Phys Chem C 113:15364–15372. 27. Tyrode E, Liljeblad JFD (2013) Water structure next to ordered and disordered
hy-drophobic silane monolayers: A vibrational sum frequency spectroscopy study. J Phys
Chem C 117:1780–1790.
28. Hsieh C-S, et al. (2011) Ultrafast reorientation of dangling OH groups at the air-water interface using femtosecond vibrational spectroscopy. Phys Rev Lett 107:116102. 29. Hsieh C-S, et al. (2013) Mechanism of vibrational energy dissipation of free OH groups
at the air-water interface. Proc Natl Acad Sci USA 110:18780–18785.
30. Tong Y, Lapointe F, Thämer M, Wolf M, Campen RK (2017) Hydrophobic water pro-bed experimentally at the gold electrode/aqueous interface. Angew Chem Int Ed Engl 56:4211–4214.
31. Ostroverkhov V, Waychunas GA, Shen YR (2004) Vibrational spectra of water at water/α-quartz (0 0 0 1) interface. Chem Phys Lett 386:144–148.
32. Schrader AM, et al. (2018) Surface chemical heterogeneity modulates silica surface hydration. Proc Natl Acad Sci USA 115:2890–2895.
33. Ong S, Zhao X, Eisenthal KB (1992) Polarization of water molecules at a charged in-terface: Second harmonic studies of the silica/water interface. Chem Phys Lett 191: 327–335.
34. Sulpizi M, Gaigeot M-P, Sprik M (2012) The silica-water interface: How the silanols determine the surface acidity and modulate the water properties. J Chem Theory Comput 8:1037–1047.
35. Liu X, Cheng J, Lu X, Wang R (2014) Surface acidity of quartz: Understanding the crystallographic control. Phys Chem Chem Phys 16:26909–26916.
36. Xiao S, Figge F, Stirnemann G, Laage D, McGuire JA (2016) Orientational dynamics of water at an extended hydrophobic interface. J Am Chem Soc 138:5551–5560. 37. Donovan MA, et al. (2016) Ultrafast reorientational dynamics of leucine at the
air-water interface. J Am Chem Soc 138:5226–5229.
38. Nienhuys H-K, Bonn M (2009) Measuring molecular reorientation at liquid surfaces with time-resolved sum-frequency spectroscopy: A theoretical framework. J Phys
Chem B 113:7564–7573.
39. Liljeblad JFD, Tyrode E (2012) Vibrational sum frequency spectroscopy studies at solid/ liquid interfaces: Influence of the experimental geometry in the spectral shape and
enhancement. J Phys Chem C 116:22893–22903.
40. Ramasesha K, De Marco L, Mandal A, Tokmakoff A (2013) Water vibrations have
strongly mixed intra- and intermolecular character. Nat Chem 5:935–940.
41. van der Post ST, et al. (2015) Strong frequency dependence of vibrational relaxation in bulk and surface water reveals sub-picosecond structural heterogeneity. Nat Commun 6:8384.
42. McGuire JA, Shen YR (2006) Ultrafast vibrational dynamics at water interfaces. Science 313:1945–1948.
43. Heilweil EJ, Casassa MP, Cavanagh RR, Stephenson JC (1985) Vibrational deactivation of surface OH chemisorbed on SiO2: Solvent effects. J Chem Phys 82:5216–5231. 44. Lamb RN, Furlong DN (1982) Controlled wettability of quartz surfaces. J Chem Soc
Faraday Trans 1 Phys Chem Condens Phases 78:61–73.
45. Pfeiffer-Laplaud M, Gaigeot M-P, Sulpizi M (2016) pKa at quartz/electrolyte inter-faces. J Phys Chem Lett 7:3229–3234.
46. Cimas Á, Tielens F, Sulpizi M, Gaigeot M-P, Costa D (2014) The amorphous silica-liquid water interface studied by ab initio molecular dynamics (AIMD): Local organization in global disorder. J Phys Condens Matter 26:244106–244115.
47. Hassanali AA, Singer SJ (2007) Model for the water-amorphous silica interface: The undissociated surface. J Phys Chem B 111:11181–11193.
48. Liu W-T, Shen YR (2008) Surface vibrational modes ofα-quartz(0001) probed by
sum-frequency spectroscopy. Phys Rev Lett 101:016101-4.
49. Pezzotti S, Galimberti DR, Shen YR, Gaigeot M-P (2018) What the diffuse layer (DL)
reveals in non-linear SFG spectroscopy. Minerals (Basel) 8:305–315.
50. Pezzotti S, Gaigeot M-P (2018) Spectroscopic BIL-SFG invariance hides the chaotropic
effect of protons at the air-water interface. Atmosphere 9:396–411.
51. Pezzotti S, Galimberti DR, Shen YR, Gaigeot M-P (2018) Structural definition of the BIL
and DL: A new universal methodology to rationalize non-linearχ(2)(ω) SFG signals
at charged interfaces, includingχ(3)(ω) contributions. Phys Chem Chem Phys 20:
5190–5199.
52. Urashima SH, Myalitsin A, Nihonyanagi S, Tahara T (2018) The topmost water struc-ture at a charged silica/aqueous interface revealed by heterodyne-detected vibra-tional sum frequency generation spectroscopy. J Phys Chem Lett 9:4109–4114. 53. Shin S, Willard AP (2018) Water’s interfacial hydrogen bonding structure reveals the
effective strength of surface-water interactions. J Phys Chem B 122:6781–6789. 54. Xi E, et al. (2017) Hydrophobicity of proteins and nanostructured solutes is governed
by topographical and chemical context. Proc Natl Acad Sci USA 114:13345–13350. 55. Becke AD (1988) Density-functional exchange-energy approximation with correct
asymptotic behavior. Phys Rev A Gen Phys 38:3098–3100.
56. Lee C, Yang W, Parr RG (1988) Development of the Colle-Salvetti correlation-energy formula into a functional of the electron density. Phys Rev B Condens Matter 37: 785–789.
57. Grimme S (2004) Accurate description of van der Waals complexes by density func-tional theory including empirical corrections. J Comput Chem 25:1463–1473. 58. Grimme S (2006) Semiempirical GGA-type density functional constructed with a
long-range dispersion correction. J Comput Chem 27:1787–1799.
59. Ugliengo P, et al. (2008) Realistic models of hydroxylated amorphous silica surfaces and MCM-41 mesoporous material simulated by large-scale periodic B3LYP
calcula-tions. Adv Mater 20:4579–4583.
60. Pezzotti S, Galimberti DR, Gaigeot M-P (2017) 2D H-bond network as the topmost skin
to the air-water interface. J Phys Chem Lett 8:3133–3141.
Cyran et al. PNAS | January 29, 2019 | vol. 116 | no. 5 | 1525
CHE