HAL Id: hal-01478521
https://hal-amu.archives-ouvertes.fr/hal-01478521
Submitted on 28 Feb 2017
HAL is a multi-disciplinary open access
archive for the deposit and dissemination of
sci-entific research documents, whether they are
pub-lished or not. The documents may come from
teaching and research institutions in France or
abroad, or from public or private research centers.
L’archive ouverte pluridisciplinaire HAL, est
destinée au dépôt et à la diffusion de documents
scientifiques de niveau recherche, publiés ou non,
émanant des établissements d’enseignement et de
recherche français ou étrangers, des laboratoires
publics ou privés.
Tau antagonizes end-binding protein tracking at
microtubule ends through a phosphorylation- dependent
mechanism
Sacnicte Ramirez-Rios, Eric Denarier, Elea Prezel, Angélique Vinit, Virginie
Stoppin-Mellet, François Devred, Pascale Barbier, Vincent Peyrot, Carmen
Laura Sayas, Jesús Avila, et al.
To cite this version:
Sacnicte Ramirez-Rios, Eric Denarier, Elea Prezel, Angélique Vinit, Virginie Stoppin-Mellet, et al..
Tau antagonizes end-binding protein tracking at microtubule ends through a phosphorylation-
depen-dent mechanism. Molecular Biology of the Cell, American Society for Cell Biology, 2016, 27 (19),
pp.2924-2934. �10.1091/mbc.E16-01-0029)�. �hal-01478521�
MBoC |
ARTICLE
Tau antagonizes end-binding protein tracking
at microtubule ends through a
phosphorylation-dependent mechanism
ABSTRACT Proper regulation of microtubule dynamics is essential for cell functions and in-volves various microtubule-associated proteins (MAPs). Among them, end-binding proteins (EBs) accumulate at microtubule plus ends, whereas structural MAPs bind along the microtu-bule lattice. Recent data indicate that the structural MAP tau modulates EB subcellular local-ization in neurons. However, the molecular determinants of EB/tau interaction remain un-known, as is the effect of this interplay on microtubule dynamics. Here we investigate the mechanisms governing EB/tau interaction in cell-free systems and cellular models. We find that tau inhibits EB tracking at microtubule ends. Tau and EBs form a complex via the C-ter-minal region of EBs and the microtubule-binding sites of tau. These two domains are required for the inhibitory activity of tau on EB localization to microtubule ends. Moreover, the phos-phomimetic mutation S262E within tau microtubule-binding sites impairs EB/tau interaction and prevents the inhibitory effect of tau on EB comets. We further show that microtubule dynamic parameters vary, depending on the combined activities of EBs and tau proteins. Overall our results demonstrate that tau directly antagonizes EB function through a phos-phorylation-dependent mechanism. This study highlights a novel role for tau in EB regulation, which might be impaired in neurodegenerative disorders.
INTRODUCTION
Microtubules are major components of the eukaryotic cytoskeleton and are essential for intracellular transport, mitosis, and cellular ar-chitecture (Desai and Mitchison, 1997). They are 25-nm hollow
cyl-inders resulting from the assembly of α/β-tubulin heterodimers (Amos and Schlieper, 2005). Microtubule ends constantly oscillate between phases of polymerization and depolymerization, a behav-ior known as dynamic instability (Mitchison and Kirschner, 1984). Transitions from growth to shortening are referred to as catastro-phes and reverse events as rescues. In living cells, a variety of micro-tubule-associated proteins (MAPs) interact with free tubulin and/or microtubules to regulate their properties and spatial organization. Plus end– tracking proteins (+TIPs) are a diverse group of MAPs that preferentially associate with the growing plus ends of microtubules (Galjart, 2010). The +TIPs form a complex interaction network at microtubule plus ends, where they control both microtubule dynam-ics and microtubule anchorage to distinct subcellular targets (e.g., cell cortex, vesicles, kinetochores).
Monitoring Editor Thomas Surrey
The Francis Crick Institute Received: Jan 15, 2016 Revised: Jul 19, 2016 Accepted: Jul 22, 2016
This article was published online ahead of print in MBoC in Press (http://www .molbiolcell.org/cgi/doi/10.1091/mbc.E16-01-0029) on July 27, 2016. †These authors contributed equally to this work.
*Address correspondence to: Isabelle Arnal (isabelle.arnal@univ-grenoble-alpes.fr). © 2016 Ramirez-Rios et al. This article is distributed by The American Society for Cell Biology under license from the author(s). Two months after publication it is available to the public under an Attribution–Noncommercial–Share Alike 3.0 Unported Creative Commons License (http://creativecommons.org/licenses/by -nc-sa/3.0).
“ASCB®,” “The American Society for Cell Biology®,” and “Molecular Biology of the Cell®” are registered trademarks of The American Society for Cell Biology. Abbreviations used: EB, end-binding protein; MAP, microtubule-associated protein.
Sacnicte Ramirez-Riosa,b, Eric Denariera,b,c, Eléa Prezela,b,†, Angélique Vinita,b,†,
Virginie Stoppin-Melleta,b, François Devredd, Pascale Barbierd, Vincent Peyrotd,
Carmen Laura Sayase, Jesus Avilaf, Leticia Perisa,b, Annie Andrieuxa,b,c, Laurence Serrea,b,
Anne Fourest-Lieuvina,b,c, and Isabelle Arnala,b,*
aUniversité Grenoble Alpes, Grenoble Institut des Neurosciences, F-38000 Grenoble, France; bINSERM, U1216,
F-38000 Grenoble, France; cCEA, BIG-GPC, F-38000 Grenoble France; dAix-Marseille Université, INSERM, CRO2
UMR_S 911, Faculté de Pharmacie, F-13385 Marseille, France; eCentro de Investigaciones Biomédicas de Canarias
entro de Investigaciones Biomédicas de Canarias, Instituto de Tecnologías Biomédicas, Universidad de La Laguna, 38071 Tenerife, Spain; fCentro de Biología Molecular “Severo Ochoa” (CSIC-UAM), 28029 Madrid, Spain
Among the +TIP family, end-binding protein 1 (EB1) is consid-ered as a major integrator of microtubule end behavior (Akhmanova and Steinmetz, 2010). EB1 autonomously end-tracks growing micro-tubules, where it recruits many other +TIPs, ensuring tight control of microtubule properties (Bieling et al., 2007; Dixit et al., 2009; Honnappa et al., 2009; Zanic et al., 2009; Zimniak et al., 2009). EB1 and its homologues (EB2 and 3) in mammals are composed of an N-terminal calponin-homology domain, which is required for micro-tubule binding, and a C-terminal dimerization domain (Hayashi and Ikura, 2003; Honnappa et al., 2005; Slep et al., 2005; De Groot et al., 2010). The C-terminal part includes a unique EB1 homology (EBH) domain followed by an acidic C-terminal tail, both of which are involved in the interactions of EBs with multiple partners (Akhmanova and Steinmetz, 2010). Because of its central role in the +TIP network, the association of EB1 with microtubule ends is tightly regulated to ensure precise spatiotemporal control of the cytoskel-eton. The mechanisms underlying this regulation, however, are poorly understood.
Recent studies have proposed that the localization of EB proteins (EB1 and 3) on microtubules is modulated by structural MAPs pri-marily characterized by their binding along the microtubule lattice (Kapitein et al., 2011; Sayas and Avila, 2014; Velot et al., 2015). Ex-amples of this cross-talk include MAP2-dependent distribution of EB3 along dendritic microtubules upon neuronal activation (Kapitein et al., 2011) and sequestration of EB1/3 by MAP1B in the cytosol of neuronal cells (Tortosa et al., 2013). Tau is another major structural MAP involved in the neuronal development and maintenance of the brain integrity. We recently identified tau as a partner of EBs in neu-rons and found that tau regulates EB subcellular localization (Sayas et al., 2015). The molecular basis of such interplay and the conse-quences for microtubule dynamic behavior are unknown.
Here we sought to dissect how tau and its phosphorylation af-fect EB behavior at microtubule tips. We provide biochemical and cell-biological evidence that tau inhibits the microtubule-end track-ing properties of EBs. We find that the basic microtubule-bindtrack-ing sites of tau directly interact with the C-terminal region of EBs and that these two interacting domains are required for the inhibitory activity of tau on EB localization to microtubule ends. Of note, a phosphomimetic mutation S262E within tau microtubule-binding sites impairs EB/tau interaction. This S262E-tau mutant does not inhibit the formation of EB comets. Our results further show that the parameters of microtubule dynamics change depending on the combined activities of EB and tau proteins. Taken together, our data support a novel mechanism by which tau directly regulates EB prop-erties at microtubule ends.
RESULTS
Tau inhibits EB1 tracking at microtubule plus ends
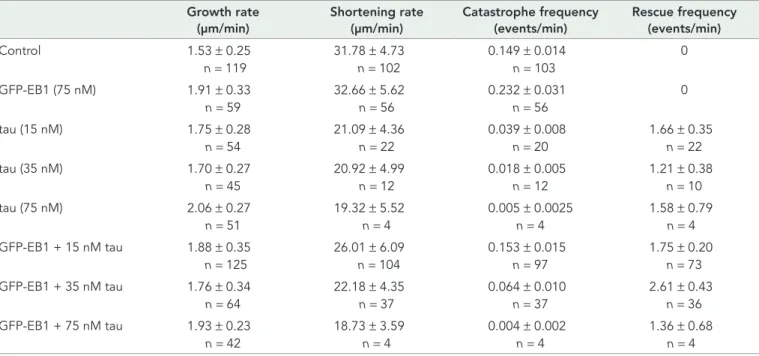
We investigated whether tau affected EB1 intrinsic properties by reconstituting in vitro microtubule dynamics and EB1 tracking at crotubule ends using total internal reflection fluorescence (TIRF) mi-croscopy (Figure 1A). Red-labeled purified tubulin was nucleated from brightly fluorescent seeds, and microtubule behavior was ana-lyzed in the presence of green fluorescent protein (GFP)–EB1, tau, and combinations of the two proteins. In the control conditions (tubulin alone), microtubules alternated between phases of growth and shortening (Table 1). GFP-EB1 formed comets at the extremity FIGURE 1: Tau inhibits EB1 tracking at microtubule ends in a
concentration-dependent manner. (A) Kymographs of microtubules assembled in the presence of 75 nM GFP-EB1 alone or with
combinations of 75 nM GFP-EB1 and increasing concentrations of tau (15, 35, and 75 nM). The white stars indicate rescues after catastrophe events. Horizontal and vertical bars, 5 μm and 60 s, respectively. MT, microtubule. (B) Histogram indicating GFP-EB1 fluorescence intensity at microtubule tips in the absence or presence of increasing tau concentration. **p < 0.01, ****p < 0.0001 (Kruskal–Wallis analysis of variance [ANOVA] followed by post hoc Dunn’s comparison; n = 35, 75, 81, and 34 for GFP-EB1, GFP-EB1 + 15 nM tau, GFP-EB1 + 35 nM tau, and GFP-EB1 + 75 nM tau, respectively). The p values were calculated in comparison to the condition without tau. a.u., arbitrary units. (C) Catastrophe frequency vs. tau concentration in the absence (black) or presence (gray) of GFP-EB1. Data were fitted by a one-phase exponential decay model (R2 = 0.99 for both data sets), and the
two curves were significantly different with p = 0.02 (F-test). (D) Microtubule shrinkage rates measured with or without GFP-EB1 (75 nM) and at increasing tau concentrations (0, 15, 35, and 75 nM). ***p < 0.001 (Mann–Whitney U test, n = 22 and 104 for tau 15 nM and tau 15 nM + GFP-EB1, respectively). (E) Histograms showing GFP-EB1 (left) and GFP-EB1-Δ-tail (right) fluorescence intensity at microtubule tips and on the microtubule lattice in the presence or absence of
tau. Equimolar concentrations (75 nM) of GFP-EB1, GFP-EB1-Δ-tail, and tau were used. *p < 0.05, ****p < 0.0001 (Mann–Whitney U test comparison, n = 20 for each condition). All error bars represent SDs.
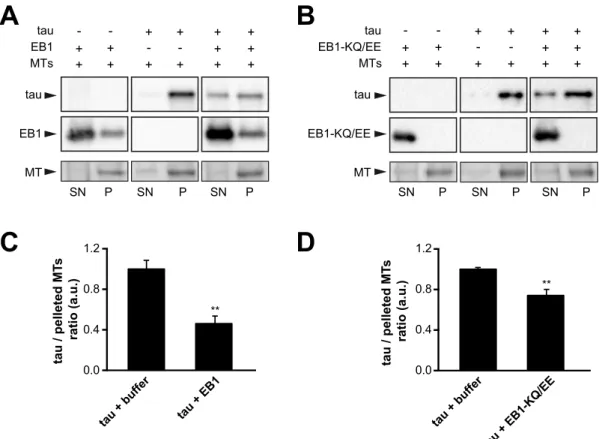
GFP-EB1 strongly altered the capacity of tau to reduce the catastro-phe rate compared with 15 nM tau alone. At this low tau:EB1 ratio, microtubules also disassembled faster than with tau alone, indicat-ing that they were less stabilized (Figure 1D). These results sug-gested that a fraction of tau might be prevented from binding to the microtubule wall in the presence of EB1. Moreover, cosedimenta-tion assays revealed that an excess of EB1 could displace tau mol-ecules bound to Taxol-stabilized microtubules (Supplemental Figure S1A and Supplemental Materials and Methods). In these conditions, a portion of EB1 associates with microtubules (Maurer et al., 2012; Zhang et al., 2015) and can compete with the microtubule-binding sites of tau. We thus produced a mutant of EB1 (EB1-KQ/EE) with impaired microtubule-binding properties by substituting K100 and Q102 in the CH domain with glutamate residues (Maurer et al., 2012; Zhang et al., 2015). EB1-KQ/EE still induced a significant re-lease of tau from microtubules (Supplemental Figure S1B), support-ing the hypothesis that soluble EB1 affects tau bindsupport-ing to the micro-tubule wall.
We then asked whether tau could recruit EB1 along the micro-tubule wall in our reconstitution assay, since EB proteins have been identified as partners of structural MAPs in neurons (Kapitein et al., 2011; Tortosa et al., 2013; Sayas et al., 2015; see later description). The very weak GFP-EB1 labeling observed along the microtubule lattice by TIRF microscopy was not enhanced in the presence of equimolar amount of tau (75 nM) and was even slightly reduced compared with GFP-EB1 alone (Figure 1E, left). To confirm this result, we produced a GFP-EB1 construct lacking the last 20 resi-dues (GFP-EB1-Δ-tail) and exhibiting enhanced binding to the mi-crotubule wall compared with full-length EB1 (Buey et al., 2011). The results showed that the intensity of GFP-EB1-Δ-tail decreased drastically both at microtubule ends and along the microtubule lattice in the presence of equimolar amount of tau (Figure 1E, right). Thus tau inhibits the binding of EB1 along the microtubule wall in vitro.
of growing microtubules (Figure 1, A and B) and stimulated catastro-phes (Table 1 and Supplemental Movie S1), as reported previously (Bieling et al., 2007; Vitre et al., 2008; Komarova et al., 2009; Zanic et al., 2013). Conversely, tau strongly decreased the catastrophe fre-quency (from 0.149 event/min in the tubulin-alone control to 0.005 event/min with the highest tau concentration; Table 1), induced res-cues, and slowed the microtubule shrinkage rate (Table 1). Such ef-fects already could be observed at very low tau:tubulin ratios (15 nM tau; Table 1) and are consistent with the known microtubule-stabiliz-ing properties of this neuronal MAP (Panda et al., 1995, 2003). Strik-ingly, the simultaneous addition of EB1 and tau reduced GFP-EB1 localization at microtubule ends in a tau concentration–dependent manner (Figure 1, A and B). Using a fixed amount of GFP-EB1 (75 nM) and increasing concentrations of tau (0, 15, 35, and 75 nM), we observed a gradual decrease in GFP-EB1 comet intensity from 100 a.u. in the absence of tau to 19 a.u with 75 nM tau (Figure 1B and Supplemental Movie S1). This progressive inhibition of GFP-EB1 end-tracking properties was accompanied by large changes in microtubule dynamics. In the presence of GFP-EB1 alone, micro-tubules were highly unstable, undergoing catastrophes without res-cue events (i.e., total depolymerization of the polymer down to the seeds; Figure 1A and Table 1). On addition of 15 nM tau, a portion of the shrinking events was rescued before the total depolymeriza-tion of microtubules due to concomitant destabilizing and stabiliz-ing activities of EB1 and tau, respectively. In contrast, microtubules assembled with equimolar amounts (75 nM) of GFP-EB1 and tau grew persistently with a catastrophe frequency as low as with tau alone, showing that EB1 effects on microtubule dynamics were hampered by tau in this condition.
We next wondered whether EB1 could reciprocally affect the microtubule-regulating properties of tau. We noticed that, at sub-stoichiometric tau concentrations relative to GFP-EB1, the inhibitory activity of tau on catastrophes was affected by the presence of GFP-EB1 (Figure 1C). In particular, combination of 15 nM tau and 75 nM
Growth rate (μm/min) Shortening rate (μm/min) Catastrophe frequency (events/min) Rescue frequency (events/min) Control 1.53 ± 0.25 31.78 ± 4.73 0.149 ± 0.014 0 n = 119 n = 102 n = 103 GFP-EB1 (75 nM) 1.91 ± 0.33 32.66 ± 5.62 0.232 ± 0.031 0 n = 59 n = 56 n = 56 tau (15 nM) 1.75 ± 0.28 21.09 ± 4.36 0.039 ± 0.008 1.66 ± 0.35 n = 54 n = 22 n = 20 n = 22 tau (35 nM) 1.70 ± 0.27 20.92 ± 4.99 0.018 ± 0.005 1.21 ± 0.38 n = 45 n = 12 n = 12 n = 10 tau (75 nM) 2.06 ± 0.27 19.32 ± 5.52 0.005 ± 0.0025 1.58 ± 0.79 n = 51 n = 4 n = 4 n = 4 GFP-EB1 + 15 nM tau 1.88 ± 0.35 26.01 ± 6.09 0.153 ± 0.015 1.75 ± 0.20 n = 125 n = 104 n = 97 n = 73 GFP-EB1 + 35 nM tau 1.76 ± 0.34 22.18 ± 4.35 0.064 ± 0.010 2.61 ± 0.43 n = 64 n = 37 n = 37 n = 36 GFP-EB1 + 75 nM tau 1.93 ± 0.23 18.73 ± 3.59 0.004 ± 0.002 1.36 ± 0.68 n = 42 n = 4 n = 4 n = 4
Dynamic parameters were measured for microtubules assembled with tubulin (12 μM) in the absence or presence of the indicated proteins. The total times of measurements (growing and shrinkage phases) were 723.80, 261.92, 514.74, 666.96, 742.74, 674.38, 583.67, and 850.78 min for tubulin alone, 75 nM GFP-EB1, 15 nM tau, 35 nM tau, 75 nM tau, 75 nM GFP-EB1 + 15 nM tau, 75 nM GFP-EB1 + 35 nM tau, and 75 nM GFP-EB1 + 75 nM tau, respectively. n, number of events measured for each condition. Values represent mean ± SD.
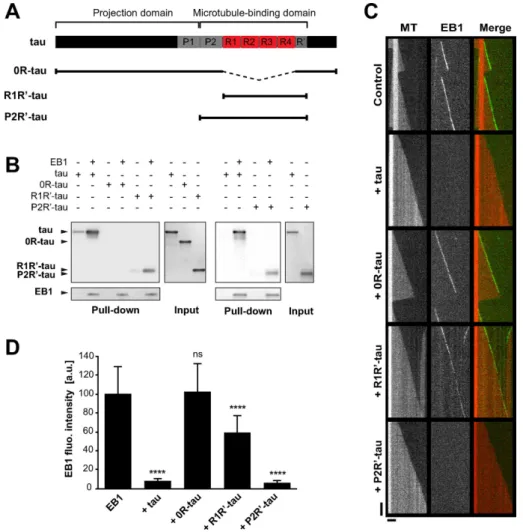
N-terminal domain responsible for microtu-bule binding and a C-terminal part involved in dimerization and interaction with many partners. We used the EB1-NL-LZ con-struct, in which the whole C-terminal part of EB1 was removed and replaced by the leu-cine zipper domain of yeast GCN4 to artifi-cially dimerize the N-terminal domain of EB1 (Komarova et al., 2009; Buey et al., 2011). Pull-down experiments revealed that EB1-NL-LZ was far less efficient in binding tau than EB1 (Figure 3A), indicat-ing that EB1 interacted with tau through its C-terminal domain. We then evaluated by TIRF microscopy whether the C-terminal part of EBs was also required for the inhibi-tory activity of tau on EB tracking at micro-tubule tips. For these experiments, EB3 ap-peared more suitable than EB1 since, in contrast with EB1, the removal of the C-terminal part of EB3 does not significantly affect its microtubule end–binding proper-ties (Komarova et al., 2009; Skube et al., 2010; Buey et al., 2011). We thus used the chimera GFP-EB3-NL-LZ, which accumu-lated at microtubule ends and promoted catastrophe events similar to GFP-EB3 (Figure 3B and Table 2; Komarova et al., 2009; Buey et al., 2011). Increasing concen-trations of tau strongly decreased the comet intensity of GFP-EB3 (Figure 3, B and C, and Supplemental Movie S2), as ob-served earlier for GFP-EB1 (Figure 1). Moreover, microtubules assembled with both GFP-EB3 and tau elongated with few catastrophes and some rescue events, showing that tau impeded the microtubule-destabilizing activity of EB3 (Table 2). By contrast, for equimolar concentrations of tau and GFP-EB3-NL-LZ, tau did not inhibit GFP-EB3-NL-LZ binding at mi-crotubule ends (comet intensity of 109 a.u. with 10 nM tau versus 100 a.u. without tau), and we observed only a slight decrease of GFP-EB3-NL-LZ comet intensity at higher tau concentration (comet intensity of 68 a.u. with 40 nM tau compared with 100 a.u. without tau; Figure 3, B and D, and Supplemental Movie S3). In these condi-tions, microtubules were highly dynamic and exhibited both catas-trophes and rescues due to the concomitant microtubule-regulating activities of GFP-EB3-NL-LZ and tau, respectively (Table 2). Taken together, these results reveal that the C-terminal region of EBs inter-acts with tau and is a key element for the inhibitory effect of tau on EB tracking at microtubule ends.
The basic microtubule-binding sites of tau directly interact with EB1
We next intended to determine the motifs of tau involved in EB1 binding. Tau can be divided into two main regions (Figure 4A): an acidic, N-terminal projection domain and a basic, C-terminal do-main, which is composed of a proline-rich region (P2), four con-served basic repeats (R1–R4), and a C-terminal extension including a pseudorepeat (R′). The repeat motifs and flanking sequences (i.e., P2 and R′) constitute the microtubule-binding domain (MTBD) and are responsible for the microtubule-stabilizing properties of tau (Trinczek et al., 1995; Mukrasch et al., 2007, 2009). The N-terminal part of tau contains one putative consensus EB binding site (TXIP; We next investigated whether tau affected EB behavior in a
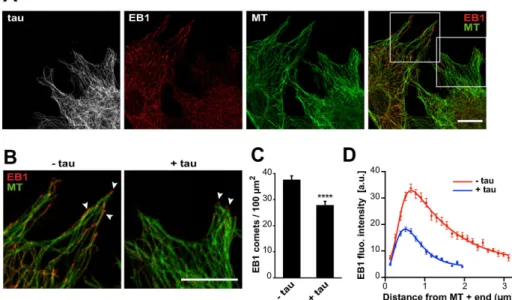
cel-lular model. Mouse embryonic fibroblasts, devoid of endogenous tau, were transfected with EGFP-tau and immunolabeled for EB1. In agreement with the results obtained with purified proteins, we ob-served a reduction of EB1 comets in cells expressing tau (Figure 2, A and B). Quantifications showed that both the density (Figure 2C) and mean intensity (Figure 2D) of comets were markedly decreased. Furthermore, the mean length of comets was reduced from 2.28 μm ± 0.06 (SEM, n = 70 comets) in nontransfected cells to 1.30 μm ± 0.03 (n = 95 comets) in tau-transfected cells. We also noticed reloca-tion of EB1 along tau-induced microtubule bundles in some cells expressing high levels of tau (Supplemental Figure S2; see Discus-sion), as reported previously in neurons (Sayas et al., 2015). Overall these results demonstrate that tau inhibits EB1 localization at micro-tubule ends.
Tau inhibitory effect on EB tracking at microtubule ends is mediated by the C-terminal part of EBs
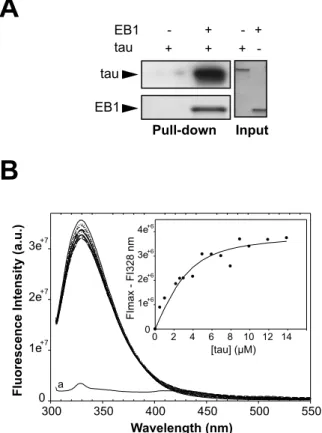
The inhibitory effect of tau on EB1 end-tracking properties might rely on a direct interaction between tau and EB1. Accordingly, we recently identified tau as a partner of EB1 in neurons (Sayas et al., 2015) and showed that EB1 directly binds tau in pull-down experi-ments using purified proteins (Figure 3A and Supplemental Figure S3A). To quantify this interaction, we estimated the apparent affinity of tau and EB1 by fluorescence spectroscopy (Supplemental Figure S3B). EB1 fluorescence upon tau addition showed saturable quench-ing, indicating the formation of a complex between the two proteins with an apparent dissociation constant of 1.7 ± 1.1 μM. We next determined the tau-interacting region in EB1. EBs consist of an
FIGURE 2: Tau inhibits EB localization at microtubule ends in fibroblasts. (A) Mouse embryonic fibroblasts were transfected with pEGFP-tau and stained for EGFP (tau, gray), EB1 (red), and tubulin (MT, green). Right, merged image with EB1 and tubulin staining. Images include transfected and nontransfected cells in the same field. Bar, 10 μm. (B) Higher magnifications of nontransfected (−tau) and transfected (+tau) cells. Arrowheads point to comets. Bar, 10 μm. (C) EB1 comet density normalized to the microtubule network surface (comet number/100 μm2
of microtubule network) in lamellipodia of nontransfected (−tau) or pEGFP-tau transfected (+tau) cells. The histogram shows the mean ± SEM. ****p < 0.0001, Mann-Whitney U test comparison (n = 80 and 88 regions of interest for –tau and +tau conditions, respectively). (D) The fluorescence intensity of comets was quantified in nontransfected (−tau) and transfected (+tau) cells and plotted against the distance from microtubule plus ends. Nonlinear regression curves fitting the mean fluorescence intensities ± SEM (70 and 95 comets for –tau and +tau conditions, respectively). a.u., arbitrary units.
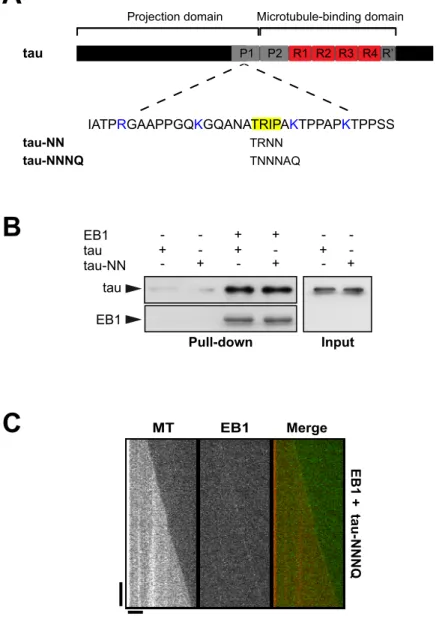
Supplemental Figure S4A; Honnappa et al., 2009). We performed several mutations to invalidate this site in the tau protein, but these mutations neither altered tau/EB1 interaction nor modified tau-de-pendent inhibition of EB1 comets (Supplemental Figure S4, B and C). We thus focused on the basic domains of tau, as they might in-teract with the negatively charged C-terminal part of EBs. We pro-duced various forms of tau (Figure 4A): 0R-tau (deletion of the four repeats), R1R′-tau (tau fragment from R1 to R′), and P2R′-tau (tau fragment from P2 to R′). Removal of R1–R4 repeats (0R-tau) com-pletely abolished tau interaction with EB1 (Figure 4B). EB1 still bound the two fragments R1R′- and P2R′-tau, however, indicating that the repeat motifs of tau are necessary for the formation of a complex between the two proteins. TIRF assays revealed that 0R-tau was not able to inhibit the tracking of GFP-EB1 at microtubule ends (Figure 4, C and D). This suggested that tau repeats were required for the inhibition of EB1 accumulation at microtubule ends. How-ever, the minimal fragment R1R′-tau including the repeats only slightly decreased the comet intensity of GFP-EB1 compared with the full-length tau (68 vs. 8 a.u., respectively; Figure 4D). By contrast, the fragment of tau containing the P2 domain in addition to the re-peat motifs (P2R′-tau fragment) strongly inhibited GFP-EB1 tracking at microtubule tips to the same extent as tau (7 and 8 a.u., respec-tively; Figure 4D). Overall these data indicate that the inhibitory ac-tivity of tau on EB comets requires both the microtubule-binding repeats and the P2 region of tau.
The interaction between tau and EB1 is regulated by phosphorylation
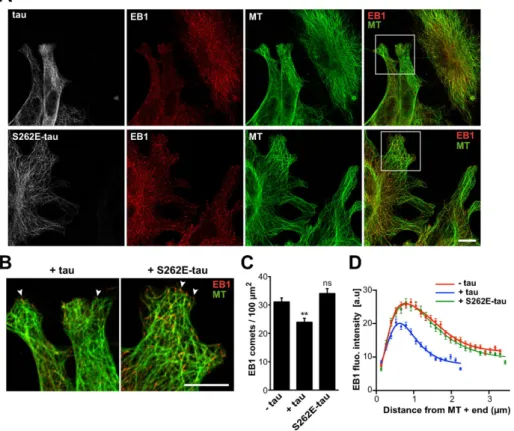
The microtubule-stabilizing properties of tau are tightly regulated by phosphorylation (Buee et al., 2000). Given that EB1 interacts with the basic microtubule-binding sites of the neuronal MAP, phosphor-ylation in this region might affect tau/EB1 association. To address this question, we produced a phosphomimetic version of tau with the serine 262 replaced by a glutamate residue (S262E-tau). The serine 262 is localized within the first tau repeat (R1) and has been shown to be phosphorylated in vivo in both physiological and path-ological conditions (Seubert et al., 1995). Phosphorylation at this site reduced microtubule-stabilizing properties of tau through intra-molecular modifications (Trinczek et al., 1995; Devred et al., 2002; Kiris et al., 2011). Here we showed that the phosphomimetic muta-tion of tau on S262 induced a twofold decrease in tau interacmuta-tion with EB1 as detected by pull-down assays (50.1% ± 15.8 of S262E-tau bound to EB1 compared with S262E-tau, three independent experi-ments, mean ± SD; Figure 5A). We next performed end-tracking experiments of GFP-EB1 with either tau or S262E-tau. We first showed that S262E-tau alone was still able to stabilize microtubules by lowering catastrophes and promoting rescues, albeit less effi-ciently than tau (Figure 5D, compare third and fifth lines). In addi-tion, with comparable tau:tubulin molar ratio used in the TIRF condi-tions (1:160), we observed a similar proportion of tau and S262E-tau bound to microtubules, as shown by cosedimentation assays per-formed on microtubules self-assembled with tau proteins (∼1 tau or FIGURE 3: Tau inhibitory effect on microtubule-tracking properties of
EBs requires the C-terminal part of EBs. (A) Pull-down assays of tau with biotinylated-EB1 or biotinylated-EB1-NL-LZ. (B) Kymographs of microtubules assembled with 10 nM GFP-EB3 (left) or GFP-EB3-NL-LZ (right) in the absence (control) or presence of increasing
concentrations of tau. Protein concentrations were decreased compared with conditions with GFP-EB1 and tau (Figure 1) to avoid GFP-EB3-NL-LZ binding to the microtubule lattice. Horizontal and vertical bars, 5 μm and 60 s, respectively. MT, microtubule. (C, D) Fluorescence intensity of GFP-EB3 (C) and GFP-EB3-NL-LZ
(D) comets in the absence or presence of increasing concentrations of tau. ***p < 0.001; ****p < 0.0001; ns, nonsignificant; nonparametric Kruskal–Wallis ANOVA followed by post hoc Dunn’s comparison (42, 37, and 48 microtubules for EB3, EB3 + 10 nM tau, and EB3 + 40 nM tau, respectively; 22, 40, and 30 microtubules for EB3-NL-LZ, EB3-NL-LZ + 10 nM tau, and EB3-NL-LZ + 40 nM tau, respectively). The p values were calculated in comparison to the conditions without tau. All error bars represent SD. a.u., arbitrary units.
Growth rate (μm/min) Shortening rate (μm/min) Catastrophe frequency (events/min) Rescue frequency (events/min) Control 1.47 ± 0.28 28.53 ± 12.6 0.127 ± 0.019 0 n = 62 n = 44 n = 44 GFP-EB3 (10 nM) 1.94 ± 0.35 28.17 ± 8.98 0.440 ± 0.030 0 n = 162 n = 136 n = 206 tau (10 nM) 1.43 ± 0.63 20.28 ± 12.96 0.014 ± 0.005 3.44 ± 1.3 n = 35 n = 7 n = 7 n = 7 tau (40 nM) 1.83 ± 0.20 37.41 0.001 10.01 n = 33 n = 1 n = 1 n = 1 GFP-EB3 + 10 nM tau 1.49 ± 0.34 26.90 ± 8.88 0.024 ± 0.006 2.57 ± 0.74 n = 48 n = 13 n = 15 n = 12 GFP-EB3 + 40 nM tau 1.83 ± 0.41 40.42 ± 14.64 0.004 ± 0.002 8.58 ± 6.06 n = 51 n = 2 n = 2 n = 2 GFP-EB3-NL-LZ (10 nM) 2.12 ± 0.46 25.99 ± 6.30 0.450 ± 0.034 0 n = 285 n = 177 n = 168 GFP-EB3-NL-LZ + 10 nM tau 2.29 ± 0.77 15.21 ± 5.90 0.315 ± 0.032 3.13 ± 0.32 n = 105 n = 92 n = 92 n = 92 GFP-EB3-NL-LZ + 40 nM tau 1.83 ± 0.52 20.48 ± 6.16 0.056 ± 0.010 2.07 ± 0.37 n = 55 n = 31 n = 31 n = 30
Dynamic parameters were measured for microtubules assembled with tubulin (12 μM) in the absence or presence of the indicated proteins. The total times of mea-surements (growing and shrinkage phases) were 362.10, 497.24, 479.61, 513.44, 626.50, 457.13, 403.48, 321.11, and 565.12 min for tubulin alone, 10 nM GFP-EB3, 10 nM tau, 40 nM tau, 10 nM EB3 + 10 nM tau, 10 nM EB3 + 40 nM tau, 10 nM EB3-NL-LZ, 10 nM EB3-NL-LZ + 10 nM tau, and 10 nM GFP-EB3-NL-LZ + 40 nM tau, respectively. n, number of events measured for each condition. Values represent mean ± SD.
TABLE 2: Effects of EB3, EB3-NL-LZ, and tau on microtubule dynamics.
FIGURE 4: EB1 interacts with tau microtubule-binding sites. (A) Schematic representation of full-length tau and the constructs used in this study. The N-terminal extremity and the proline-rich P1 region constitute the projection domain of tau. The microtubule-binding domain includes the second proline-rich P2 region, the tandem repeats (R1–R4). and the pseudorepeat motif (R′). (B) Pull-down assays of the indicated tau proteins with biotinylated-EB1. (C) Kymographs of individual microtubules growing with 75 nM GFP-EB1 in the absence (control) or presence of 75 nM indicated tau protein. MT, microtubule. (D) Fluorescence intensity of EB1 comets in the absence or in the presence of the indicated tau proteins. ****p < 0.0001; ns, nonsignificant; nonparametric Kruskal–Wallis ANOVA followed by post hoc Dunn’s comparison (32, 27, 42, and 35 microtubules for EB1, EB1 + tau, EB1 + 0R-tau, and EB1 + R1R′-tau, respectively) and Mann–Whitney U test (30 and 39 microtubules for EB1 and EB1 + P2R′-tau, respectively). The p values were calculated in comparison to the condition without tau. All error bars represent SD. a.u., arbitrary units.
We next evaluated the effect of tau pseudophosphorylation on EB1 localization in fibroblasts expressing either tau or S262E-tau (Figure 6). In agreement with previous reports (Seubert et al., 1995; Alonso et al., 2010), S262E-tau was still able to bind to the microtubule lattice (Figure 6A, bottom). However, compared with the strong reduc-tion of endogenous EB1 at microtubule ends in tau-transfected cells, S262E-tau ex-pression did not induce any reduction of EB1 comets (Figure 6, A and B). Namely, the density (Figure 6C) and mean intensity (Figure 6D) of comets in S262E-tau trans-fected cells were similar to those in non-transfected cells. Furthermore, the average comet lengths were equivalent in S262E-tau-transfected cells (2.58 μm ± 0.04, 132 comets) and nontransfected cells (2.55 μm ± 0.03, 247 comets). Overall these data show that S262E-tau interacts less efficiently with EBs than tau and has little effect on EB com-ets at microtubule ends.
DISCUSSION
Structural MAPs primarily bind to and stabi-lize the microtubule lattice (Amos and Schlieper, 2005), whereas EB proteins pref-erentially accumulate at microtubule grow-ing ends, where they modulate microtubule dynamics and microtubule interaction with cellular targets (Akhmanova and Steinmetz, 2010). Recent studies reported a role for structural MAPs in the regulation of EB lo-calization in cells (Kapitein et al., 2011; Tortosa et al., 2013; Sayas et al., 2015; Velot et al., 2015); however, the underlying mech-anisms remain poorly understood. Here we show that tau inhibits the microtubule end– tracking properties of EBs and that this inhi-bition is regulated by tau phosphorylation. The interplay between EBs and tau results in large changes in microtubule dynamics. In particular, blocking the function of EBs in the presence of equimolar concentration of tau induces stably growing microtubules. By contrast, restoring EB end-tracking proper-ties at substoichiometric amounts of tau (or in the presence of tau phosphomutant) leads to dynamic polymers alternating be-tween catastrophes (EB-destabilizing activ-ity) and rescues (tau-stabilizing activactiv-ity).
From our results, we propose that the formation of a soluble complex between tau and EBs negatively regulates EB tracking at microtubule ends (Figure 7). First, tau and EBs directly interact via the C-terminal re-gion of EBs and the microtubule-binding sites of tau (Figures 3 and 4). Second, disruption of this complex by deletion of EB C-terminus (Figure 3) or phosphorylation of tau (Figure 5) causes the concomi-tant binding of tau and EBs to microtubules. Third, tau does not re-cruit EBs along microtubules (except in some cells expressing a high amount of tau; see later discussion), suggesting that EB-bound tau S262E-tau molecule per 100 dimers of polymerized tubulin;
Supple-mental Figure S5). In the presence of both S262E-tau and GFP-EB1, we still observed GFP-EB1 comets at microtubule ends with a fluo-rescence intensity of ∼71 a.u. compared with 100 a.u. for GFP-EB1 alone (Figure 5, B and C, right). Accordingly, microtubules under-went catastrophes and rescues due to the opposing microtubule-regulating activities of GFP-EB1 and S262E-tau (Figure 5D, sixth line).
FIGURE 5: S262E-tau interacts weakly with EB1 and does not inhibit EB1 tracking at microtubule ends. (A) Pull-down assays of tau and S262E-tau with biotinylated-EB1. One representative experiment. Quantifications indicate a decrease of 50.1% ± 15.8 of S262E-tau bound to EB1 compared with tau (three independent experiments, mean ± SD).
(B) Quantification of fluorescence intensity of EB1 comets in the presence of tau or S262E-tau. *p < 0.05, ****p < 0.0001, nonparametric Kruskal–Wallis ANOVA followed by post hoc Dunn’s comparison (37, 25, and 26 microtubules for EB1, EB1 + tau, and EB1 + S262E-tau, respectively). The p values were calculated in comparison to the condition without tau. Error bars represent SD. a.u., arbitrary units. (C) Kymographs of microtubules assembled with 75 nM GFP-EB1 in the absence (control) or presence of 75 nM of tau (+ tau) or S262E-tau (+ S262E-tau). Horizontal and vertical bars, 5 μm and 60 s, respectively. MT, microtubule. (D) Microtubule dynamics for tubulin alone (control) or in the presence of EB1, tau, S262E-tau, EB1 + tau, or EB1 + S262E-tau. The total times of measurements were 233.14, 444.28, 487.57, 567.19, 821.12, and 1014.26 min for tubulin alone, EB1, tau, EB1 + tau, S262E-tau, and EB1+S262E-tau, respectively. n, number of events measured for each condition. Values represent the mean ± SD.
tities of tau versus tubulin are able to sup-press microtubule dynamics (Tables 1 and 2; Panda et al., 1995, 2003). We therefore speculate that, in these conditions, the frac-tion of tau molecules not bound to EBs is sufficient to induce microtubule stabiliza-tion. Of note, the very fast turnover of tau onto microtubules that has been recently described in neurons is compatible with tau interaction with multiple partners (Janning et al., 2014), which could also explain its ca-pacities to both stabilize microtubules and bind EB proteins.
Alternatively, the association of tau with microtubules might indirectly influence EB localization by competing with the microtu-bule sites recognized by EBs and/or affect-ing the whole polymer structure. Accord-ingly, tau has been proposed to induce lattice structural modifications even at low tau:tubulin molar ratios, in the range of those used in the present study (Choi et al., 2009). However, these hypotheses fail to ex-plain the localization of EB3-NL-LZ at micro-tubule ends in the presence of tau (Figure 3), as well as the ability of EB1 to end-track microtubules copolymerized with S262E-tau, which still binds and stabilizes microtu-bules (Figures 5 and 6).
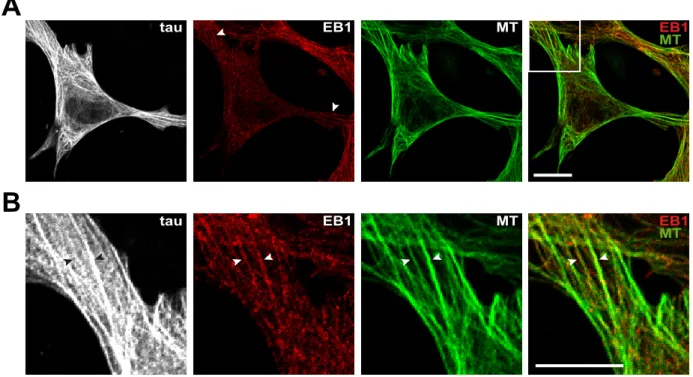
The inhibition of EB tracking at microtu-bule ends by tau in reconstitution assays is reminiscent of EB comet reduction in cells. Indeed, a decrease in EB localization to mi-crotubule plus ends is observed in fibro-blasts regardless of tau expression level (Figures 2 and 6) and also in neurons upon high tau expression (Sayas et al., 2015). In-triguingly, high tau expression in both cell types (Supplemental Figure S1; Sayas et al., 2015) leads to the relocation of EBs along tau-induced microtubule bundles, a phe-nomenon that we did not observe in puri-fied cell-free systems. The presence of many MAPs and kinases in cells, as well as various expression levels of tau during neuronal developmental stages and/ or between subcellular compartments, may account for these differ-ences. Furthermore, high tau concentrations have been proposed to trigger the formation of tau oligomers on the microtubule surface (Ackmann et al., 2000); such tau oligomers with multiple microtu-bule- and EB-binding sites could induce the recruitment of EBs along microtubule bundles in cells expressing high amounts of tau, as recently proposed in neurons (Sayas et al., 2015).
Of importance, the phosphomimetic mutation of tau within its microtubule-binding repeats strongly reduces tau/EB1 interaction. Furthermore, the S262E-tau mutant has only little effect on EB1 comets in both reconstituting assays and fibroblasts (Figures 5 and 6). In the presence of S262E-tau, EB1 can still bind to microtu-bule ends and exert its intrinsic catastrophe-promoting activity. Consequently, microtubules undergo both catastrophe and rescue events as a result of the combined activities of EB1 and S262E-tau (Figure 7C). Taken together, these data strongly suggest that the inhibitory effect of tau on EB localization to microtubule ends is remains soluble (Figures 1E and 2). Moreover, the interaction
be-tween tau and EBs likely induces EB conformational changes, as tau binding to the C-terminal domain of EB1 results in fluorescence modifications of tryptophan residues that are located in the EB1 N-terminal region (Supplemental Figure S3). Tau could thus sequester EBs and/or affect EB conformation upon binding, thereby hamper-ing +TIP localization to microtubule ends (Figure 7). The formation of such a complex might also affect tau properties, since EBs recog-nize the microtubule-binding sites of tau and should compete with tau/microtubule interaction. Indeed, the inhibitory activity of tau on catastrophes is impaired at substoichiometric amounts of tau com-pared with EB1, in agreement with the partial release of microtu-bule-bound tau by an excess of free EB1 (Figure 1 and Supplemen-tal Figure S1). Strikingly, in the presence of equimolar concentrations of tau and EBs, tau still stabilizes microtubules (low catastrophe fre-quency associated with rescues), although it inhibits EB localization at MT ends (Figures 1, 3, and 5). We explain this behavior by the strong microtubule-stabilizing properties of tau: even very low
quan-FIGURE 6: S262E-tau does not inhibit endogenous EB1 localization at microtubule ends. (A) Mouse embryonic fibroblasts were transfected with either tau (tau, top) or pcDNA-S262E-tau (pcDNA-S262E-tau, bottom) and stained for tau (gray), EB1 (red), and tubulin (MT, green). Right, merged images with EB1 and tubulin staining. Images include nontransfected and transfected cells in the same field. Bar, 10 μm. MT, microtubule. (B) Higher magnifications of cells transfected with pcDNA-tau (+tau) and pcDNA-S262E-tau (+S262E-tau). Arrowheads point to EB1 comets. Bar, 10 μm. (C) EB1 comet density normalized to the microtubule network surface (comet number/100 μm2 of microtubule network) in lamellipodia of nontransfected cells (−tau)
and cells transfected with tau (+tau) or S262E-tau (+S262E-tau). The histogram shows the mean ± SEM. **p < 0.01; ns, nonsignificant; nonparametric Kruskal–Wallis ANOVA followed by post hoc Dunn’s comparison (74, 46, and 52 regions of interest for –tau, +tau, and +S262E-tau conditions, respectively). The p values were calculated in comparison to the condition without tau. (D) The fluorescence intensity of comets was quantified in nontransfected (−tau) and transfected cells (+tau and +S262E-tau) and plotted against distance from microtubule plus ends. Nonlinear regression curves fitting the mean fluorescence intensities ± SEM (247, 177, and 132 comets for –tau, +tau, and +S262E-tau cells, respectively). a.u., arbitrary units.
(residues 1–189) and EB3 (residues 1–200) fused to the coiled-coil domain of GCN4 (Buey et al., 2011). The EB1-K100E/Q102E mutant (named EB1-KQ/EE in the text) was generated by PCR using the QuikChange II XL site directed-mutagenesis kit. The GFP-EB1 mutant lacking the last 20 amino acid residues (GFP-EB1-Δ-tail) was generated by a PCR-based strategy.
For pEGFP-tau, tau, and pcDNA-S262E-tau constructs, tau (1N4R isoform) or S262E-tau were PCR-amplified from the pD-EST constructs described and inserted into the pEGFP-C1 or pcDNA3.1 (+) plasmids us-ing the In-Fusion HD Clonus-ing kit (Clontech, Takara, Mountain View, CA).
Antibodies
For immunofluorescence, primary antibod-ies (Abs) were a mouse monoclonal Ab against the C-terminal part of EB1 (610534; BD Biosciences, San Jose, CA), a rabbit poly-clonal Ab against human tau (A0024; Dako, Glostrup, Denmark), a rabbit polyclonal Ab against enhanced GFP (EGFP: AB3080, Mil-lipore, Temecula, CA), and a rat monoclonal Ab against tyrosinated tubulin (clone YL1/2; Wehland and Willingham, 1983). Secondary antibodies were coupled to Alexa 488, Alexa 647 or Cyanine3 (Jackson Immuno-Research Laboratories, West Grove, PA).
Protein purification
Recombinant EB proteins were purified as described (Buey et al., 2011) and stored in K-BRB80 buffer (80 mM 1,4-piperazinediethane-sulfonic acid, 1 mM ethylene glycol tetraacetic acid, 1 mM MgCl2, 50 mM KCl, pH 6.8) and 20 mM Tris-HCl and 150 mM NaCl (pH 7.0), respectively. Histidine-tag recombinant tau proteins were purified using Talon metal affinity resin (Clontech) and further processed by size exclusion chromatography in BRB80 buffer. Tubulin was purified from bovine brain and fluorescently labeled with ATTO-565 (ATTO-Tech, Siegen, Germany) as previously described (Hyman et al., 1991). Protein concentrations refer to monomers for tau and EBs and to dimers for tubulin.
Pull-down assays
EB1 and EB1-NL-LZ proteins were biotinylated using the EZ-Link NHS-Chromogenic Biotinylation Kit (ThermoFisher Scientific, Waltham, MA). A 5-μg amount of biotinylated EB1 was incubated in 300 μl of PD-buffer (40 mM Tris-HCl, 50 mM NaCl, 0.05% Triton X-100, pH 7.0) with 5, 3.2, 1.9, and 2.1 μg of tau/S262E-tau, 0R-tau, R1R′-tau, and P2R′-tau, respectively (quantities of tau pro-teins were adjusted to obtain the same final molar concentra-tions). Samples were incubated for 15 min at 4°C before addition of streptavidin magnetic beads (ThermoFisher Scientific) and 60 min of incubation at 4°C. Streptavidin beads were washed in PD-buffer and resuspended in denaturating Laemmli sample buf-fer. Tau proteins recovered with beads were detected by Western blot using a polyclonal anti-tau primary antibody (dilution 1:10,000; Dako) and a horseradish peroxidase–conjugated anti-rabbit secondary antibody (1:2000; ThermoFisher Scientific), fol-lowed by enhanced chemiluminescence revelation. EB1 bound to regulated by tau phosphorylation and open new perspectives on
molecular dysfunctions possibly involved in tauopathies, such as Alzheimer’s disease. Indeed, tau abnormal phosphorylation in these pathologies may have a direct effect on EB functions in neurons.
In conclusion, our work shows that tau directly antagonizes EB proteins through a phosphorylation-dependent mechanism, provid-ing a new model for the regulation of EB end-trackprovid-ing properties. Such a mechanism may represent an important way of regulation for microtubule dynamics and organization in neurons, where both types of protein are present and the importance of microtubules for the cell architecture is prominent.
MATERIALS AND METHODS
DNA constructs
We used the human tau isoform with one N-terminal insertion (N) and four microtubule-binding repeat (R) motifs (1N4R-tau, 412 amino acids; National Center for Biotechnology Information refer-ence sequrefer-ence NP_001116539.1) subcloned in the pDEST17 vector (kindly provided by N. Sergeant, Centre de Recherche Jean-Pierre Aubert, Lille, France). Deletion tau constructs were generated by a PCR-based strategy: 0R-tau, R1R′-tau, and P2R′-tau lack the Q244– K369 domain; the M1–Y168 and G372–L412 domains; and the M1– L243 and G372–L412 domains, respectively (amino acid numbers are given according to the longest 2N4R-tau isoform). Phosphomi-metic tau mutant was generated by PCR using the QuikChange II XL site directed-mutagenesis kit (Agilent Technologies, Santa Clara, CA) to exchange the serine 262 by a glutamic acid residue (the S262 site refers to the amino acid sequence of the 2N4R-tau isoform). Mouse EB1 and human EB1-NL-LZ, GFP-EB1, GFP-EB3, and GFP-EB3-NL-LZ plasmids were kindly provided by M. Steinmetz (Paul Scherrer Institut, Villigen, Switzerland). EB1-NL-LZ and GFP-EB3-NL-LZ correspond to the N-terminal domains of EB1
FIGURE 7: Model for the inhibitory activity of tau on EB tracking at microtubule ends. (A) In the absence of tau, EB1 binds to microtubule ends and exerts its intrinsic catastrophe-promoting activity. (B) The microtubule-binding domain (MTBD) of tau directly interacts with the C-terminal part of EB1. This interaction would hamper EB1 localization to microtubule ends through EB1 sequestration (i) and/or EB1 conformational changes (stars; ii). In these conditions, the catastrophe frequency decreases concomitantly with the apparition of rescues. (C) The phosphomimetic mutation S262E within tau MTBD impairs EB1/tau interaction and prevents tau-mediated inhibition of EB1 comets at microtubule ends. Microtubules are dynamic and undergo both catastrophes and rescues due to the opposing activities of EB1 and S262E-tau.
setup and laser intensity. Microtubule dynamic parameters were determined on kymographs using ImageJ software. Growing and shortening rates of microtubules were calculated from the slopes of individual growth or shrinkage phases. The catastrophe and res-cue frequencies were determined by dividing the total number of events by the time spent in growing and shrinking phases, respec-tively. For these two parameters, the SD corresponds to the rescue (or catastrophe) frequency divided by √n, where n is the number of the total observed events, assuming a Poisson distribution (Walker et al., 1988).
Cell culture, transfection, immunofluorescence, and image quantification
Mouse embryonic fibroblasts were prepared from embryonic day 14.5 embryos following standard procedures and cultured in DMEM and 1 g/l glucose with 10% fetal bovine serum. Transient transfec-tions were carried out with 3 μg of plasmid DNA per 35-mm dish using Lipofectamine LTX reagent (ThermoFisher Scientific) and ac-cording to the manufacturer’s protocol. After 24 h of transfection, cells were fixed by a 10-min incubation in methanol at −20°C. Immunofluorescence was performed using standard procedures. Fluorescence images were acquired with a Zeiss LSM 710 confocal microscope using a 63× oil-immersion objective (NA 1.4) and ZEN 2010 software (Carl Zeiss MicroImaging, Oberkochen, Germany). Acquisition settings were identical between all images for one set of experiments to allow quantifications and comparisons.
Quantification of EB1 comet densities was performed on regions of interest drawn around cell lamellipodia using a homemade macro on ImageJ software (Schneider et al., 2012). First, in order to calcu-late the microtubule network surface, a binary image was produced by applying a bandpass filter and automatic thresholding to the mi-crotubule channel. Second, to detect comets, the same procedure was applied to the EB1 channel. Comets located onto microtubules were recovered by multiplying the two binary images. The comet density was obtained by dividing the number of comets by the mi-crotubule network surface.
Length and fluorescence intensity of comets were quantified by drawing a line scan over a comet at microtubule end. At least 20 comets per cell were quantified, and the mean intensity was calculated by subtracting the background for each cell. Comet fluorescence intensities for at least five cells per condition were averaged and plotted against the distance from the microtubule plus end.
Statistics
All statistical analyses were done using Prism 6 (GraphPad Software, La Jolla, CA).
the beads was visualized on Coomassie-stained gels. Differences in tau and S262E-tau interaction with EB1 were quantified on immunoblots using ImageJ software (Schneider et al., 2012). For pull-down experiments comparing tau interaction with EB1-NL-LZ and EB1, EB proteins associated with magnetic beads were de-tected on Western blot using an anti-biotin antibody (1:2000) and anti-mouse EB1 (1:2000).
Microtubules/tau cosedimentation assays
To compare the proportion of tau and S262E-tau bound to mi-crotubules, microtubules were self-assembled in the presence of tau or S262E-tau proteins in K-BRB80 buffer supplemented with 1 mM GTP at 32°C and at a tau:tubulin molar ratio of 1:160 (40 μM tubulin dimers with 0.25 μM tau or S262E-tau). After 30 min of incubation, microtubules were centrifuged for 30 min at 230,000 × g and analyzed by SDS–PAGE. The amounts of tau bound to microtubules and of total polymerized tubulin were de-termined on immunoblots and Coomassie-stained gels, respec-tively. In the absence of microtubules, no tau was detected in the pellet.
TIRF microscopy, image analysis, and microtubule dynamics
Perfusion chambers were functionalized with silane-PEG-biotin (Laysanbio, Arab, AL) coverslips and silane-PEG (Creative PEG-work, Chapel Hill, NC) glass slides as described (Elie et al., 2015). The flow cell was perfused with NeutrAvidin (25 μg/ml in 1% bo-vine serum albumin [BSA]; ThermoFisher Scientific), PLL-g-PEG (2 kDa, 0.1 mg/ml in 10 mM 4-(2-hydroxyethyl)-1-piperazineethane-sulfonic acid, pH 7.4; Jenkem, Plano, TX), 1% BSA in BRB80, and GMPCPP-stabilized, ATTO-565–labeled microtubule seeds. Micro-tubules assembly was initiated with 12 μM tubulin (containing 30% ATTO 565–labeled tubulin) in the presence of various combina-tions of GFP-EBs and tau proteins in TIRF assay buffer (4 mM dithiothreitol, 1% BSA, 50 mM KCl, 1 mg/ml glucose, 70 μg/ml catalase, 580 μg/ml glucose oxidase, and 0.1% methylcellulose [4000 cP; Sigma-Aldrich, St. Louis, MO] in BRB80). For experi-ments with GFP-EB1, final concentrations of GFP-EB1 (monomers) and tau proteins (tau, R1R′-tau, and P2R′-tau) were fixed to 75 nM. The concentration of 0R-tau was increased to 500 nM since the deletion of the repeats drastically inhibits its microtubule-stabiliz-ing properties (Trinczek et al., 1995). For experiments with EB3-GFP and EB3-GFP-EB3-NL-LZ, we decreased the EB3-GFP-EB concentra-tion (monomers) to 10 nM to avoid extensive microtubule lattice binding of GFP-EB3-NL-LZ (Buey et al., 2011). Tau concentrations were fixed to 10 and 40 nM. Dual-color time-lapse imaging was performed on an inverted Eclipse Ti (Nikon, Melville, NY) micro-scope with an Apochromat 60×/1.49 numerical aperture (NA) oil immersion objective (Nikon) equipped with an ilas2 TIRF system (Roper Scientific, Evry, France) and a cooled charged-coupled de-vice camera (EMCCD Evolve 512; Photometrics, Tucson, AZ) and was controlled by the MetaMorph 7.7.5 software (Molecular De-vices, Sunnyvale, CA). For excitation, we used 491- and 561-nm lasers and performed time-lapse imaging at 1 frame per 2 s with an 80-ms exposure time.
All image analysis was done with ImageJ software and a home-made KymoTool. Comet fluorescence intensities were measured on the frames of the first 90 s of time-lapse movies using kymo-graphs with background subtraction (Maurer et al., 2011). The maximum fluorescence intensity at microtubule growing ends was measured in the green channel with a 5-pixel-wide line. Compari-sons of fluorescence intensities with and without tau proteins were calculated from experiments performed with the same acquisition
ACKNOWLEDGMENTS
We thank Nicolas Sergeant and Michel Steinmetz for providing us with human 4R-tau and GFP-EBs constructs. We thank Emilie Cou-riol and Ninon Zala for technical help for protein purification. This work was supported by the Institut National pour la Santé et la Re-cherche Médicale and the Centre National de la ReRe-cherche Scienti-fique joint ATIP-Avenir program and the Agence National pour la Recherche (Program MALZ 2011, Grant ANR-2011-MALZ-001-02). S.R.R. was supported by a postdoctoral fellowship from the Univer-sité Joseph Fourier and the Agence National pour la Recherche (Program MALZ 2011). E.P. was supported by a predoctoral fellow-ship from the Ministère de l’Enseignement et de la Recherche. A.V. was supported by France Alzheimer (AAP SM 2015).
Maurer SP, Bieling P, Cope J, Hoenger A, Surrey T (2011). GTPgammaS microtubules mimic the growing microtubule end structure recognized by end-binding proteins (EBs). Proc Natl Acad Sci USA 108, 3988–3993. Maurer SP, Fourniol FJ, Bohner G, Moores CA, Surrey T (2012). EBs
rec-ognize a nucleotide-dependent structural cap at growing microtubule ends. Cell 149, 371–382.
Mitchison T, Kirschner M (1984). Microtubule assembly nucleated by iso-lated centrosomes. Nature 312, 232–237.
Mukrasch MD, Bibow S, Korukottu J, Jeganathan S, Biernat J, Griesinger C, Mandelkow E, Zweckstetter M (2009). Structural polymorphism of 441-residue tau at single residue resolution. PLoS Biol 7, e34.
Mukrasch MD, von Bergen M, Biernat J, Fischer D, Griesinger C, Mandelkow E, Zweckstetter M (2007). The “jaws” of the tau-microtubule interaction. J Biol Chem 282, 12230–12239.
Panda D, Daijo JE, Jordan MA, Wilson L (1995). Kinetic stabilization of microtubule dynamics at steady state in vitro by substoichiomet-ric concentrations of tubulin-colchicine complex. Biochemistry 34, 9921–9929.
Panda D, Samuel JC, Massie M, Feinstein SC, Wilson L (2003). Differential regulation of microtubule dynamics by three- and four-repeat tau: impli-cations for the onset of neurodegenerative disease. Proc Natl Acad Sci USA 100, 9548–9553.
Sayas CL, Avila J (2014). Regulation of EB1/3 proteins by classical MAPs in neurons. Bioarchitecture 4, 1–5.
Sayas CL, Tortosa E, Bollati F, Ramirez-Rios S, Arnal I, Avila J (2015). Tau regulates the localization and function of End-binding proteins 1 and 3 in developing neuronal cells. J Neurochem 133, 653–667.
Schneider CA, Rasband WS, Eliceiri KW (2012). NIH Image to ImageJ: 25 years of image analysis. Nat Methods 9, 671–675.
Seubert P, Mawal-Dewan M, Barbour R, Jakes R, Goedert M, Johnson GV, Litersky JM, Schenk D, Lieberburg I, Trojanowski JQ, et al. (1995). Detection of phosphorylated Ser262 in fetal tau, adult tau, and paired helical filament tau. J Biol Chem 270, 18917–18922.
Skube SB, Chaverri JM, Goodson HV (2010). Effect of GFP tags on the local-ization of EB1 and EB1 fragments in vivo. Cytoskeleton 67, 1–12. Slep KC, Rogers SL, Elliott SL, Ohkura H, Kolodziej PA, Vale RD (2005).
Structural determinants for EB1-mediated recruitment of APC and spec-traplakins to the microtubule plus end. J Cell Biol 168, 587–598. Tortosa E, Galjart N, Avila J, Sayas CL (2013). MAP1B regulates microtubule
dynamics by sequestering EB1/3 in the cytosol of developing neuronal cells. EMBO J 32, 1293–1306.
Trinczek B, Biernat J, Baumann K, Mandelkow EM, Mandelkow E (1995). Domains of tau protein, differential phosphorylation, and dynamic insta-bility of microtubules. Mol Biol Cell 6, 1887–1902.
Velot L, Molina A, Rodrigues-Ferreira S, Nehlig A, Bouchet BP, Morel M, Leconte L, Serre L, Arnal I, Braguer D, et al. (2015). Negative regulation of EB1 turnover at microtubule plus ends by interaction with microtu-bule-associated protein ATIP3. Oncotarget 6, 43557–43570. Vitre B, Coquelle FM, Heichette C, Garnier C, Chretien D, Arnal I (2008).
EB1 regulates microtubule dynamics and tubulin sheet closure in vitro. Nat Cell Biol 10, 415–421.
Walker RA, O’Brien ET, Pryer NK, Soboeiro MF, Voter WA, Erickson HP, Salmon ED (1988). Dynamic instability of individual microtubules ana-lyzed by video light microscopy: rate constant and transition frequen-cies. J Cell Biol 107, 1437–1448.
Wehland J, Willingham MC (1983). A rat monoclonal antibody reacting specifically with the tyrosylated form of alpha-tubulin. II. Effects on cell movement, organization of microtubules, and interme-diate filaments, and arrangement of Golgi elements. J Cell Biol 97, 1476–1490.
Zanic M, Stear JH, Hyman AA, Howard J (2009). EB1 recognizes the nucleo-tide state of tubulin in the microtubule lattice. PLoS One 4, e7585. Zanic M, Widlund PO, Hyman AA, Howard J (2013). Synergy between
XMAP215 and EB1 increases microtubule growth rates to physiological levels. Nat Cell Biol 15, 688–693.
Zhang R, Alushin GM, Brown A, Nogales E (2015). Mechanistic origin of microtubule dynamic instability and its modulation by EB proteins. Cell 162, 849–859.
Zimniak T, Stengl K, Mechtler K, Westermann S (2009). Phosphoregulation of the budding yeast EB1 homologue Bim1p by Aurora/Ipl1p. J Cell Biol 186, 379–391.
REFERENCES
Ackmann M, Wiech H, Mandelkow E (2000). Nonsaturable binding indicates clustering of tau on the microtubule surface in a paired helical filament-like conformation. J Biol Chem 275, 30335–30343.
Akhmanova A, Steinmetz MO (2010). Microtubule +TIPs at a glance. J Cell Sci 123, 3415–3419.
Alonso AD, Di Clerico J, Li B, Corbo CP, Alaniz ME, Grundke-Iqbal I, Iqbal K (2010). Phosphorylation of tau at Thr212, Thr231, and Ser262 combined causes neurodegeneration. J Biol Chem 285, 30851–30860.
Amos LA, Schlieper D (2005). Microtubules and maps. Adv Protein Chem 71, 257–298.
Bieling P, Laan L, Schek H, Munteanu EL, Sandblad L, Dogterom M, Brunner D, Surrey T (2007). Reconstitution of a microtubule plus-end tracking system in vitro. Nature 450, 1100–1105.
Buee L, Bussiere T, Buee-Scherrer V, Delacourte A, Hof PR (2000). Tau pro-tein isoforms, phosphorylation and role in neurodegenerative disorders. Brain Res Brain Res Rev 33, 95–130.
Buey RM, Mohan R, Leslie K, Walzthoeni T, Missimer JH, Menzel A, Bjelic S, Bargsten K, Grigoriev I, Smal I, et al. (2011). Insights into EB1 structure and the role of its C-terminal domain for discriminating microtubule tips from the lattice. Mol Biol Cell 22, 2912–2923.
Choi MC, Raviv U, Miller HP, Gaylord MR, Kiris E, Ventimiglia D, Needleman DJ, Kim MW, Wilson L, Feinstein SC, et al. (2009). Human microtubule-associated-protein tau regulates the number of protofilaments in microtubules: a synchrotron x-ray scattering study. Biophys J 97, 519–527.
De Groot CO, Jelesarov I, Damberger FF, Bjelic S, Scharer MA, Bhavesh NS, Grigoriev I, Buey RM, Wuthrich K, Capitani G, et al. (2010). Molecular insights into mammalian end-binding protein heterodimerization. J Biol Chem 285, 5802–5814.
Desai A, Mitchison TJ (1997). Microtubule polymerization dynamics. Annu Rev Cell Dev Biol 13, 83–117.
Devred F, Douillard S, Briand C, Peyrot V (2002). First tau repeat domain binding to growing and taxol-stabilized microtubules, and serine 262 residue phosphorylation. FEBS Lett 523, 247–251.
Dixit R, Barnett B, Lazarus JE, Tokito M, Goldman YE, Holzbaur EL (2009). Microtubule plus-end tracking by CLIP-170 requires EB1. Proc Natl Acad Sci USA 106, 492–497.
Elie A, Prezel E, Guerin C, Denarier E, Ramirez-Rios S, Serre L, Andrieux A, Fourest-Lieuvin A, Blanchoin L, Arnal I (2015). Tau co-organizes dynamic microtubule and actin networks. Sci Rep 5, 9964.
Galjart N (2010). Plus-end-tracking proteins and their interactions at micro-tubule ends. Curr Biol 20, R528–R537.
Hayashi I, Ikura M (2003). Crystal structure of the amino-terminal microtu-bule-binding domain of end-binding protein 1 (EB1). J Biol Chem 278, 36430–36434.
Honnappa S, Gouveia SM, Weisbrich A, Damberger FF, Bhavesh NS, Jawhari H, Grigoriev I, van Rijssel FJ, Buey RM, Lawera A, et al. (2009). An EB1-binding motif acts as a microtubule tip localization signal. Cell 138, 366–376. Honnappa S, John CM, Kostrewa D, Winkler FK, Steinmetz MO (2005).
Structural insights into the EB1-APC interaction. EMBO J 24, 261–269. Hyman A, Drechsel D, Kellogg D, Salser S, Sawin K, Steffen P, Wordeman L, Mitchison T (1991). Preparation of modified tubulins. Methods Enzymol 196, 478–485.
Janning D, Igaev M, Sundermann F, Bruhmann J, Beutel O, Heinisch JJ, Bakota L, Piehler J, Junge W, Brandt R (2014). Single-molecule tracking of tau reveals fast kiss-and-hop interaction with microtubules in living neurons. Mol Biol Cell 25, 3541–3551.
Kapitein LC, Yau KW, Gouveia SM, van der Zwan WA, Wulf PS, Keijzer N, Demmers J, Jaworski J, Akhmanova A, Hoogenraad CC (2011). NMDA receptor activation suppresses microtubule growth and spine entry. J Neurosci 31, 8194–8209.
Kiris E, Ventimiglia D, Sargin ME, Gaylord MR, Altinok A, Rose K, Manjunath BS, Jordan MA, Wilson L, Feinstein SC (2011). Combinatorial Tau pseu-dophosphorylation: markedly different regulatory effects on microtubule assembly and dynamic instability than the sum of the individual parts. J Biol Chem 286, 14257–14270.
Komarova Y, De Groot CO, Grigoriev I, Gouveia SM, Munteanu EL, Schober JM, Honnappa S, Buey RM, Hoogenraad CC, Dogterom M, et al. (2009). Mammalian end binding proteins control persistent microtubule growth. J Cell Biol 184, 691–706.
Supplemental Materials
Molecular Biology of the Cell
Tau antagonizes EB tracking at microtubule ends through a
phosphorylation-dependent mechanism
Sacnicte Ramirez-Rios, Eric Denarier, Eléa Prezel, Angélique Vinit, Virginie Stoppin-Mellet,
François Devred, Pascale Barbier, Vincent Peyrot, Carmen Laura Sayas, Jesus Avila, Leticia
Peris, Annie Andrieux, Laurence Serre, Anne Fourest-Lieuvin and Isabelle Arnal
Supplemental Materials:
• Supplemental Figures
• Supplemental Movie Legends
• Supplemental Materials and Methods
tau EB1 MT tau EB1-KQ/EE MT + tau - + + + EB1 + - - + + MTs + + + + + -+ + + tau - + + + EB1-KQ/EE + - - + + MTs + + + + + -+ + SN P SN P SN P
A
B
C
D
** 0.0 0.4 0.8 1.2tau + buffer tau + EB1
tau / pelleted MT s ratio (a.u.) ** 0.0 0.4 0.8 1.2 tau + EB1-KQ/EE tau / pelleted MT s ratio (a.u.) tau + buffer SN P SN P SN P
Figure S1. EB1 affects microtubule-binding properties of tau. (A) A two-step
co-sedimentation assay was performed to analyse the effect of EB1 on tau-bound
microtubules. Taxol-stabilized microtubules (2 µM) were incubated with tau (1µM),
centrifuged to remove unbound tau and resuspended in either buffer alone (middle
panel) or in the presence of 20 µM EB1 (right panel). Microtubules were then
centrifuged again and the relative amounts of tau recovered with pelleted microtubules
were quantified. The left panel shows the control experiment without tau. MT,
microtubule; P, pellet; SN, supernatant. (B) Similar two-step co-sedimentation assay
as in (A) performed with EB1-KQ/EE, a mutated form of EB1 exhibiting impaired
microtubule-binding properties. (C) and (D) Quantifications of the ratios of tau to
microtubules recovered in the final pellets after incubation with buffer alone (tau +
buffer) or with either EB1 (tau + EB1 ) or EB1-KQ/EE (tau + EB1-KQ/EE). **p<0.01,
non-parametric Mann-Whitney U test comparison (n = 5 independent experiments).
Errors bars represent SEM.
EB1 tau MT MT EB1 EB1 tau MT MT EB1
B
A
Figure S2. EB1 relocates along tau-induced microtubule bundles in fibroblasts upon
high tau expression levels. (A) Mouse embryonic fibroblasts were transfected with
pEGFP-tau and stained for EGFP (tau, in gray), EB1 (red) and tubulin (MT, green). A
merged image with EB1 and microtubule staining is shown on the right. Images
include transfected and non-transfected cells in the same field. Arrowheads point to
EB1 relocated along microtubule bundles. Scale bar, 10 µm. (B) Higher magnification
of the tau-induced microtubule bundles in the transfected cell. Arrowheads point to
microtubules bundles along which EB1 is relocated. Scale bar, 10 µm.
B
A
EB1 EB1 - + - + Input Pull-down + + + -tau tau Wavelength (nm)Fluorescence Intensity (a.u.)
300 350 400 450 500 550 0 1e+7 2e+7 3e+7 FImax - FI328 nm1e +6 2e+6 3e+6 4e+6 00 2 4 6 8 10 12 14 [tau] (μM) a
Figure S3. EB1 directly interacts with tau. (A) Pull-down assay of tau and
biotinylated-EB1. (B) Representative plot of EB1/tau interaction monitored by
fluorescence. EB1 fluorescence emission quenching is followed upon tau addition (λ
exc = 295 nm). EB1 (6.3 µM) in BRB80 pH 6.74, 50 mM KCl, was mixed at 25 °C with
increasing tau concentrations from 0 (upper spectrum) to 14 µM (lower spectrum). The
bottom curve (a) represents the fluorescence spectrum of tau alone (9 µM), which is
almost flat due to the absence of tryptophan in the protein. The graph (inset) shows
the resulting titration plot as Fmax-F in function of total tau concentration from which
we found a value of Kd about 1.7 ± 1.1 µM. Circle symbols indicate the experimental
points (collected at 328 nm), and the solid line is the fitting curve obtained as
described in Supplemental Materials and Methods).
Pull-down Input EB1 - - + + - -tau + - + - + -+ tau-NN - - + - + EB1 tau
A
B
TRNN TNNNAQC
MT EB1 Merge EB1 + tau-NNNQ tau-NN tau-NNNQ tauProjection domain Microtubule-binding domain
P1 P2 R1 R2 R3 R4 R’
IATPRGAAPPGQKGQANATRIPAKTPPAPKTPPSS
Figure S4. Mutations of the putative SxIP EB1-binding motif of tau does not affect
tau/EB1 interaction and does not prevent tau-dependent inhibition of EB1
end-trac-king. (A) Tau contains in its proline-rich region P1 a linear Ser-x-Ile-Pro (SxIP) motif
(highlighted in yellow) flanking by basic residues (highlighted in blue). This motif
shares the characteristic features of EB1-binding sites found on several EBs partners
(Honnappa et al., 2009). The replacement of IP or flanking basic residues by Asn (N)
or Gln (Q) has been shown to abolish the interaction between EB1 and proteins that
contain this motif (Honnappa et al., 2009). (B) Pull-down assay of tau and tau-NN
(mutated on IP residues) with biotinylated-EB1. (C) Kymographs of microtubules
assembled in the presence of EB1 and tau NNNQ (mutated on xIP and adjacent
lysine). Horizontal and vertical scale bars, 5 µm and 60 s.
tau
tub
SN
SN
P
P
Tub + tau Tub + S262E-tau