HAL Id: tel-01178607
https://tel.archives-ouvertes.fr/tel-01178607
Submitted on 20 Jul 2015HAL is a multi-disciplinary open access archive for the deposit and dissemination of sci-entific research documents, whether they are pub-lished or not. The documents may come from teaching and research institutions in France or abroad, or from public or private research centers.
L’archive ouverte pluridisciplinaire HAL, est destinée au dépôt et à la diffusion de documents scientifiques de niveau recherche, publiés ou non, émanant des établissements d’enseignement et de recherche français ou étrangers, des laboratoires publics ou privés.
New concept of mass spectrometer based on arrays of
resonating nanostructures
Eric Sage
To cite this version:
Eric Sage. New concept of mass spectrometer based on arrays of resonating nanostructures. Other [cond-mat.other]. Université de Grenoble, 2013. English. �NNT : 2013GRENY045�. �tel-01178607�
Université Joseph Fourier / Université Pierre Mendès France / Université Stendhal / Université de Savoie / Grenoble INP
THÈSE
Pour obtenir le grade de
DOCTEUR DE L’UNIVERSITÉ DE GRENOBLE
Spécialité : Physique appliquéeArrêté ministériel : 7 août 2006
Présentée par
Eric SAGE
Thèse dirigée par Laurent DURAFFOURG codirigée par Sébastien HENTZ
préparée au sein du Laboratoire des composants microcapteurs (LCMC) du CEA/LETI-MINATEC dans l'École Doctorale de Physique - Grenoble
Nouveau concept de
spectromètre de masse à base
de réseaux de nanostructures
résonantes
Thèse soutenue publiquement le 13/12/13, devant le jury composé de :
M. Vincent BOUCHIAT
Professeur, UJF (Grenoble), Président
M. Bernard LEGRAND
Directeur de recherche, LAAS (Toulouse), Rapporteur
M. Jean-Claude TABET
Professeur émérite, UPMC (Paris VI), Rapporteur
M. Michael ROUKES
Professeur, CALTECH (Pasadena), Examinateur
M. Adrian BACHTOLD
Professeur, UAB (Barcelone), Examinateur
M. Christophe MASSELON
Chercheur HDR, CEA (Grenoble), Examinateur
M. Laurent DURAFFOURG
Chercheur HDR, CEA (Grenoble), Directeur de thèse
M. Sébastien HENTZ
3
A
CKNOWLEDGMENTS
Ces trois années de recherches où je me suis beaucoup investi furent particulièrement intenses avec leurs lots de déceptions et de frustrations mais également de succès inespérés et de bons moments. Ces derniers ont été rendus possibles grâce aux personnes que je souhaite saluer ici et qui ont su me tendre la main, me prodiguer de précieux conseils ou simplement me redonner le sourire dans les moments difficiles.
Je tiens en premier lieu à remercier Laurent Duraffourg pour m’avoir convaincu de postuler à ce sujet de thèse, d’avoir défendu avec vigueur l’aspect thèse de mon travail au sein du laboratoire et de m’avoir donné une grande liberté pour développer mon sujet tout en me fournissant les clés pour développer mes compétences de chercheur. J’ai particulièrement apprécié les visites à l’improviste qui débouchaient toujours sur des discussions intéressantes et je l’encourage à faire de même avec ses futurs doctorants. Je remercie également Sébastien Hentz pour son soutien irréprochable lors de moments critiques comme la rédaction du manuscrit, les répétitions de soutenance de thèse ou de conférences, etc. Malgré certaines irrémédiables divergences en termes de couleurs de courbe ou de série TV ( ), j’ai pris un réel plaisir à travailler à ses cotés et énormément appris en termes de rédaction de papiers scientifiques (entre autres). Je tiens également à exprimer ma gratitude envers Guillaume Jourdan, notre gourou officieux des thésards du laboratoire. En plus de nous faire exploser de rire avec ses plaisanteries, inattendues, dirons nous, il sait se rendre toujours disponible pour des conseils extrêmement techniques quelque soit sa charge de travail du moment. Et pour ce double soutien moral/scientifique indéfectible, il mérite notre respect et notre reconnaissance. Un énorme merci également à Eric Colinet pour m’avoir aiguillé avec succès sur le thème des réseaux de NEMS et pour son rôle de mentor lors de mon séjour à Caltech. Que ce soit pour ses précieux conseils techniques, son soutien moral ou son enthousiasme communicatif, sa présence a été déterminante pour un séjour fructueux et agréable. A vrai dire, mis à part les réussites scientifiques et autres relations que j’ai pu nouer sur place, cette rencontre se suffirait à elle-même pour justifier l’intérêt du séjour. Encore merci.
Lors des moments de découragements pendant la rédaction du manuscrit, il n’est pas rare de se demander si ce dernier va réellement être lu et intéresser quelqu’un. Je tiens à remercier le jury de thèse pour m’avoir prouvé que rien n’est plus faux. Leur intérêt pour mon travail et leur présence lors de ma soutenance m’honore. Je tire mon chapeau à Bernard Legrand pour son impressionnant travail de relecture, exhaustif et minutieux, qui m’a permis d’améliorer notablement la version finale du manuscrit. Que ce soit lors de l’IFCS 2013 à Prague, par téléphone ou lors de ma soutenance, j’ai toujours trouvé nos discussions particulièrement captivantes et j’espère sincèrement que nous aurons de nouvelles occasions de rencontres. Merci à Jean-Claude Tabet pour avoir accepté de rapporter une thèse en dehors de son domaine d’expertise, pour son intérêt et ses apports originaux. Je remercie également Vincent Bouchiat pour avoir accepté d’être président du jury, pour ses contributions sur l’aspect physique du travail et pour ses encouragements. Merci à Christophe Masselon pour
4
avoir suivi avec intérêt l’évolution de mes travaux et pour son aide sur les aspects spectrométrie de masse conventionnelle. I am honored to count Adrian Bachtold among my jury and thank him for his enthusiasm and his keen interest for this work. I am grateful as well to Michael Roukes for his presence at the defense, for following my progress throughout these years, as well as for welcoming me at Caltech for a period of 6 months. I learnt a lot there and I would like to salute Scott Kelber, Selim Hanay for including me in the NEMS-MS team and Peter Hung, Luis Guillermo Villanueva, J-S Moulet, Rassul Karabalin, Warren Fon, Su Naing and Hugues Metras for their help. I also send my warm regards to my campus buddies with whom I spent my time at ISP lunches, Cats’ parties and other social events: Jenny, Nicolas, Fabien, Allan, Manan, Bassam, Mark, Niko, Patrick, Bruno, Christine, Stephen, Jay, Hao, Yanan, Michel, Scott, Eric, John, Paraj, Utkarsh Vicky, Tom, Xavier, Matthieu etc. For that matter, I would like to thank the Fulbright commission for making this exchange possible.
La majorité de mon travail a consisté à étudier et manipuler des résonateurs NEMS en silicium et rien n’aurait donc été possible sans le travail de fabrication de Carine Marcoux et Cécilia Dupré. Je les remercie pour la qualité des dispositifs fournis mais surtout pour leur disponibilité, leur bonne humeur et leur aide, que ce soit pour comprendre les masques ou pour la formation à la microscopie à balayage électronique. Je salue Julien Arcamone qui m’a prodigué bien des conseils utiles en caractérisation électrique. J’ai eu également un grand plaisir à collaborer avec Christophe Leblanc et Nicolas Delorme (Asygn) et je salue leurs travaux sur les cartes d’acquisition électronique et sur la documentation associée qui m’ont permis d’obtenir une grande partie des mesures présentée dans cette thèse. Je voudrais également remercier infiniment Ariel Brenac et Robert Morel pour m’avoir accueilli à bras ouvert et m’avoir permis de modifier et utiliser leur banc de déposition de nanoparticules métalliques. La possibilité de mesurer la masse de particules uniques en temps réel a clairement été un tournant dans ma thèse en termes de résultats et j’ai pris un réel plaisir à faire de « la science qui tâche » en modifiant un bâti sous ultravide ou en manipulant du refroidissement à l’azote liquide. Ariel et moi avons formé un binôme particulièrement complémentaire, chacun ayant son propre domaine d’expertise, et je le remercie encore et encore d’avoir partagé avec moi une même volonté d’avancer et d’améliorer ce banc à chaque nouvel essai ainsi que mes horaires pas vraiment syndicaux. Je tiens de même à saluer Lucien, Céline, Jérémie et les autres membres de l’INAC qui m’ont immédiatement adopté en salle café et contribué à rendre ces journées de manip’ bien agréables.
Je remercie Philippe Robert pour m’avoir accueilli au sein de son laboratoire ainsi que tous mes compagnons de salle café : Pierre-Patrick, JPP, J-S, Audrey, Aude, François, Marie-Hélène, Brigitte, Fanny, Cathy, Jean-Louis, Nicolas, Sophie, Amy, Christine, Arnaud, Eric, Caroline, Marjolaine, Manu et bien d’autres avec qui j’ai eu le plaisir de partager café/chocolats/croissants/gateaux de Nicolas et des éclats de rire. Je n’oublierai pas les sorties de labo, pic-nic, laser-game, via-ferrata et autres activités où j’ai pu apprécier leur compagnie et je ne manquerai pas de venir les saluer à l’occasion. Je me dois quand même de faire une dédicace spéciale à Christine Courtois et ses pouvoirs magiques capables de faire disparaître le moindre de nos soucis administratifs. Bravo et merci !
5
Merci à Rémi Pérénon, ainsi que Pierre Grangeat, pour leurs apports sur le traitement Bayesien des données. Travailler avec Rémi a vraiment été plaisant. Je souhaite une bonne continuation à Olivier Martin et une excellente fin de thèse à Julien Philippe. Son inébranlable optimisme, sa bonne humeur, sa curieuse conception de la réservation d’équipement et ses talents cachés ont rendu ces longues heures passées en salle de caractérisation toute de suite plus sympathiques. Dans le même registre, je souhaite également bonne route à Alexandra Koumela et Gregory Arndt qui ont partagé avec moi la même quête de courbe de résonance (cette petite bosse là, à ton avis c’est une résonnance ou bien?). Merci à Kevin Benedetto pour avoir été particulièrement arrangeant avec la réservation d’équipement et les discussions techniques. Je souhaite bien du courage et le meilleur à Ludovic Laurent que j’ai eu la chance d’encadrer pour son stage de fin d’étude et à Thomas Alava qui est un grand bonhomme, oui oui, et avec qui j’ai eu plaisir à partager mes connaissances mais aussi de bonne pintes de Chouffe. Un grand merci à Thomas Bordy pour son aide prompt sur l’aspect bruit secteur. I am grateful to Ann-Katrin Stark for her thorough review of my MS introduction, allowing me to avoid the wrath of MS specialists!
Mes hommage aux potos de l’étage Bob, Toby, Alisée, Oliv’ et Croc pour leur potentiel infini de déconne. Je salue également mes ex collègues du LTPI dont Arnaud Pouydebasque, Sébastien Bolis, Patrice Jacquet, Claudine Bridoux, Damien Saint-Patrice, Sophie Verrun et Christophe Bouvier.
On en vient maintenant aux co-bureaux et affiliés! Je salue donc mes amis Jérémie Ruellan, Yannick Deimerly, Antoine Niel, Jareck Czarny, Rémi Dejaeger, Nils Rambal, Julie Abergel, J-S Moulet, Luca Leoncino et Sofiane Soulimane, Fabrice Terry. Je garde un souvenir nostalgique (ou pas ?) de nos débats sur des termes qu’il faut aller chercher sur wikipédia (ils comprendront), la naissante d’une idylle entre deux hommes, l’élevage de chats, les descriptions de vidéos du web, ou les mots fléchés force 1 de la salle café. Merci à Yannick de m’avoir supporté presque trois ans dans le même bureau, pour ses craquages après 18h, pour ses baskets fluo et ses fantastiques pulls à col roulés. Merci à Jérémie pour m’avoir tiré plus d’une fois d’un mauvais pas (saleté de Raymonde…) et d’avoir été mon acolyte au labo (cours, conf’, discussions « scientifiques »…) mais également en dehors (badminton, lan, bière…). Je salue au passage son amusante volonté de raisonner l’irraisonnable, surtout quand c’est cause perdue. Je pense que Nils et Rémi se sont déjà reconnus plus haut. Merci à Jarek pour sa bonne humeur, sa vodka, ses coupes de cheveux improbables et sa bogôssitude ! Merci à J-S pour ses « conseils de l’ancien » et ses briefings voyage qui feraient honte au Routard ! Merci à Fabrice pour faire baisser la moyenne d’âge et bonne route à Luca ! Merci à Julie pour sa distribution de shots de bonne humeur et son accueil 5 étoiles au « H6 » avec Matthieu et Polin. Ce fut formidable de partager joies et peine de cette aventure de trois ans avec vous tous et la solidarité de notre petit groupe m’a fait chaud au cœur et permis de tenir bon. Je salue aussi Henri Blanc pour ses révélations inattendues et distrayantes, ses sources d’informations originales et pour avoir alimenté bien des discussions de déjeuners.
Je considère que « l’épreuve » du doctorat n’est pas seulement scientifique mais également personnelle. Parfois, il faut y croire pour s’accrocher et voir la lumière au bout du long tunnel et ça, ce n’est pas possible sans le soutien des proches. Impossible donc d’oublier
6
la chaleureuse colloc’ du 50B avec Sim’ et Crazy Johny! Merci à eux pour les craquages, les soirées « limite », la tyrannie culinaire etc., bref le sentiment d’appartenir à une mini-tribu qui fait tout ensemble. Poi vorrei ringraziare tutta la “famiglia italiana”: Chiara, Lia, Giada, Vera, Ramona, Clio, Carlo, Gianni, Ricchi, Cus, Gan, Stefano e Lorenzo; per tutti i buoni momenti. So che sono stato fortunato di partecipare alla vita de la famiglia durante questi tre anni memorabile e spero che saremo reuniti molto presto. Grazie mille! L’élégance m’oblige malheureusement à mentionner mes compagnons de bistrot toujours qui supportent ma présence bon gré, mal gré, lors de toutes ces soirées, nouvel ans européens et autres voyages. C’est donc en me pinçant le nez que je salue Yvon qui décidément saura nous distraire jusqu’au bout, quelques fois (qui a dit litote ?) à ses dépends. Mais je retiens surtout son cœur en or et promis, si j’ai un chien il sera le parrain. Mes prières vont à Gouze1, notre unique prophète (même s’il est plusieurs), qui m’a montré bien des fois la lumière (celle qu’on voit avant de mourir) à l’aide de ses fameux « raccourcis » en montagne et tour d’hélico. Rien de tel que la peur de la mort pour oublier le stress de la rédaction ! Merci à Grunge pour m’avoir probablement inconsciemment sauvé la vie maintes fois. Merci à Mr Max, dit le Cat Killer, pour l’ensemble de son œuvre, sa mauvaise fois et pour avoir, avec succès, fait semblant de s’intéresser à ma thèse. Merci François pour nous fournir un support d’expression artistique (au marqueur indélébile) pour les fins de soirée et pour le sous-titrage en VC (version catalane). Pour ne choquer la sensibilité de personne je ne m’attarderai pas sur Yaaaaaaaaaan ! Bravo à Salah pour avoir su incarner à merveille le rôle du hispter. Quand à ‘Tonin, ce fut un honneur de faire un bout de route ensemble mais je suis bien obligé de révéler ce que tout le monde refuse de voir : tu es l’être le plus méchant que je connaisse. Mes vœux de bonheur à la petite famille de Valou et Céline qui s’agrandit de plus en plus ! A sa majorité, Sylvain sera obligé de lire ce manuscrit avant interrogation orale. Et bien sûr je n’oublie pas le reste de la fine équipe : Moskito, Peyro, Tinmar, Manue, Fanny, Simon et Bastoune.
Evidement, je ne serai jamais allé aussi loin dans mes études sans le soutien inconditionnel et l’amour de ma famille. Si je me sens fort aujourd’hui c’est grâce à vous, papa, maman, Sophie et Stéphane ; grâce à une enfance heureuse et des voyages qui m’ont donné le virus de la bougeotte, grâce à une éducation libérale qui m’a poussé vers la science et grâce à des valeurs qui me servent désormais de boussole pour le reste de mon court voyage sur cette planète…
Enfin, j’ai une tendre pensée pour celle qui a le courage de me supporter, me
réconforter et de m’accompagner dans mes pérégrinations autour du monde. Merci de faire de moi un homme chanceux ma petite Caroline.
1
Vigouroux et al. Proc. 30th Gocad Meeting, Nancy,2010
7
General introduction
Following the trend of downscaling in accordance with Moore’s law, the micro-electronics industry has been able to shrink CMOS-circuits with physical features down to tens of nanometers thanks to tremendous progress in micro and nano fabrication processes. Yet, downscaling has reached a physical limit implying important leakage currents for sub-10nm CMOS technology [1]. Hence a new trend, generally referred to as “More than Moore”, has emerged where focus is now on the integration of a multitude of functions on a silicon wafer: actuators, sensors, energy harvesting, light emission, photovoltaic cells etc… [2]. Integrating a sensor directly on a silicon wafer has many advantages as sensing cells fully integrated with their associated electronics suffer less from capacitive loss of electrical connections and their batch fabrication is far cheaper. As the micro-electronics industry has already developed a full set of fabrication and characterization tools, VLSI (Very Large Scale Integration) CMOS compatible design enables to imagine millions of micro/nano-sized devices easily coupled with appropriate electronics [3]–[5].
For that matter, Nano-Electro-Mechanical Systems (NEMS) form a new class of sensors that would greatly benefit from Very Large Scale Integration. NEMS devices are extremely interesting objects of study as their minute size makes them very sensitive to excessively small physical variations occurring at the micro and nanoscale. Hence, astute engineering of nanosized devices may provide a variety of exotic tools to sense the quantum world by measuring physical quantities such as force [6], [7], molecular weight [8], gas concentration [4], surface stress [9] or molecule shapes [10] that would be otherwise impossible to measure with traditional instruments. However, obstacles to real world implementations of NEMS have yet not been completely breached as their extremely reduced size, albeit being the source of their outstanding properties, makes them difficult to interface with the physical quantities to be measured. In addition, the small signals provided by these sensors are generally extremely attenuated by electrical connections before reaching conventional tabletop instruments. Therefore, integrating NEMS sensors directly with their electronic read-out would circumvent this issue and allow for dense areas of millions of sensors easily coupled with interfaces with the macro world such as gas capillaries, microfluidics etc.
In the past decade, there has been a growing interest in mass detection based on monitoring the resonance frequency variations of a nanomechanical resonator. As their sizes are reduced, nanomechanical resonators are increasingly sensitive to mass adsorption but also increasingly difficult to monitor as transducing mechanical motion at this scale can be challenging. However, tremendous effort in the design of efficient transduction means [11] and device shrinking has led to the demonstration of attogram resolution [12] (one attogram= ) down to yoctogram resolution [8] (one yoctogram= ). This extreme mass sensitivity enabled the measurement of golden mass standards such as the mass of gold atoms [13] or Xe atoms [14] using carbon nanotube devices (CNT). At this point, one could
8
wonder if resonant NEMS can be used for mass spectrometry applications and weigh individual particles of a complex mixture. But what could be the contribution of Nanomechanical Mass Spectrometry (NEMS-MS) to the mature field of Mass Spectrometry (MS)?
Mass Spectrometry is a universal technique to determine the chemical composition of a given substance. It is widely used in broad range of domains such as medicine, biology, material science, geology etc. The molecular weight of each compound composing the analyzed mixture is deduced from their mass-to-charge ratios (m/z): samples are vaporized and ionized into small charged particles that are separated by a mass analyzer using electromagnetic fields. An ion detector sends an electrical signal proportional in amplitude to the number of incoming charges for each m/z ratio and a so called “mass spectrum” is built by displaying the abundance with respect to m/z. Introduction of the ElectroSpray Ionization (ESI) source in the mid 1980s revolutionized the field of MS as it enabled the introduction of biomolecules in the gas phase without fragmentation (soft ionization) and with a large number of charge states [15], [16], lowering the molecules m/z to values falling in the mass range of common mass analyzers whose resolution drops beyond a few tens of kDa (one Dalton= ) [17]. This benefitted to the development of the field of proteomics. Proteomics is an emerging technique for the analysis of biomolecules: proteins, macroleculars complexes, viruses, bacterias etc. that relies on the weighing of intact molecules before structural analysis using successive fragmentation and MS steps. While the rapid growth of MS techniques and technologies offer now a broad range of instruments with outstanding mass resolution, most commercial MS equipments still have difficulties measuring particles over 100kDa (One Dalton = 1 Da = 1.660×10⁻²⁷ kg= 1 proton mass) because of the large required electromagnetic fields for ion acceleration and poor resolving power (ability to separate two different m/z peaks) at these mass ranges. MS of high mass molecules is thus extremely arduous, requiring the use of ultra high magnetic field FTICR mass spectrometer [18] or modification of common instruments at the cost of lower dynamic range and resolving power [19]. To date, the highest weighed mass is a 18MDa virus assembly provided extensive modification of a quadrupole time-of-flight instrument [20]. Before then, the record lied in the 200kDa range [21]. For higher mass ranges, technologies such as Surface Plasmon Resonance (SPR) [22] and Surface Accoustic Wave (SAW) or Bulk Acoustic Wave (BAW) [23] cover mass ranges of 1-100GDa (SPR) and 10-100TDa (SAW/BAW). Therefore the mass range 100kDa-1GDa remains an unmet challenge and cannot be routinely acquired with current instruments.
NEMS resonators, with their demonstrated close to Dalton resolution [8], have the potential to fill in this mass range and provide increasing resolving power with higher mass range whereas it decreases for conventional ion MS. Plus, they offer a wide dynamic range (up to GDa) and the unique ability to measure neutral particles, circumventing issues with low ionization yield or peak overlap caused by multi charge states [24]. However, the capture surface of a resonant NEMS is extremely low (~µm²), making detection of a large number of particles extremely difficult. To address this challenging issue, Caltech and CEA-Leti, in the framework of the Alliance for nanosystems VLSI [25], are pushing toward large scale
9
integration of top-down NEMS arrays for large capture surfaces and ultra-fast NEMS-MS measurements. A major milestone for the Alliance consisted in the first demonstration of single protein nanomechanical mass spectrometry in real time [26]. With a mass resolution around 100kDa, human antibodies (IgM) in the MDa range were successfully weighed one-by-one. However, given the difficulty to focus the ionized particles on the tiny NEMS surface, this generation of NEMS-MS bench is not adapted to measure high flux of particles and the resulting low event rate yields very high acquisition times (up to tens of hours). Plus, to date, NEMS-MS spectra have been acquired “blindly” insofar as no mass calibration of the sensors could be performed: their high mass operating range forbids using golden mass standards such as atom masses. Further progression toward a compact and robust ultra-fast MS system implies addressing several points:
- Deeper understanding of the mechanisms limiting our mass resolution to adapt future designs for targeted mass sensing applications.
- High throughput handling. Focalized and faster mass delivery in combination with ultra-fast event tracking ability is required for high event rate acquisitions.
- Larger capture surface. Large arrays of individually addressed resonant NEMS are necessary to enhance the mass event probability.
- Comparison of NEMS-MS with conventional ion-MS for calibration and validation of the technique.
The work described in the present manuscript proposes to address these issues. A first critical point lies in the phenomena limiting the mass resolution of our sensors that initiated a thorough study to determine our expected mass resolution and noise source identification. With the expected mass resolution in mind, we built a MS bench providing both NEMS-MS and conventional ion-MS with an ion source delivering particles comprised in a mass range overlapping on those of both NEMS-MS and ion-MS. In parallel, an electrical scheme and a post-processing algorithm were developed for fast event rate handling. After validation and calibration of NEMS-MS with a single device, instrument control and fast readout scheme were developed for arrays of individually addressed NEMS. Final validation of the concept of nanomechanical mass spectrometry based on resonant NEMS arrays was performed in our MS bench by confrontation with conventional ion-MS. This manuscript is organized as follows:
The first chapter provides an introduction on the subject with the background of the thesis, a brief description of conventional MS and the potential contribution of NEMS-MS to the MS field. A review of NEMS based mass sensing is presented, describing the race for lower mass resolutions and the emergence of single molecule NEMS-MS. Finally, the model of nanomechanical resonators, the scaling effects on their performances and the devices used in this work are described.
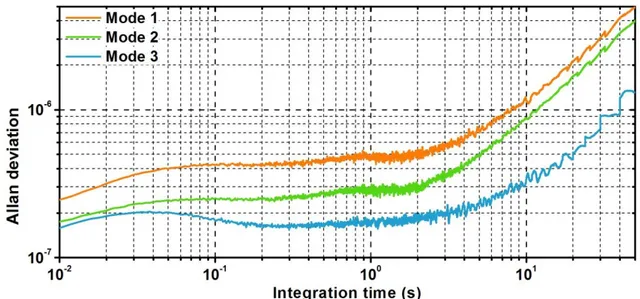
The second chapter covers the experimental study of the devices mass resolution, strongly dependent on the frequency stability of the resonant sensor. After explaining that
10
thermomechanical noise should be limiting our frequency stability, the expected frequency stability is computed before experimental verification. Using frequency stability characterization tools such as the Allan Deviation (ADEV) or the Power Spectral Density (PSD), we evidence the presence of a 1/f colored noise orders of magnitude more important that the expected white noise. Further investigations are carried out to identify the nature of this noise.
The third chapter covers the comparison of nanomechanical mass spectrometry with conventional ion-MS. After explanation of the motivation of this approach, we detail the electrical setup and post-processing algorithm developed to handle high mass event rates and build a NEMS-MS spectrum from multi-mode resonance acquisition on a doubly clamped beam. The MS bench delivering metallic nanoclusters measurable either by NEMS-MS, TOF-MS or with a QCM is presented before description of a mass sensitivity calibration procedure. Then, we provide the expected Limit of Detection (LOD) and mass resolution considering the experimental conditions and our post-processing algorithm. The experimental results that follow feature comparisons of spectra from both techniques supported by simulations, investigation of different mass ranges, weighing of multicharged particles and the first evidence of neutral particle nanomechanical mass spectrometry.
The fourth chapter addresses the capture cross-section issue and presents the principle of frequency-addressed NEMS arrays. The fabrication processes to build such arrays as well as their architecture is detailed. Then, we present the characterization results before proceeding to actual implementation of the frequency-addressing technique on a small array of cantilevers (20 devices). Potential applications in mass and gas sensing are demonstrated, either by considering the array as a single device averaging the contributions of individual devices or by tracking the frequency jumps induced by electrostatic force on all individual devices of the array. Signal averaging provides noise reduction by the square root of the number of devices in the array which is promising for gas sensing. On the other hand, successful detection of frequency jumps on all 20 devices with a 40ms response time is a first step toward NEMS-MS with arrays.
The fifth chapter exhibits the first proof-of-concept of an array of nanomechanical mass spectrometers. An array of 20 doubly-clamped arrays controlled with the frequency-addressing technique, developed in Chapter IV, is introduced in the MS bench built for the experiments of Chapter III. Aided with the tools developed in Chapter II for noise characterization, the optimal operating points (drive and polarization voltages) can be set. After collective mass sensitivity calibration, we demonstrate successful multi-mode monitoring of single particle deposition events on every individual device within the array. Mass spectra built from the contribution of all devices are compared with TOF-MS and with single NEMS-MS. Finally, we highlight the ability of our arrays of nanomechanical spectrometer to perform MS imaging by placing it at the rim the nanocluster beam, evidencing dissymmetry of the mass event rates along the array.
After a summary of the main contributions of this work, we conclude on future developments of NEMS-MS and its potential for biomolecules analysis.
11
B
IBLIOGRAPHY
[1] K. Roy, S. Mukhopadhyay, and H. Mahmoodi-meimand, “Leakage current mechanisms and leakage reduction techniques in deep-submicrometer CMOS circuits,” Proc. IEEE, vol. 91, no. 2, pp. 305–327, 2003.
[2] B. Vigna, “More than Moore: micro-machined products enable new applications and open new markets.,” in International Electron Device Meeting (IEDM), 2005, p. 8. [3] P. Andreucci, “Very Large Scale Integration (VLSI) of NEMS based on top down
approaches, Nanomechanics for NEMS : Scientific and technological issues,” in an
international state-of-the-art workshop by OMNT 26 & 27 June 2008, Grenoble-Minatec, France www.nanovlsi.org.
[4] J. Arcamone, A. Niel, V. Gouttenoire, M. Petitjean, N. David, R. Barattin, M. Matheron, F. Ricoul, T. Bordy, H. Blanc, J. Ruellan, D. Mercier, N. Pereira-Rodrigues, G. Costa, V. Agache, S. Hentz, J. Gabriel, F. Baleras, C. Marcoux, T. Ernst, L. Duraffourg, E. Colinet, E. B. Myers, M. L. Roukes, P. Andreucci, E. Ollier, and P. Puget, “VLSI silicon multi-gas analyzer coupling gas chromatography and NEMS detectors,” in International Electron
Devices Meeting (IEDM), 2011, pp. 29.3.1–29.3.4.
[5] I. Bargatin, E. B. Myers, J. S. Aldridge, C. Marcoux, P. Brianceau, L. Duraffourg, E. Colinet, S. Hentz, P. Andreucci, and M. L. Roukes, “Large-Scale Integration of
Nanoelectromechanical Systems for Gas Sensing Applications,” Nano Lett., vol. 12, pp. 1269–1274, 2012.
[6] G. Tosolini, L. G. Villanueva, F. Perez-Murano, and J. Baussels, “Fast on-wafer electrical, mechanical, and electromechanical characterization of piezoresistive cantilever force sensors,” Rev. Sci. Instrum., vol. 83, p. 015002, 2012.
[7] Z. Xiong, B. Walter, E. Mairiaux, M. Faucher, L. Buchaillot, and B. Legrand, “MEMS piezoresistive ring resonator for AFM imaging with pico-Newton force resoluation,” J.
Micromechanics Microengineering, vol. 23, p. 035016, 2013.
[8] J. Chaste, A. Eichler, J. Moser, G. Cballos, R. Rurali, and A. Bachtold, “A
nanomechanical mass sensor with yoctogram resolution,” Nat. Nanotechnol., vol. 7, pp. 301–304, 2012.
[9] J. Fritz, M. K. Baller, H. P. Lang, H. Rothuizen, P. Vettiger, E. Meyer, H.-J. Güntherodt, C. Greber, and J. K. Gimzewski, “Translating biomolecular recognition into
12
[10] B. Walter, E. Mairiaux, Z. Xiong, M. Faucher, L. Buchaillot, and B. Legrand, “DNA
ORIGAMI IMAGING WITH 10.9 MHZ AFM MEMS PROBES,” in Micro Electro Mechanical
Systems (MEMS), 2012, pp. 555–558.
[11] E. Mile, G. Jourdan, I. Bargatin, S. Labarthe, C. Marcoux, P. Andreucci, S. Hentz, C. Kharrat, E. Colinet, and L. Duraffourg, “In-plane nanoelectromechanical resonators based on silicon nanowire piezoresistive detection.,” Nanotechnology, vol. 21, no. 16, p. 165504, Apr. 2010.
[12] M. Li, H. X. Tang, and M. L. Roukes, “Ultra-sensitive NEMS-based cantilevers for sensing, scanned probe and very high-frequency applications.,” Nat. Nanotechnol., vol. 2, no. 2, pp. 114–20, Feb. 2007.
[13] K. Jensen, K. Kim, and A. Zettl, “An atomic-resolution nanomechanical mass sensor.,”
Nat. Nanotechnol., vol. 3, pp. 533–537, Sep. 2008.
[14] H.-Y. Chiu, P. Hung, H. W. C. Postma, and M. Bockrath, “Atomic-scale mass sensing using carbon nanotube resonators.,” Nano Lett., vol. 8, no. 12, pp. 4342–6, Dec. 2008. [15] J. B. Fenn, M. Mann, C. K. Meng, S. F. Wong, and C. M. Whitehouse, “Electrospray
Ionization for Mass Spectrometry of Large Biomolecules,” Science (80-. )., vol. 246, no. 4926, pp. 64–71, 1989.
[16] S. Banerjee and S. Mazumdar, “Electrospray ionization mass spectrometry: a
technique to access the information beyond the molecular weight of the analyte,” Int.
J. Anal. Chem., vol. 2012, no. Article ID 282574, p. 40 pages, 2012.
[17] D. H. Russell and R. D. Edmondson, “High-resolution Mass Spectrometry and Accurate Mass Measurements with Emphasis on the Characterization of Peptides and Proteins by Matrix-assisted Laser Desorption / Ionization Time-of-flight Mass Spectrometry,” J.
mass Spectrom., vol. 32, pp. 263–276, 1997.
[18] N. L. Kelleher, M. W. Senko, M. M. Siegel, and F. W. McLafferty, “Unit resolution mass spectra of 112 kDa molecules with 3 Da accuracy,” J. Am. Soc. Mass Spectrom., vol. 8, no. 4, pp. 380–383, 1997.
[19] R. H. H. Van den Heuvel, E. van Duijn, H. Mazon, S. Synowsky, K. Lorenzen, C. Versluis, S. J. J. Brouns, D. Langridge, J. van der Oost, J. Hoyes, and A. J. R. Heck, “Improving the Performance of a Quadrupole Time-of-Flight Instrument for macromolecualr Mass Spectrometry,” Anal. Chem., vol. 78, pp. 7473–7483, 2006.
[20] J. Snijder, R. J. Rose, D. Veesler, J. E. Johnson, and A. J. R. Heck, “Studying 18 Mda virus assemblies with native mass spectrometry,” Angew. Chemie, vol. 52, pp. 4020–4023, 2013.
[21] K. Breuker, M. Jin, X. Han, H. Jiang, and F. W. McLaffertey, “Top-down identification and characterization of biomolecules by mass spectrometry,” J. Am. Soc. Mass
13
[22] J. Homola, “Surface Plasmon Resonance Sensors for Detection of Chemical and Biological Species,” Chem. Rev., vol. 108, pp. 462–493, 2008.
[23] S. Fanget, S. Hentz, P. Puget, J. Arcamone, M. Matheron, E. Colinet, P. Andreucci, L. Duraffourg, E. Myers, and M. L. Roukes, “Gas sensors based on gravimetric
detection—A review,” Sensors Actuators B Chem., vol. 160, pp. 804–821, 2011. [24] E. van Duijn, “Current limitations in native mass spectrometry based structural
biology,” J. Am. Soc. Mass Spectrom., vol. 21, no. 6, pp. 971–978, 2010. [25] “http://www.nanovlsi.com/.” .
[26] M. S. Hanay, S. Kelber, A. K. Naik, D. Chi, S. Hentz, E. C. Bullard, E. Colinet, L.
Duraffourg, and M. L. Roukes, “Single protein nanomechanical mass spectrometry in real time,” Nat. Nanotechnol., vol. 7, pp. 602–608, 2012.
14
“It always seems impossible until it’s done”
15
Table of contents
Chapter I: Introduction ... 19
1. Background ... 19
2. NEMS-MS and Mass Spectrometry ... 21
2.1. Mass spectrometry: a diversity of techniques, a unique concept ... 21
2.2. Mass Spectrometry for life sciences ... 25
2.3. Bridging the gap with NEMS-MS ... 27
3. Review of NEMS-based mass sensing ... 29
3.1. NEMS mass sensing: from attogram to yoctogram resolutions ... 30
3.2. Emergence of single particle nanomechanical mass spectrometry ... 34
4. Mechanical resonators ... 37
4.1. Mechanical resonance of flexural beams ... 37
4.2. The driven harmonic oscillator model ... 41
5. Mass induced frequency shift of a single particle ... 43
5.1. Concept of resonant effective mass ... 43
5.2. Punctual mass addition ... 44
6. Resonator scaling effects for mass sensing ... 45
7. NEMS devices for mass sensing ... 47
7.1. Actuation ... 48
7.2. Motion transduction ... 49
7.3. Device used for mass sensing & characterization benches ... 53
8. Conclusion ... 55
Chapter II: Study of nanomechanical sensors mass
resolution……. ... 61
1. Theoretical nanomechanical mass sensing resolution ... 61
1.1. Expression of the mass resolution for resonant systems limited by additive white noise 61 1.2. Basic noise sources and effect on SNR ... 63
1.3. Thermomecanical noise measurement ... 65
16
2.1. Analytical tools ... 68
2.2. Allan deviation measurement protocol ... 71
2.3. Experimental results ... 73
3. Experimental investigation of the source of excess noise ... 80
3.1. Actuation & motion transduction ... 80
3.2. Phase or frequency noise? ... 81
3.3. Spatial correlation of MFN ... 85
3.4. Parameters impacting the MFN ... 87
3.5. Temperature ... 91
3.6. Excess noise facts and assumptions ... 92
4. Conclusion ... 93
Chapter III:
Comparison of nanomechanical mass
spectrometry with conventional ion MS ... 97
1. Motivation ... 97
2. Building a mass spectrum with a resonator ... 98
2.1. Resonator design ... 98
2.2. Single mode tracking ... 101
2.3. Multimode tracking ... 102
2.4. Fast and simple jump detection and quantification ... 105
2.5. Noise characterization ... 106
2.6. Denoising ... 107
2.7. Jump detection ... 108
2.8. Jump quantification ... 109
2.9. Mass and position computation ... 110
3. Experimental setup ... 112
4. Mass sensitivity calibration ... 117
5. Theoretical limit of detection and mass resolution ... 120
6. Mass spectra comparison ... 123
6.1. Experimental preparation ... 123
6.2. Preliminary results & simulations ... 124
6.3. Experimental mass range influence ... 130
6.4. Muticharged and neutral particles ... 132
17
Chapter IV:
Frequency-addressed NEMS
arrays………….. ... 141
1. Rationale of NEMS arrays ... 141
2. Principle of Frequency addressed NEMS arrays ... 143
3. Fabrication ... 147
4. Equivalent circuit ... 150
4.1. Impact of arrays of resistances ... 150
4.2. Impact of arrays on the output signal ... 151
4.3. Impact of arrays on noise ... 153
5. Characterizations ... 154
6. Frequency-addressing technique ... 158
7. Potential applications in mass and gas sensing ... 161
7.1. Gas sensing ... 161
7.2. Mass sensing ... 162
8. Conclusion ... 163
Chapter V:
Nanomechanical mass spectrometry with
arrays of resonant NEMS ... 167
1. Experimental design ... 167
2. Array characterization ... 168
3. Mass sensitivity calibration ... 171
4. Mass resolution and Limit Of Detection (LOD) ... 173
5. Building a mass spectrum with frequency-addressed NEMS arrays in multimode operation ... 175
6. Comparison of NEMS array-MS with TOF-MS ... 178
7. Mass spectrometry imaging ... 180
8. Conclusion ... 188
Conclusion & perspectives………...…191
Appendix A: Frequency noise for additive white noise limited resonant system……… 198
Appendix B: The Allan Deviation ...201
18
ACRONYMS
ADEV Allan deviation
APN Anomalous phase noise
BAW Bulk acoustic wave
CMOS Complementary metal-oxide-semiconductor
ESI Electrospray ionization
FTICR Fourier transform ion cyclotron resonance
FWHM Full width at half maximum
JPDF Joint probability density function
LIA Lock-in amplifier
LOD Limit of detection
MALDI Matrix-assisted laser adsorption/desorption
MFN Mechanical frequency noise
MS Mass spectrometry
NEMS Nano-electro-mechanical -system
NEMS-MS Nano-electro-mechanical –system mass spectrometry
PDF Probability density function
PLL Phase-locked loop
QCM Quartz microbalance
Q-TOF Quadrupole/time-of-flight
TOF-MS Time-of-flight mass spectrometry
SAW Surface acoustic wave
SBR Signal to background ratio
SNR Signal to noise ratio
SPR Surface Plasmon resonance
TEM Transmission electron microscopy
19
Chapter I: Introduction
1. Background
This thesis was performed in the framework of the Alliance for nanosystems VLSI [1], an alliance between the California Institute of Technology (Caltech) and Leti-Minatec. Caltech-KNI and Leti-Minatec have joined their expertise to transition from the era of "nanocraft" to very large-scale integration (VLSI) of nanosystems. Transitioning the recent advances from nanoscience into large-scale nanotechnology remains a largely unmet challenge worldwide. To date, very few beachheads have been attained in this domain, largely due to the monumental challenge of merging the separate methodologies of nanoscale bio/chemical sensor device fabrication with state-of-the-art, foundry-scale microelectronics processing. LETI/Minatec researchers are now collaborating with Caltech/KNI scientists to transform nanotechnology-based prototypes into robust, complex sensing systems. Caltech’s team, led by Prof. Roukes, is a pioneer in the nanoscale device field and has already demonstrated a wide range of NEMS based applications while Leti-Minatec researchers have developed NEMS VLSI tools including in particular electromechanical simulation and circuit design in order to predict the performances of NEMS embedded with their control electronics [2]. Moreover, a 200mm wafer, CMOS compatible, NEMS fabrication process is now available [3] and CEA-LETI is now able to massively produce NEMS devices (Fig. I.1).
Fig. I.1: Very Large Scale integration of NEMS on 200 mm wafer produced by LETI (Alliance for Nanosystems VLSI) . Each wafer corresponds to 3,000,000 NEMS devices comprising far more NEMS than the total created during the preceding ~15 years of this field.
The alliance is driven by three main thrusts, namely chemical sensing (gaseous phase), biochemical sensing (liquid phase) and mass spectrometry (vacuum). The work presented in this thesis is focused on NEMS based mass spectrometry and was essentially performed at CEA-Leti of Grenoble within the LETI/DCOS/SCMS/LCMC laboratory. Most electrical measurements were performed at the LETI/DCOS/S3D/LCFC laboratory in the M&NEMS characterization room while mass measurements were acquired in the nanocluster deposition bench of the DSM/INAC/SP2M/NM laboratory. In the framework of collaborative research within the alliance and thanks to a Fulbright scholarship, 6 months were spent at Caltech along with Prof. Roukes’ team for electrical characterizations and instrument control development for NEMS arrays and noise studies.
5 µm
500 nm 5 µm
160 nm thick
20
The work described in this thesis attempt to achieve three main objectives: - Study the current limitation on the device mass resolution
- Evaluate NEMS-MS by comparing it with traditional ion-MS
- Demonstrate the feasibility of NEMS-MS with frequency-addressed arrays
This work was carried out in continuity of Dr. Ervin Mile and Dr. Sébastien Labarthe’s doctoral research within the LCMC laboratory. They developed the NEMS resonator currently known as the “cross-beam” that achieves outstanding transduction efficiency [4] with a focus on design and simulation for Dr. Labarthe [5] and a focus on experimental characterizations for Dr. Mile [6]. For that matter, the author strongly encourages the reader willing to further broaden their knowledge on the device fundamental principles to read the oft cited thesis manuscripts as it will be evoked only briefly in this present document. Another building block essential to this work is the implementation of the nanosystem control loop performed during Chady Kharrat’s doctoral work [7]. By the time this document was written, my collaborators from Caltech Dr. Sélim Hanay and Dr. Scott Kelber have now defended their thesis that lay the base of NEMS-MS and whose reading is also warmly recommended. Dr. Hanay developed the multimode operation that is critical for NEMS-MS and performed NEMS-MS acquisition essentially with an Electro-Spray Ionization (ESI) source while Dr. Kelber built from a to z a complete bench of NEMS-MS coupled with a Matrix Assisted Laser Desorption/Ionization (MALDI).
The demonstration of the concept of nanomechanical mass spectrometry with resonant nanostructure arrays presented in this manuscript was carried out in parallel with the doctoral work of Julien Philippe, Olivier Martin and Rémi Pérénon with whom fruitful exchanges were developed. Rémi Pérénon implemented a bayesian approach to post-process NEMS-MS raw data with the aim of reducing the current mass resolution, automate frequency jumps detection and implement a robust algorithm for real time acquisitions [8]–[10]. Olivier Martin’s focus was on the design of cantilever arrays for gas sensing and on the simulation and design of the co-integrated control loop electronics to transition from tabletop controlled sensors to a fully wafer-level integrated sensing system. Julien Philippe is working on process integration toward a 3D co-integration of NEMS arrays enabling in situ amplification and addressing of a large number of devices.
Assembling the main building blocks constructed at Caltech and Leti-Minatec, the ambition is to obtain massively parallel NEMS arrays with thousands of devices for ultra-fast proteomics analysis.
21
2. NEMS-MS and Mass Spectrometry
2.1. Mass spectrometry: a diversity of techniques, a unique
concept
Mass spectrometry (MS) is a widely used technique in analytical laboratories and represents today the only universal technique for determining chemical composition. Initially conceived for isotopic composition determination, MS is used today in a great variety of domains such as medicine, biology, pharmacology organic and inorganic chemistry, electronic, material science, surface physics, environment, geology and nuclear sciences. For instance MS can be used for carbon dating or for the detection of pesticides traces. Even some satellites or spacecrafts are equipped with mass spectrometers to analyse encountered particles or perform specific analysis (the SOHO satellite uses a MS device to analyse solar winds). Actually, the rover Curiosity (controlled by the Jet Propulsion Laboratory on Caltech’s campus), currently in mission on Mars, embarks a Quadrupole Mass spectrometer (QMS) as well. Used in combination with a gas chromatograph, it analyzes the Martian atmosphere in search of evidence of the possibility of life. A broad range of commercial mass spectrometers exists based on diverse type of instruments. However, all rely on three basic components: First, samples are vaporised and ionized into small charged particles. Then, a so-called mass analyzer sorts these charged by-products according to their mass-to-charge ratios (m/z) by influencing their trajectory by using electromagnetic fields. And finally, a detector estimates the number of particles of different mass-to charge ratio (Fig. I.2). By comparing the obtained mass spectra to databases, it is then possible to determine the chemical structure of the analysed compound.
Fig. I.2: Particle separation is obtained according to the mass-to-charge ratio in a mass analyzer. The performance of a MS apparatus is defined by its ability to accurately deduce the actual mass of the molecule from m/z ratios and its ability to distinguish between ions differing in the quotient m/z by a small increment. We define here the resolving power as
where M is the measured mass [11]. ∆m is defined either with the peak width,
generally the Full Width at Half Maximum (FWHM), or the closest spacing of two peaks whose valley between them is at 10% or 50% of the smallest peak. We will use here the FWHM definition. Mass accuracy denotes the deviation between the measured mass and the actual value.
22
Ion sources
Despite the vast diversity of ion sources, mass analyzer and detectors that can be used to perform a MS analysis, the concept of separation according to m/z remains to date the golden rule of MS. Therefore, a crucial parameter of a MS system is the good ionization rate of the ion source as neutral molecules are simply not transmitted to the detector. The most popular ion sources for biomolecular MS are:
ElectroSpray Ionization (ESI)
ESI [12]–[14] is now a widely used ionization technique in which the sample, mixed with a solvent, is ejected from the tip of a capillary where a high voltage is applied. The charged droplets repel each other as a result of Coulombic force and form a supercharged cone shape (known as the Taylor cone) before being expelled in the evaporation chamber. As the solvent gradually evaporates and given the Coulombic repulsion, the droplets split up until single molecules are finally gathered at the outlet of the ion source (Fig. I.3 a). ESI is a source of choice for MS of large masses (>1kDa) as most molecules remain intact during the process, making ESI a soft ionization method. Plus, ESI is known to produce highly charged molecules leading to m/z ratios below the maximal measurable m/z of the mass analyzers. However, the multiple m/z peaks engendered by multiple charging can complicate analysis of heterogeneous samples.
Matrix Assisted Laser Desorption/Ionization (MALDI)
With the MALDI technique [15], the sample is embedded in a solid organic matrix and desorbed by a laser pulse. Vibrational excitation within the matrix cause local disintegration and ejection of analytes in the gas-phase (Fig. I.3 b). MALDI is considered as a soft ionization method as well and the localization of the sample desorption allows for MS imaging (a tissue section for example): a spatial mapping for different m/z levels can be generated. The main drawbacks of this technique are the matrix signal background that can be problematic for molecules below 700 Da and the molecule degradation relative to matrix interaction or photo-absorption [16]. MALDI produces far less multiple charged molecules than ESI yielding ions with higher m/z.
Fig. I.3: Schematic of the two most popular ion sources for biomolecule analysis, namely the ESI technique (a) using a highly charged capillary tip and MALDI (b) based on laser desorption.
23
Mass analyzers
Once they become ionized (negatively or positively), the molecules of interest are then transferred to a mass analyzer. Most commonly used techniques analyzers:
Time-Of-Flight (TOF)
In TOF-MS [17], [18], molecules are accelerated with a pulsed electromagnetic field before travelling across a drift zone where light (or highly charged) ions with high kinetic energy come out first while heavy ions (or with low number of charges) come out last. The time of arrival of ions colliding with the ion detector, usually of Micro Channel Plate (MCP), directly translates to a m/z ratio.
Fig. I.4: Schematic of the Time-of-Flight mass spectrometry principle. Accelerated ions have a different velocity depending on m/z: for a given charge state, lighter ions hit the MCP first while the heavy ones are detected last. Each ion count per time-of-flight can then be translated to m/z.
Quadrupole mass analyzer
A quadrupole mass analyzer [20] consists in four metallic rods connected in parallel with a DC and Radio Frequency (RF) source that act as a band-pass mass filter for ions travelling between the four rods. The RF field and DC offset are tuned to allow ions at a chosen m/z to be transmitted across the device while all other ions have unstable trajectories. A detector counts the number of ions passing though the mass filter while scanning the desired m/z range.
Fig. I.5: Schematic of the quadrupole mass analyzer. The applied RF field on the rods determines the m/z ratio allowed to travel across the mass filter.
The quadrupole may also be used in combination with different ion sources and/or mass analyzers as a mass filter to null out signal from undesired mass ranges or to select a specific molecule for tandem MS. Because of the different functions they provide and their low cost, quadrupoles are present in most tandem MS equipments.
24
Tandem Mass Spectrometry consists in combining multiple stage of mass spectrometry separated by fragmentation steps or ion selection for enhanced sensitivity or structural analysis. For instance, after a first m/z separation stage, one can select an ion of interest to enter a collision cell where the ion is fragmented before analysis of the byproducts. This may be done with a triple quadrupole mass spectrometer where the ions travel across three quadrupoles placed in series, each of which has a specific function. The first and the third, denoted as Q1 and Q3, operate in a “conventional’ mode i.e. by filtering m/z or scanning across the m/z range. The second one, Q2, operated in so-called RF-only mode that allows the transmission of a broad m/z range, and is used as a Collision-Induced Dissociation (CID) cell: ions are accelerated to higher kinetic energies in presence of a neutral gas generating collision events and ion fragmentation. By scanning Q1 mass range and selecting a given m/z on Q3, one can study which precursor ion is composed of the selected product ion. On the other hand, it is possible to select a precursor ion with Q1 and scan Q3 to analyze its product ions. Tandem MS has a broad range of applications and has become increasingly important in the domain of proteomics for life sciences.
Fourier Transform Ion Cyclotron Resonance (FTICR)
FTICR relies on the measurement of ions’ orbiting motion trapped in a magnetic field of an analyzer cell [19]. An RF field is applied to excite ions to higher cyclotron orbits and the current gathered at the ends of a capacitor during relaxation is analyzed by Fast Fourier Transform (FFT) to reveal the ions cyclotron frequency that depends on m/z (Fig. I.6).
Fig. I.6: Schematic of the FTICR mass spectrometry principle. Ions are trapped in an analyzer cell where they are set in orbital motion with a magnetic and RF electrostatic field. As the ions get closer to the top or bottom electrode of the detection plates, a current is generated at the cyclotron frequency. A FFT analysis enables to separate all cyclotron frequencies precisely and deduce the corresponding m/z spectra.
FTCIR is a very expensive system as it generally requires superconducting magnets. Nevertheless, FTICR offers outstanding resolving power with respect to the other techniques mentioned above.
25
Typical mass analyzers performances
The resolving power of MS instruments depends on the mass range of measurement, generally decreasing with higher mass ranges. For instance in the case of FTICR-MS, the resolving power decreases linearly with mass. We list in Table I.1 the typical mass range of operation and resolving power of common mass analyzers at 1000Da/charge [21]. Values are in m/z ratios.
Mass analyzer TOF Quadrupole FTICR
Mass range
Resolving Power
Table I.1: Typical mass range and resolving power of common mass analyzers
2.2. Mass Spectrometry for life sciences
Life sciences are devoted to the study of living organisms and the comprehension of the mechanisms governing their behaviors. This implies extensive study of life main building blocks that are DNA, RNA or proteins. Genes coded by the DNA are considered as the minimum level of biological information and contain all the instructions for the development and functioning of a living organism. Found in the nucleus of every cell, they provide the blueprint to the ribosomes for the synthesis of proteins. Today, the use of tools such as DNA microarrays combined with Polymerase Chain Reaction (PCR) allow easy identification of specific DNA strands and DNA sequencing can now be performed almost routinely [22]. Yet, DNA sequencing is not sufficient for extensive comprehension of biological phenomenon as many additional processes intervene during gene transcription and protein synthesis such as DNA methylation, gene silencing or Post-Translational Modification (PTM). The latter will determine the final shape of the protein and by extension its function. Indeed, the structural shape (at various levels) of a protein is essential for its function whether it defines chemical reaction sites for an enzymatic catalyzer, rigidity for a structural protein or the porosity of ion channel proteins. Therefore, there is a necessity to study these proteins in a state as close as possible to their native one.
The field of proteomics has been developed to study the structure and functions of proteins. While DNA sequencing consists in analyzing the genome of a cell, proteomics aims at defining its proteome i.e. identify the proteins contained in a cell. Proteomics is often synonym of protein Mass Spectrometry where the analysis relies on peptide or protein identification by their molecular weight. Protein complexes can be composed of several “subcomplexes” non convalently bound which are themselves formed by protein chains where each protein is a chain of peptide. Hence, a good understanding of proteins machinery requires the ability to probe the various levels of the pyramid of protein organization states [23] described in Fig. I.7.
26
Fig. I.7: Pyramid of protein organization states. There are various levels of protein organization which can be probed in proteomic analyses by means of MS. A protein complex may be
comprised of several subcomplexes, which themselves are composed of individual protein chains. Source: [23].
Mass Spectrometry for proteomics application can be divided in two categories: Bottom-up Proteomics and Top-down Proteomics. Bottom-up proteomics is the most mature technique and deals with the two lower levels of the pyramid. It relies on digestion of the protein into small protein fragments that are introduced into a MS instrument. Measured fragments are then matched against a DNA-predicted protein database. Some instruments feature tandem MS where a specific peptide can be isolated and fractioned into amino acids for peptide identification. Thousands of peptides are necessary to deduce the protein with a good confidence level which requires resolving powers of .While bottom-up proteomics has proven very reliable for rapid DNA-predicted protein identification in complex mixtures; it suffers from information loss caused by neutral fragments, does not provide any structural information and cannot evidence PTMs or mutations of the precursor molecule as the information is lost in the digestion [24]. Top-down Proteomics, on the other hand, deals with intact proteins and probes the upper two levels of the pyramid in Fig. I.7. It has emerged since the invention of soft ionization techniques such as ESI or MALDI allowing for introduction of large biomolecule complexes without covalent bond breaking. The high number of charges of molecules vaporized by ESI extended the mass range to tens of kDa as the ratios m/z could be lowered below the mass analyzers limits. However, dissociation from a liquid phase to a gas phase in an ESI solvent may denature the native state of the protein and modify its shape conformation because of the buffer solution used for ESI [25]. The proteins can be affected by several factors such as pH of the solution, concentration of non-volatile salts and fraction of organic solvents [26].
This motivated the development of native-MS that allows introduction of the proteins in their native or near-native states into the gas phase for MS analysis. The ESI solvent is generally aqueous, at physiological PH and appropriate ionic strength for minimum denaturation of the protein [26], [27]. Given the high mass ranges involved, mass analyzers are chosen amongst TOF, Q-TOF for tandem MS and FTICR. However, it is reported that quadrupoles have a maximum m/z of 4000 restricting ion selection for proteins below 60kDa [26], [27] while mass analyzers have trouble measuring proteins above 100kDa [28]. Van den
27
Heuvel et al. modified a Q-TOF to provide ion isolation up to 12800 m/z and detection up to 38150Da to extend the mass range for macromolecular MS at the cost of lower resolving power. Yet, the record of measured protein mass still lies within the 100kDa range: Han et al. measured the mycocerosic acid synthase (229kDa) by fragmenting the initial complex using prefolding dissociation (PFD) [29] while Karabacak et al. identified the Thyroglobulin (~670kDa) using funnel skimmer dissociation but reported no possible weighing of the entire complex [30]. Clearly, the effort put into instrumentation modification for higher mass ranges and molecule fragmenting strategies denote the importance of finding a solution for routine mass measurement above 100kDa.
Esther van Duijn reported the current limits in Native-MS [31]. Along with the difficulty of measuring weakly charged or large molecules, a concern is reported about peak splitting caused by the different molecule charge states that may overlap with those of another molecule. As the analysis point toward bigger macromolecules, fragmenting lead to extremely complex tandem MS spectra caused by multiple charge states. Yet, highly charged species are necessary for tandem MS as effective fragmentation is correlated with a high number of charges. Because of the asymmetric charge distribution upon dissociation, the initial macromolecular complex loses most of its charges after several fragmentations and the remaining structure simply cannot be studied. Therefore, a highly charged molecule ion is desirable but can be difficult to obtain for folded proteins structure: as injection of charges seems to essentially occur at the protein surface that presents possible chemical interaction sites, proteins introduced in the gas phase in their native states presents higher m/z ratios than their unfolded counterparts [23].
In summary, Top-down proteomics is limited by the finite mass ranges and decreasing mass resolution of current MS equipment above 100kDa, the requirement of highly charged particles and interpretation complexity of spectra from tandem MS. Some emerging technologies based on Surface Plasmon Resonance (SPR) [33] or Surface Accoustic Wave (SAW) or Bulk Acoustic Wave (BAW) [34] offer solutions in mass ranges of 1-100GDa (SPR) and 10-100TDa (SAW/BAW) but cannot be considered for MS of MDa proteins.
2.3. Bridging the gap with NEMS-MS
NEMS-based Mass Spectrometry (NEMS-MS) is a completely new paradigm that relies on direct mass measurements without ionization or separation. The inertial mass of molecules landing on a resonant nanostructure is deduced from the inferred frequency shifts generated by mass loading (Fig. I.8). While atomic resolution has been demonstrated [35], the upper mass range limit is set by the mass sensing linear range up to ~1GDa: NEMS-MS has the potential to fill in the current mass range gap.
Moreover, particles can be sent directly onto a large number of NEMS devices enabling parallel measurements.
28
Such a paradigm has tremendous potential advantages over conventional spectrometers:
- Highly simplified architecture (no ionization source, no analyzer)
- Much larger dynamic range: this system can detect particles as large as ~1GDa or more according to the device size and maintains the same masse resolution for all mass ranges, whereas conventional spectrometers show a resolution proportional to the detected mass
- Orders of magnitude improvement in yield; ionization yields in conventional techniques can be extremely low [36]. This system weighs any particle, ionized or not, landing on the surface of the NEMS.
- Possibility of massively parallel architectures with a large number of devices and interfacing with microfluidics
- Lower costs thanks to microfabrication and transportability
Fig. I.8: Working principle of a NEMS using electrostatic forces for actuation and piezoresistive nanowires for detection. An added mass on the nanobeam will be detected through the
resonance frequency shift.
Transitioning from the proof of principle experiment [37] to a robust, high-throughput system will require significant efforts in the following critical areas:
- Design and fabrication NEMS devices with optimum mass resolution (down to a few Dalton)
- Very Large scale integration of NEMS devices to develop NEMS arrays - Co-integration of NEMS devices with CMOS circuitry
- System architecture of these co-integrated device arrays with some pre-processing system and sample preparation.
Each of these efforts would enable realization of high throughput single molecule NEMS based mass spectrometry (MS) with unprecedented mass sensitivity. Each NEMS array device could process hundred of molecules per second. Thanks to their high integration capability, combining this very short time response with multiple parallel channels (up to
29
several thousands), high throughput analysis (for eg. millions of proteins in a few hundreds seconds) could be performed with NEMS-MS (Fig. I.9).
Fig. I.9: Single-Molecule NEMS-Mass Spectrometry on Chip. Microfluidics channel are used to spread analysed particles on a NEMS array for high throughput biological analysis. Courtesy of Michael Roukes.
Considering NEMS-based sensors for MS applications has been made possible thanks to great progress with their mass resolution as well as the use of several resonance modes.
3. Review of NEMS-based mass sensing
The fundamental principle of mass sensing with resonant nanostructures is based upon the observed frequency variation of a resonator following a mass adsorption upon its resonant surface. For an added mass that is significantly smaller than the total resonant mass and that does not induce any stiffness change, a linear relationship can be established between the frequency shift and the mass shift. A harmonic oscillator can be described by a simple model:
( I.1 )
where f is the resonance frequency, k the stiffness and M the resonant mass.
We now consider an addition of a minute mass along the resonator surface that does not affect the resonator’s stiffness. This leads to a frequency shift:
( I.2 )
30
( I.3 )
The relative frequency response of a resonator to the mass adsorption is therefore described as:
( I.4 )
The resonator mass sensitivity is defined as:
( I.5 )
Therefore, the resonator mass sensitivity increases with lower masses and higher frequencies. An accreted mass will be detected if the induced relative frequency shift steps out of the relative frequency fluctuations and the mass resolution is calculated for a one sigma deviation as:
( I.6 )
where is the deviation of the resonator relative frequency
The relative frequency fluctuation deviation depends on the measurement integration time and generally decreases with higher integration for a dominant white noise.
3.1. NEMS mass sensing: from attogram to yoctogram
resolutions
In the last decade, the potential extreme mass sensitivity of NEMS resonators has raised a growing interest in the NEMS/NEMS community and a race toward lower mass resolutions lead to successive demonstrations of resolutions of the order of the attogram [38], zeptogram [39]–[41] and more recently yoctogram [35]. Mass measurements are always performed in high vacuum for maximal device quality factor and minimum environmental pollution.
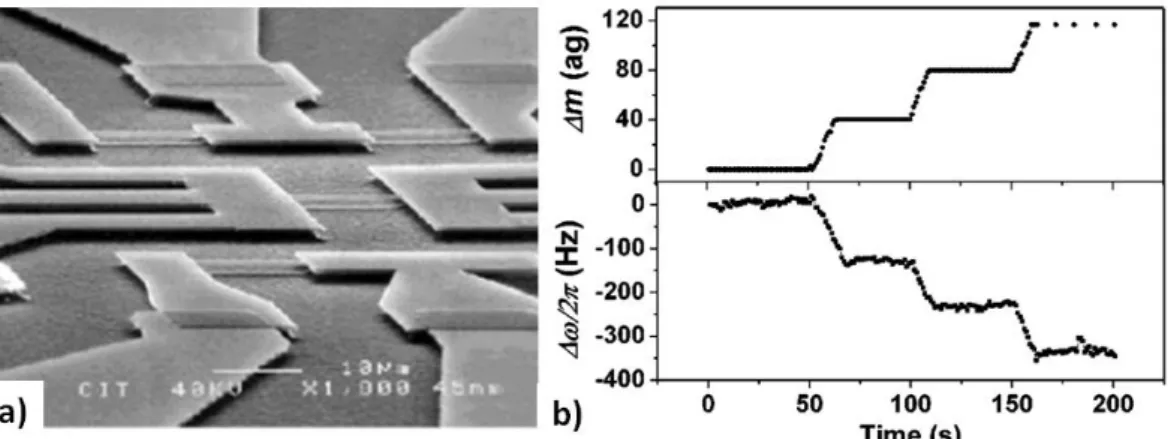
Prof. Roukes’ group is a pioneer in the domain of electromechanical systems and pushed forward lower mass resolutions with suspended doubly-clamped beams. In 2004, Ekinci et al. [38] exposed a doubly-clamped SiC resonator cooled at 17K under a flux of gold nanoparticles at successive time intervals and observed frequency shifts as shown in Fig. I.10.