HAL Id: halshs-00654524
https://halshs.archives-ouvertes.fr/halshs-00654524
Submitted on 22 Dec 2011HAL is a multi-disciplinary open access
archive for the deposit and dissemination of sci-entific research documents, whether they are pub-lished or not. The documents may come from
L’archive ouverte pluridisciplinaire HAL, est destinée au dépôt et à la diffusion de documents scientifiques de niveau recherche, publiés ou non, émanant des établissements d’enseignement et de
Mental maps of students - Volume 3
Clarisse Didelon, Sophie de Ruffray, Claude Grasland
To cite this version:
Clarisse Didelon, Sophie de Ruffray, Claude Grasland. Mental maps of students - Volume 3: Variations in the scale of the feeling of belonging. 2011. �halshs-00654524�
Cross Country Synthesis on Survey (deliverable 2.6)
Volume 3
Part 1—Variations in the scale of the feeling of belonging Clarisse DIDELON and Sophie de RUFFRAY (CNRS-UMR IDEES)
3
Variations in the scale of the feeling of belonging
This section of the report presents the analysis of the results obtained. Firstly, the variation in the general results for the whole sample is presented. Then the geographical variations of the feeling of belonging are analysed in detail at the levels of countries and places of survey. Once this spatial di-mension is controlled for, it is possible to examine individual factors such as gender, field of study, income. . . that were hidden behind the geographical variation. Finally, we explore the relation between the degree of feeling of belonging and the perception of the world by analysing the number of world regions drawn.
3.1 Theoretical definition and empirical measure of the de-gree of the feeling of belonging
3.1.1 Human territoriality and the concept of “man’s shell” The study of the feeling of belonging to a “piece of the Earth” (Bailly and Scariati, 1999[7]) is one axis of the geographic analysis and a relatively mod-est approach to the qumod-estion of identity. This feeling of belonging helps people to position themselves in the world and in society. It is a posture from which to perceive the world and explain it, and it should therefore be part of the study of the representation of the world. The analysis of rep-resentation is, to a large extent, based on the theory of “man’s shells” (“les coquilles de l’homme” in French) (Moles and Rohmer, 1974[78]), a series of circles organised around the individual that define the level of knowledge of different places: closer spaces are the best known. Among geographers analysing representation, the precursor is Lynch (1960[74]) who mainly fo-cused on the intra-urban scale before further works exploring smaller scales. It is the case of Gould and White (1974[50]) who established mental maps at the national level. In the 1970s and 1980s, Saarinen focused on mental maps at the world level and made many surveys at this scale (1987[92]). Its analyses were concentrated principally on the centring of mental maps. The researches that followed that work tried to demonstrate that there is a great diversity of points of view on the world, but also to stress the differences in knowledge of the world-space and to try to explain them (Saarinen and MacCabe, 1995[93], Pinheiro, 1998[82]).
This approach to global space through representations raises first some theoretical questions. Today, are the notion of “man’s shell” and the law of proxemics still relevant to analysing representations? Indeed, the contempo-rary accessibility of information through the media and even more through the Internet seems to disturb this scheme. As McLuhan stressed in the 1960’s (1967[77]), the new tools of communication lead to profound transformations in the human experience of the world. This new accessibility to information
and knowledge disrupts the approach of spatial cognition based on prox-emics. First, no longer can space remain unknown and, on a planet covered by “information highways”, nothing that happens in one part of the world can stay, at least potentially, unknown (Bauman, 2007[8]). If the knowl-edge of close spaces relies mainly on practice, the knowlknowl-edge of far spaces is today easier thanks to the different sources of numeric information. Hence the hierarchy of pieces of spatial or social information is relatively blurred, and global news is mixed with local news (Bailly and Scariati, 1999[7]). The traditional organisation of scale in space knowledge is thereby disturbed and therefore, the level of the feeling of belonging. Finally, the emergence of Web 2.0 in the last years has to be taken into account. Each Internet user is now a full information producer who transmits their world representation and feeds the flow of information “consumed” by other Internet users. The in-formation produced by Internet users contributes to build a world image, as shown by Crandall et al. (2009) in “Mapping the world’s photo”. Obviously, the knowledge of the world is imperfect and it is ruled by a factor of distance and of the “weight” of objects known. But we have to define both the type of distance and the type of weight (population, wealth, political influence, real or supposed nuisance capacity). The paradigm of “man’s shell” should be tested, and the main hypothesis to check is that a general knowledge about the world is now just as easy to obtain as a general knowledge about one’s country or even about one’s region. Therefore, if a region or a country is a territory, the world could be one too and so it constitutes one possible level of feeling of belonging. The cognitive effort is almost as important for knowing the global space as the world, and our ability to influence the global space (Moles and Rohmer, 1978[78]) does not seem much lower than our ability to influence the national space.
Globalisation raises other problems for the question of world representa-tion and of the feeling of belonging. The decreased influence of narepresenta-tions on the world-level organisation has been stressed many times. Indeed, globalisation leads to reconsidering many of the phenomena analysed in social sciences and one of them is precisely the nation-state. Many authors wonder about its future, including Appadurai (2001[4]), an anthropologist who uses the word “post-national” and suggests that the nation-state has become obsolete in that a new world order is emerging in which other forms of allegiances and identity can be observed. Because of different kinds of acculturation and assimilation between civilisations, because of the contemporary mixing of populations (Guermond, 2006[56]), a new possibility is the emergence of a global identity. This idea is explored by anthropologists and sociologists who develop new concepts such as “world-people”, “society-world”, or even “globality” (“mondialitÃľ ” in French). These concepts evoke the idea of the objective belonging to the same world, but more, they evoke the emergence of the consciousness of this feeling of belonging (Appadurai (2001[4]), Augé
(2006[6]), Bauman (2007[8])). According to them, this feeling would be co-extensive with the awareness that the Earth is spatially limited and of the fragility of life in front of global warming, the increase in disparities, and global terrorism. The sociologist Morin (2002[79]) justifies the existence of the “society-world” by the fact that it would have a territory: the world with its communication system which has reached a level unlike any in the past. In a geographical perspective, the question is reversed and, in recent years, some books and papers have evoked the question of the world-territory but rather in their conclusion. This is the case with Guermond (2006[56]), who wrote that we all know that, by necessity, we will inevitably move towards a sense of global identity. It is also the case with Grataloup (2008[53]), whose words are even more explicit, writing that one of the turning points of world history is that the world is becoming a territory. However, considering the world as a relevant scale for identity raises another problem: in many anal-yses, identity is conceived as a phenomenon that is built in opposition to the “others” (Ricoeur, 1990[85]). Then, to which “stranger” could we oppose ourselves when the global scale implies the whole of humanity (inasmuch as extraterrestrial life is not scientifically demonstrated, as is stressed, with humour, by some authors). In addition, when the identity question is raised at the global scale, it is more often linked to a double phenomenon. First, “deterritorialisation”, as economic globalisation, denies the relevance of the territory, and then occurs a “reterritorialisation”, as people, reacting to world flows of goods and capital, seek to reclaim their local roots and authenticity (Théry, 2007[107]).
As the feeling of belonging is an important part of the perception of the world, when analysing the mental representation of the world, it is relevant to deepen the question of the scale of the feeling of belonging. The Euro-BroadMap survey and sample was a great opportunity to describe the feeling of spatial belonging of a young generation of students, and more, to test the relation between the feeling of belonging and the perception of the world. Question A.13 has been included in our questionnaire on mental maps of the world to test the hypothesis of the relation between the level of the feeling of belonging and the representation of the world.
3.1.2 The question of “feeling of belonging” as proxy for “man’s shell”
Question A.13 of the EuroBroadMap survey was the following: A.13) What expression defines you best: “I belong to. . . t a town / city / village”
t a sub-national area” t a country or state”
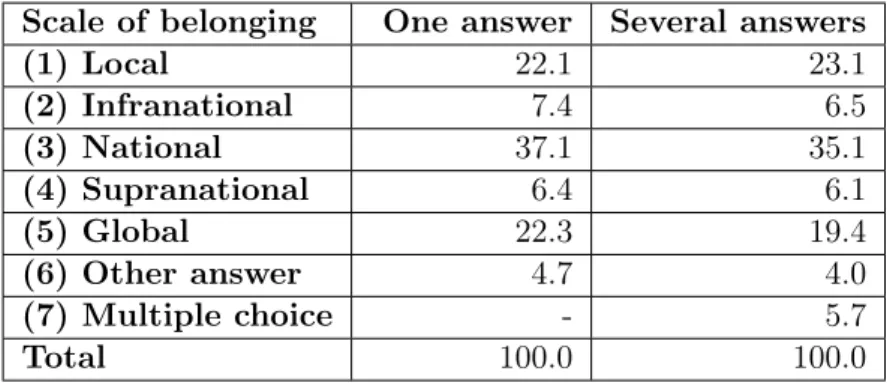
Figure 12: Frequency of answers to the question of scale of belonging Scale of belonging One answer Several answers
(1) Local 22.1 23.1 (2) Infranational 7.4 6.5 (3) National 37.1 35.1 (4) Supranational 6.4 6.1 (5) Global 22.3 19.4 (6) Other answer 4.7 4.0 (7) Multiple choice - 5.7 Total 100.0 100.0 t the world” t other”: . . . .
(If you have more than one answer, please rank them: 1, 2, 3, etc. You can give equal weight to more one choice.)
Students who answered the questionnaire had many solutions. They could provide only one answer or tick all the possible answers. In this case, they had to rank them. They also had the possibility of choosing the “other” answer and then to explain in a few words their choice. First we analyse the first rank quoted by students. A large majority of students surveyed (62%) provided only one answer to the scale of belonging question. However it is more interesting to analyse all the answers given as first rank because a larger number of students (98%) are concerned, and also because the repartition of answers between the different scale levels are quite similar (see Figure 12). The “local scale” is slightly more quoted when the 1st rank is studied than when the single answers are studied. We suggest the possibility that, when more than one answer is used, the students rank the answer and start at the local level. The distribution of answers shows general trends that are described below.
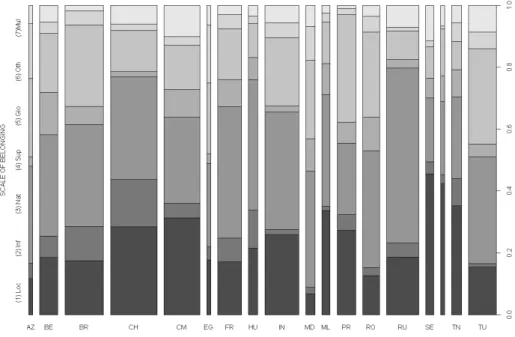
Before analysing the frequency of answers to each level, it is important to keep in mind that the EurobroadMap sample is not representative of the world population, and also that the reliability of the results is not the same in each country, since it depends on the number of places of survey and the number of students. The fact that only 98 answers were collected in Egypt means that the computation of percentages of answers is subject to more uncertainty than in China where 1198 answers were collected. This is why, in the histogram of frequencies of answer by countries, the width of the bars is not equal but proportional to the number of students that answered the question (Figure 14).
3.1.3 Overview of the distribution of answers by country
A majority of students quote the “national” level as the first level of belonging (35.1%). In thirteen countries (Azerbaijan, Belgium, Brazil, China, Egypt, France, Hungary, India, Moldova, Malta, Romania, Russia, and Turkey) among the eighteen of the sample, the national scale is the first quoted by the students. The frequency of answers varies between 35% (in Brazil) and 61% (in Russia). If the attachment to the national level is more expressed in Russia, it characterises also, to a certain extent, India, France, Hungary, and Moldova. Russia and India are very large countries with quite a long history. In both cases, the national construction is a recent problematic (Independence of India in 1947) or renewed (collapse of the Berlin wall in 1989), which is also the case for Eastern European countries. India and Russia have both strong wishes to assume a more important role at the international level, which is also the case with France. As a general figure in the sample, the attachment to the national level is quite coherent with the current organisation of the world into nation-states, and the weight which this political construction maintains, despite globalisation. Furthermore, in these nation-states, the information (on TV, newspapers, radio and even on the Internet) is mainly centred on national events. The school teaching is also mainly organised in a national perspective. History, geography, and literature are most often taught from a national perspective. Traditionally, one of the roles of the school is to instigate a feeling of national belonging in children. In the case of the countries of Eastern Europe (Hungary, Moldova, and Romania), it is coherent to privilege the national level because their independence is recent, only after the collapse of the Berlin wall.
The second most quoted answer as first rank is the local scale. 23.1% of the students of the general sample feel that the local scale is their first level of belonging. This answer is the most quoted in only four coun-tries of our sample. Three of them are African councoun-tries (Tunisia, Senegal, and Cameroon) and one is European: Sweden. It ranges from 34.8% in Cameroon to 51.4% in Senegal. Compared to the sample average, the feeling of belonging to the local level first characterises African countries (Senegal, Cameroon), but can also be observed in transition countries such as China or Tunisia or even in European countries such as Malta or Sweden. In those two countries, the small size correlated with the strong identity of cities where the survey has been done (Valletta and Stockholm), could explain this figure. A striking aspect of this analysis is that, among the four countries where the local level is the most quoted as first rank, the distribution of the following ranks are strictly similar: the national level comes as the second most quoted answer as first rank, and then the global level.
The third level quoted is the global scale and 19.4% of students from the general sample quoted it as the first level of belonging. In only one country from our sample did a majority of the students quote
the global level: Portugal (35.8% of the answers) (Figure 5). This is quite surprising and could be linked to the acknowledgement of the historical role of Portugal in the discovery of the first sea routes to India (Bartolomo Diaz reaching the Cape of Good Hope, Vasco da Gama reaching India), the first circumnavigation of Ferdinand Magellan (even if it was done under the Span-ish flag, Magellan was of Portuguese origin), and then in the age of discoveries that led to completing the knowledge of the world. However, another hy-pothesis to explain this figure could be a kind of lack of interest or even a certain level of disdain from Portuguese students toward the national level following the financial crisis that has affected Portugal for the last several years. In Portugal, the second most quoted level is the local (27.6%) and only in third position comes the national level (23.4%). Even if it is not at the first rank of answer, in some countries, a rather large proportion of the students claim first to belong to the world. Countries where students seem to be more “globalised” are mainly emerging countries, or countries in an in-between situation between two “continental” (Turkey, Egypt) or “na-tional” entities. As far as Belgium is concerned, one explanation could be the presence of a large number of students of foreign origin: when a student or their family has experienced spatial migration, the scale of the feeling of belonging is the largest.
The infra-national scale and the supranational scale are not very often the chosen answer (respectively 6.5% and 6.1%) for the first rank. The infra-national level is most quoted in countries where the provin-cial administrative level should have an importance in the spatial feeling of belonging (China, Hungary). The supranational level is never a part of the first three answers quoted in rank 1, even in the EU.
About 450 students (5% of the sample) provide an “other” an-swer (whether as a single anan-swer or not) and 78% of them rank this anan-swer as number one. More than 250 different words or expressions have been used but some of them can be grouped because of spelling mistakes, and the use of small words such as “a”, “the”, “to my”. For example, the expressions “a family”, “family” and “to my family” have been grouped under the expression “family”. Some semantic groupings can also be made. For example “Earth”, “Planet Earth” and “Earth planet” have been grouped under the same cate-gory “Earth”. Different names of countries or cities have been grouped under the category “country” or “city”. Finally, 156 different words and expres-sions can be analysed. Even after grouping, few of them are frequently used and we built 16 large categories in order to analyse this vocabulary. The largest part of the vocabulary used refers to social facts (36.8%). The cat-egory covering all words related to “family” and “parents” seems to be the category in which the words are more frequently used (12.8%). Another important category is the one grouping religious terms (name of religions, “God”, “Christendom”) which gathers 12.3% of the students choosing to use
their own words to describe their religious feeling of belonging. This also includes ethnic groups, cultural groups, or other kinds of groups and com-munities such as the football or volleyball clubs that are sometimes quoted. Then, a significant part of the vocabulary refers to a spatial fact (24%) which is often very close to the categories proposed in the question but that are more detailed. For example we find names of cities (Delhi, Izmir), names of infra-national regions (0.9%) (Rio Grande do Sul), names of countries or nations (7.7%) (Cameroon citizen, Kurdistan), names of supranational re-gions (Europe, European Union, Indian subcontinent) and a large part of the vocabulary used refers explicitly to the world level using mainly two expres-sions (Earth, 4% ; Humanity, 2.2%) plus other expresexpres-sions such as “global village”, “world”. Yet, it is possible that the students did not understand well the question or, maybe, they wanted to make precise the name of the local, national, regional level to which they feel they belong. The next categories are more specific and include few students. The next type of vocabulary that is often used refers to the student themselves as an individual (12.1%): “Myself” and “Me” are quite often used (respectively 5.5% and 3.7%). Then comes a supra-world level with reference to the universe and to the galaxy (10.1%). Finally, 3.5% of the students using the other category would like to deny any kind of belonging, with “nowhere” and “nothing” most often used, but also expressions such as “Don’t feel a sense of belonging” or “I don’t be-long.” A last category groups an important (12%) but heterogeneous number of words that are difficult to include in any category such as “cloud 9” (sic), “nature”, “panoramic region view” or “parallel dimension”.
About 500 students (5% of the sample) provide multiple an-swers for the first rank of scale of belonging. These students ap-parently assumed that it was not possible to provide an order between the various scales. 353 of them proposed two answers, 95 proposed three answers, and 49 indicated four to six answers. As in the case of “other” answers, we consider this type of answer as something interesting that should be kept and not eliminated. In further analysis, we will consider “multiple answers” as a specific attitude and not try to examine in detail which combination of scales of belonging are introduced by the students. It is nevertheless interesting to examine what are the most frequent combinations of answers, which can be easily done in the specific case of the 353 students that proposed exactly two answers. We can observe that the most frequent combination is “National + Local” (123), followed by “National + Global” (40) and “National + Supra-national” (37). Multiple choices for the first rank appear to be therefore mainly associated to a national choice balanced by a larger or smaller scale. The combination of opposite scales such as “Global + Local” is exceptional (17 cases).
Figure 13: Association of answers for the scale of belonging (1) Loc (2) Inf (3) Nat (4) Sup (5) Glo (6) Oth Total
(1) Loc 0 24 123 10 24 11 192 (2) Inf 24 0 28 4 7 2 65 (3) Nat 123 28 0 37 40 11 239 (4) Sup 10 4 37 0 11 4 66 (5) Glo 24 7 40 11 0 17 99 (6) Oth 11 2 11 4 17 0 45 Total 192 65 239 66 99 45 706
3.2 International and intra-national variations of the scale of belonging
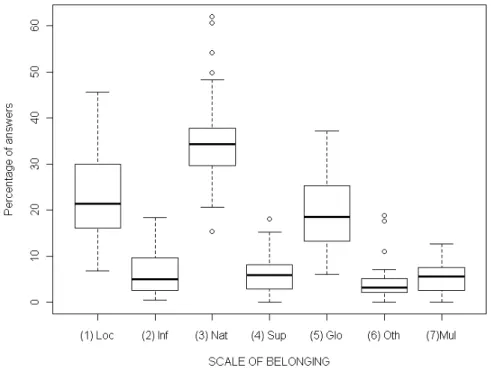
In the previous section, we focused our comments on the differences between countries. But we mentioned that this comparison should be done very cau-tiously because the samples are very different from one country to another. In this section, we try to analyse the variations of answers at the level of the 42 places of survey because important variations can be observed in each country. The places of survey are comparable in terms of sample size (200–240 students) and provide therefore more accurate statistics concern-ing the dispersion of answers (Figure 15). The countries where the survey was realised in various places are crucial because they make it possible to analyse whether internal variations of scale of the feeling of belonging inside countries are more or less important than between countries.
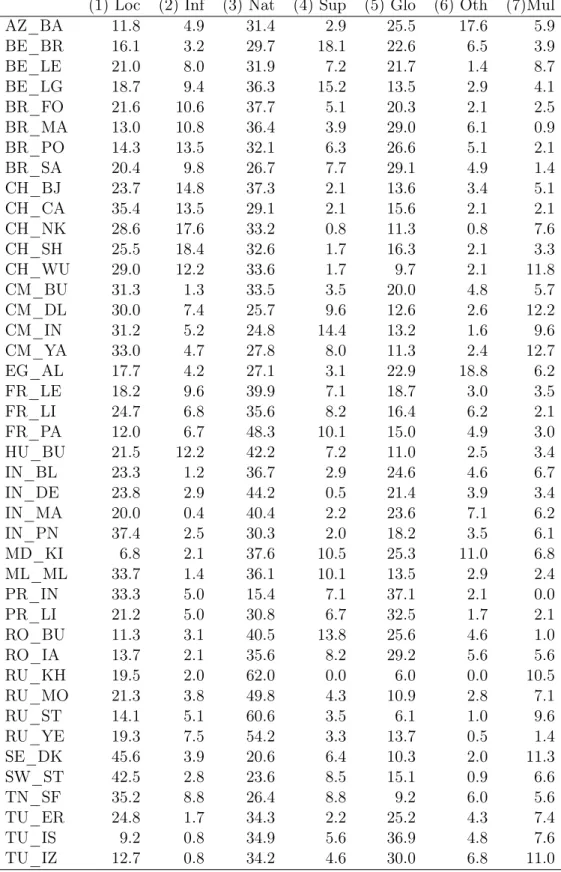
Table 1: Scale of belonging by place of survey
(1) Loc (2) Inf (3) Nat (4) Sup (5) Glo (6) Oth (7)Mul
AZ_BA 11.8 4.9 31.4 2.9 25.5 17.6 5.9 BE_BR 16.1 3.2 29.7 18.1 22.6 6.5 3.9 BE_LE 21.0 8.0 31.9 7.2 21.7 1.4 8.7 BE_LG 18.7 9.4 36.3 15.2 13.5 2.9 4.1 BR_FO 21.6 10.6 37.7 5.1 20.3 2.1 2.5 BR_MA 13.0 10.8 36.4 3.9 29.0 6.1 0.9 BR_PO 14.3 13.5 32.1 6.3 26.6 5.1 2.1 BR_SA 20.4 9.8 26.7 7.7 29.1 4.9 1.4 CH_BJ 23.7 14.8 37.3 2.1 13.6 3.4 5.1 CH_CA 35.4 13.5 29.1 2.1 15.6 2.1 2.1 CH_NK 28.6 17.6 33.2 0.8 11.3 0.8 7.6 CH_SH 25.5 18.4 32.6 1.7 16.3 2.1 3.3 CH_WU 29.0 12.2 33.6 1.7 9.7 2.1 11.8 CM_BU 31.3 1.3 33.5 3.5 20.0 4.8 5.7 CM_DL 30.0 7.4 25.7 9.6 12.6 2.6 12.2 CM_IN 31.2 5.2 24.8 14.4 13.2 1.6 9.6 CM_YA 33.0 4.7 27.8 8.0 11.3 2.4 12.7 EG_AL 17.7 4.2 27.1 3.1 22.9 18.8 6.2 FR_LE 18.2 9.6 39.9 7.1 18.7 3.0 3.5 FR_LI 24.7 6.8 35.6 8.2 16.4 6.2 2.1 FR_PA 12.0 6.7 48.3 10.1 15.0 4.9 3.0 HU_BU 21.5 12.2 42.2 7.2 11.0 2.5 3.4 IN_BL 23.3 1.2 36.7 2.9 24.6 4.6 6.7 IN_DE 23.8 2.9 44.2 0.5 21.4 3.9 3.4 IN_MA 20.0 0.4 40.4 2.2 23.6 7.1 6.2 IN_PN 37.4 2.5 30.3 2.0 18.2 3.5 6.1 MD_KI 6.8 2.1 37.6 10.5 25.3 11.0 6.8 ML_ML 33.7 1.4 36.1 10.1 13.5 2.9 2.4 PR_IN 33.3 5.0 15.4 7.1 37.1 2.1 0.0 PR_LI 21.2 5.0 30.8 6.7 32.5 1.7 2.1 RO_BU 11.3 3.1 40.5 13.8 25.6 4.6 1.0 RO_IA 13.7 2.1 35.6 8.2 29.2 5.6 5.6 RU_KH 19.5 2.0 62.0 0.0 6.0 0.0 10.5 RU_MO 21.3 3.8 49.8 4.3 10.9 2.8 7.1 RU_ST 14.1 5.1 60.6 3.5 6.1 1.0 9.6 RU_YE 19.3 7.5 54.2 3.3 13.7 0.5 1.4 SE_DK 45.6 3.9 20.6 6.4 10.3 2.0 11.3 SW_ST 42.5 2.8 23.6 8.5 15.1 0.9 6.6 TN_SF 35.2 8.8 26.4 8.8 9.2 6.0 5.6 TU_ER 24.8 1.7 34.3 2.2 25.2 4.3 7.4 TU_IS 9.2 0.8 34.9 5.6 36.9 4.8 7.6 TU_IZ 12.7 0.8 34.2 4.6 30.0 6.8 11.0
The proportion of answers is indicated for each place of survey as a percent-age of the students (the sum of the lines equals 100%)
Figure 15: Variation of scale of belonging
Figure 17 presents the variation of frequency between the 42 places of survey.
3.2.1 Three main oppositions
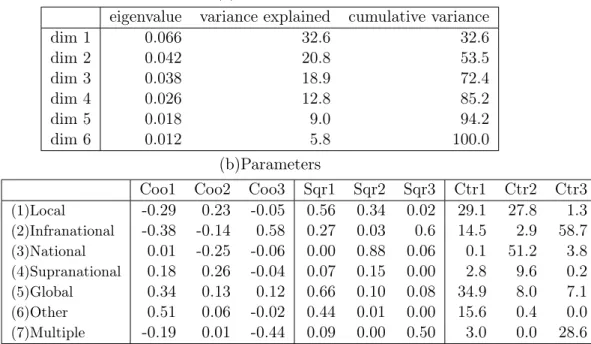
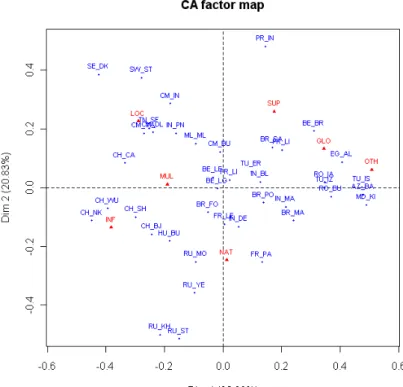
In order to summarise the main components of scale of belonging, we have applied correspondence analysis to the table crossing the 42 places of survey and the seven possible answers. The analysis reveals the existence of three major components that summarise 72% of the total variance.
The first component (32.6% of variance) can be defined as a measure of Global/Local opposition between students. The places of the survey with positive coordinates mentioned more often than usual the world as the first scale of belonging, and also introduced more often than usual the “other” and “supranational” answers. They have mentioned less often than usual the local or infra-national scales. This situation of global preference is typical of countries located in the southeastern part of Europe (Romania, Moldova, Turkey, Azerbaijan, Egypt) and can also be observed in Brussels. The places of survey with negative coordinates define the opposite situation with a preference for local and infra-national scales of belonging. They mentioned less often than usual the global or supranational scales. This
Figure 16: Correspondence analysis of scale of belonging by places (a) Eigenvalues
eigenvalue variance explained cumulative variance
dim 1 0.066 32.6 32.6 dim 2 0.042 20.8 53.5 dim 3 0.038 18.9 72.4 dim 4 0.026 12.8 85.2 dim 5 0.018 9.0 94.2 dim 6 0.012 5.8 100.0 (b)Parameters
Coo1 Coo2 Coo3 Sqr1 Sqr2 Sqr3 Ctr1 Ctr2 Ctr3
(1)Local -0.29 0.23 -0.05 0.56 0.34 0.02 29.1 27.8 1.3 (2)Infranational -0.38 -0.14 0.58 0.27 0.03 0.6 14.5 2.9 58.7 (3)National 0.01 -0.25 -0.06 0.00 0.88 0.06 0.1 51.2 3.8 (4)Supranational 0.18 0.26 -0.04 0.07 0.15 0.00 2.8 9.6 0.2 (5)Global 0.34 0.13 0.12 0.66 0.10 0.08 34.9 8.0 7.1 (6)Other 0.51 0.06 -0.02 0.44 0.01 0.00 15.6 0.4 0.0 (7)Multiple -0.19 0.01 -0.44 0.09 0.00 0.50 3.0 0.0 28.6
preference for local scales is typically observed in the most remote countries, in particular China, Russia, Senegal or Cameroon. This situation is also observed in Sfax (Tunisia), Malta and Stockholm (Sweden).
The second component (20.8% of variance) can be defined as a measure of National/Postnational preference of students. All things being equal with their global awareness, the students can mention more or less the national level or, eventually, the infra-national against all the other levels, in particular the global and local. The negative coordinates on dimension 2 reveal that the most important national preferences appear in Russia, but also to a lesser degree in China, France, Hungary, and Brazil (except Sao Paulo). On the contrary, very low levels of national preferences are observed in Portugal, Senegal, Cameroon, Sweden, Malta, Tunisia, and Brussels.
The third component (18.9% of variance) can be defined as a measure of residual effects. This situation is indeed related to the fact that students from some countries have used more than usual the criteria “infra-national”. This situation is typically observed in China and Brazil, es-pecially in places of the survey that are considered—or consider themselves— as “original” in their national system (Shanghai in China, Porto Alegre in Brazil). But this third component is difficult to analyse as it is also related on the opposite side to the use of multiple choices in first rank, which is
typical from places of survey located in Russia or Cameroon.
It is therefore more relevant to summarise the discoveries with the combi-nation of the two first components that provides a good view of the situation of scales of belonging according to the Global/Local and National/Postnational dimensions (Figure 15). The central part of the diagram defines a kind of “medium situation” which is typically observed in India, Brazil, Belgium, and France. Around this medium situation, we can easily identify the specificities of each place of survey and appreciate the differences between them.
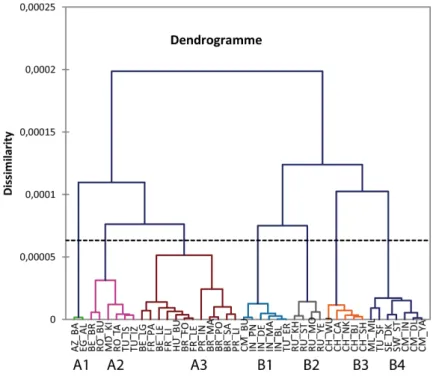
3.2.2 Typology of places of survey
A statistically based classification of the 42 places of survey has been made, in order to examine whether the members of the European Union share a common vision and what are the other visions of the world existing abroad6. The classification reveals firstly a strong opposition between two clusters of places according to their level of Glocal/Local aware-ness: the places where students claim more than usual supranational or global vision (type A) and the places where students claim more than usual national, infra-national or local visions (type B). This very strong division is associated to a large extent to a geographical opposition between Euro-pean and Mediterranean countries (type A) and remote emerging countries (type B). Is this to say that European and Mediterranean students are more aware than other students of the world of global challenges? More open to cross-border relations in a post-national world? Less stuck on local roots and more and more nomadic? Before discussing this issue, it is necessary to analyse in more detail the subdivisions of the main types A and B into more homogeneous groups of places.
Type A (characterised by global awareness) can be further subdivided into three or four clusters with relatively different profiles. Global spiritual awareness (A.1) is observed only in Baku (Azerbaijan) and Alexandria (Egypt). It is characterised by a very high level of “other” answers associated to “global” and “supranational”. This originality can be related to religious vision as the “other” answers are very frequently related to words such as “Islam world”, “God” or “universe”. The over-representation of the supra-national level can be explained by various possible references to divisions of the world based on “Islam” or “Arabic” or “Turkish” territories. Strong global awareness (A.2) defines the places where the score of supranational and global scales is the highest, associated with very low levels of local and infra-national scales of belonging. This strong global awareness is mainly ob-served in Turkey, Romania, and Moldova, and not in the cities located in the old core of the European Union, except Brussels. Light global awareness (A.3) is indeed more characteristic of cities of Belgium, France, Hungary
6Hierarchical clustering method using chi2distance.
Figure 18: Classification of places of survey for scale of belonging (tree)
Figure 19: Classification of places of survey for scale of belonging (profile of clusters)
but also Portugal and Brazil. These places are characterised by a relatively medium situation inside the EuroBroadMap survey and the preference for global or supranational scales is clearly less important than in the previous group of Balkan countries. One interesting discovery of this research is the fact that the scales of belonging of Brazilian students appear very similar to those of students from the European Union in general, and Portugal in particular. Historical links but also common background or similarity in the field of education are possible explanations of this result.
Type B (characterised by local awareness) can be subdivided into four clusters. Mixed Global–Local awareness (B.1) is characteristic of In-dian places of survey and also from Buea, located in the English-speaking part of Cameroon. This group is not very different from the mean profile of EuroBroadMap (as was the case for cluster A.3) but offers the original combination of declaring more than usual the local and global level at the same time. The national level is not mentioned less than usual and it is rather the intermediate scales (supra-national and infra-national) that are less mentioned. Very strong national awareness (B.2) is a very typical profile that is observed only in the four places of survey located in Russia. All the other scales of belonging are less mentioned than usual, with the ex-ception of multiple choices but, as we have seen before, multiple choices are generally related to the national scale of belonging. Local–Infra-national awareness (B.3) is also a very typical profile that is observed only in the five places of survey located in China. The explanation of this specificity is certainly related to the size and internal diversity of China, with strong provincial identities from the historical and cultural points of view. Such a situation is also observed in Brazil where more students than usual have mentioned an infra-national level. But it is not a general rule for all gi-ant countries because the situation is different in India and Russia. Local– Supranational awareness (B.4) defines the last situation, which is mainly observed in sub-Saharan countries (Cameroon and Senegal) but can also be found in Malta, Sweden (Stockholm), and Tunisia (Sfax). We can suspect, but without any empirical proof, that the feeling of belonging to “Africa” rather than to a country with a recent history can be part of the explanation for Cameroon and Senegal. This cluster is indeed characterised by a very low level of national belonging as compared to the rest of the sample. In the case of Tunisia the explanation is probably related to the fact that Sfax has always been a city with a strong identity and some frustration in the national context of Tunisia.
Beside differences in the scales of belonging, one general conclusion can be drawn concerning the existence of a very strong influence of the national dimension on the perception of the world. Indeed, we notice that with very few exceptions, the places of survey located in the same country are sufficiently similar to be put in the same cluster of the typology
(Brazil, France, Romania, India) or to create an original cluster where they are exclusively represented (Russia, China). In comparison, the European Union does not appear to be a very unified territory in terms of scales of belonging. The majority of the EU member states belong to the “global awareness” types but with important variations of degree. And this situation is not specific to the European Union but can also be observed in Brazil. Moreover, students from Sweden and Malta are clustered in the opposite type of low global and strongly local awareness. Finally, we have not noticed a particular use of the “supra-national level” that could express the choice of “Europe” as favourite scale of belonging.
3.3 Social factors of variation of scale of belonging
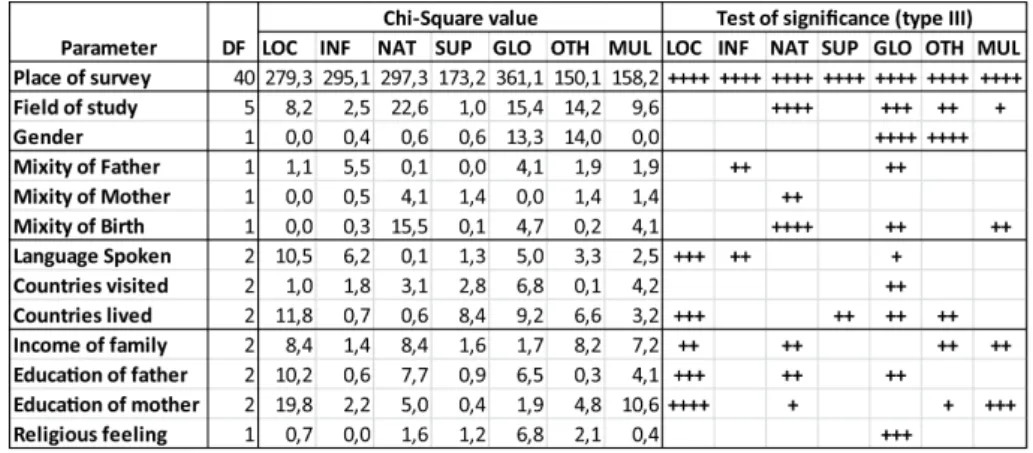
The previous section has revealed the very strong influence of the geograph-ical location of students on the definition of their scales of belonging. The weight of this geographical factor is certainly crucial, but it is interesting to examine if other individual parameters such as gender, field of study, expe-rience of the world by journeys. . . do not introduce also specific attitudes. The problem is the fact that these social or individual effects are less im-portant than the geographical effects and can not be captured without a statistical control of the geographical dimension. It is also necessary to con-trol the respective effects of these social and individual parameters because they are not independent and can therefore not be analysed one by one. 3.3.1 Methodological background for the analysis of social factors The statistical solution is given by the logistic regression (choice model) which makes possible capturing the effect of various parameters of students choice, “other things being equal”. In practical terms, we have carried out seven logistic regression, i.e., one for each possible modality of choice of scale of belonging. These models are presented in the following tables with the following codes: local (LOC), infra-national (INF), national (NAT), supranational (SUP), global (GLO), other (OTH) and multiple (MUL). In each model, we propose explaining the probability of choosing a specific scale of belonging against the other choices. This probability is explained firstly by the place of survey, but also by field of study, gender, religious feeling, difference of nationality between the student and father or mother, location in a country different from the country of birth, number of languages spoken, number of visits or travels abroad, income of family (self-declared), parental educational level (self-declared).
All variables are introduced simultaneously in the model, and the order of introduction is not important as we used a “type III” analysis for the test of their relative effects. “Type III” analysis means that the effect of each explanatory variable is tested against all the others, and the test of
Figure 20: Classification of places of survey for scale of belonging (profile of clusters)
significance is positive only if a parameter reveals a specific explanatory power that was not caught by another variable. The significance of each variable is described in the table by the classical symbols: “++++” for highly significant (pr<0.001) “+++” for highly significant (pr. <0.01), “++” for significant (pr<0.05) and “+” for probably significant, but with a risk of error (pr <0.10).
Looking at the general table of significance, we observe that the place effect is clearly the most important one, whatever the scale of belonging considered. But each of the social and individual variables introduced in the model provides some additional explanations for the choice of the selected scale of belonging. We will now give these effects in detail, excluding the geographical parameters that have been analysed in the previous section, and are not really modified by the control of individual parameters.
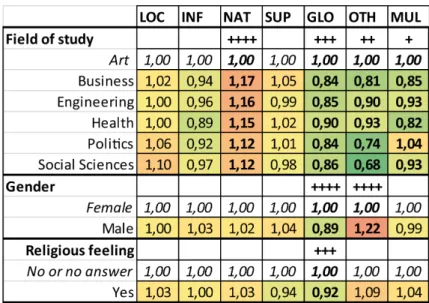
3.3.2 The effect of gender, field of study, and religion
The domain of study has firstly an influence on the belonging scale claimed, but it is mainly related to the specific group of the students in Arts which are in opposition to all other fields of studies in three respects: they claim much more often than usual a preference for the “global” scale of belonging; they propose much more often than usual “other” and “multiple” answers; and they claim significantly less often than usual the “national” level as their favourite scale of belonging. Our survey supports therefore the cliché of the artist as a global citizen, not bound by classical limits, in partic-ular the political borders or the item of the proposed questionnaire. In arts, students could be more sensitive to the question related to Humanity and therefore develop a global feeling of belonging. They could also be influenced
by more pragmatic consideration such as the importance of the international market for art works. Outside of this major exception, only minor differences can be observed, such as the fact that the students from social sciences and humanities tend to be more “local” than the other students—but this is not statistically very significant. We can also notice that students in political science are likely, as were the students in arts, to propose multiple choices for the first rank, which is the opposite of students in Business or Health, who avoid this practice.
When separate logit analyses are carried out country by country7, the effect of the field of study is often significant, despite the reduction of the sample size. However, significant modalities are quite different, and the trends we can observe in the countries are sometimes contradictory. Some general trend can be described, even if, for each one, it could be confronted with contradictory trends in other countries. The most coherent trend can be observed with business students. They are under-represented in declaring the local level (in Azerbaijan, Romania and India); they are more eager to claim the national (in Azerbaijan and India) or supranational (in Turkey and Brazil) levels. Social science students are often over-represented in the quotation of the global level (in Romania, Turkey and India), even if in China they are under-represented in this level. Health students are less represented in the local (Romania and India) level and in national level (Moldova, Brazil), but over-represented in the global level (Romania). The specific situation of art students is generally confirmed: they are under-represented in low levels (local and national, for example in Sweden, Romania, Turkey and India) and over-represented in supranational and global levels (Sweden, Turkey, and India). However, arts students can also be over-represented in the quotation of the infra-national level in Turkey and Romania.
The effect of gender is limited but very interesting as it reveals two very significant differences between scales of belonging. Firstly, it appears that women are more likely than men to choose the global scale of belonging (+11%) and are therefore less likely than men to choose all other geographical scales of belonging (supranational, national, infra-national), except the local scale for which we can not notice any difference between men and women. Secondly, men propose more often than women “other” answers (+22%), refusing the geographical levels proposed in the survey and introducing their own categories, including the non-spatial ones. These gender differences are the most statistically significant that we have observed, outside of the effect of geographical location, and they deserve therefore a deeper analysis. It is certainly not sufficient to invoke “stereotypes” such as the fact that women could be more concerned by the future of humanity (“global” scale) because of their responsibilities in maternity and in the education of children. . . or the
7
These logit analyses at country level are presented in the country reports made by each project partner and delivered in a previous report.
Figure 21: Influence of gender, field of study, and religion on scale of belong-ing
fact that men could be more likely to provide “other” answers because they are less submissive to norms than women. . . These results deserve a more in-depth analysis and necessitate, for example, the examination of the stability of the relation in various sub-samples, in particular at the country level. Unfortunately, because of the reduction of sample size, the gender effect is only significant in four countries. But in all cases, we have a confirmation of the opposition of scale observed between men and women. In Hungary and India, men are over-represented in the declaration of the local level as the first rank of the feeling of belonging. In Belgium and Romania, they are over-represented in the infra-national level. In all of these countries except in Belgium (where the trend is the same but not significant), women are over-represented in the declaration of the global level of belonging.
The effect of religion can not be perfectly measured because—due to an ambiguity in the formulation of the question—we can identify the students who declare a religious belief but we can not distinguish between students who have declared no religious belief and students that did not answer or refused to answer. With this problem in mind, we can nevertheless comment briefly on a result of interest, which is the fact that students that have de-clared a religious belief are less likely to declare the “supranational” or the “global” scale as their first level of belonging. The analysis of the relation in countries where the variable is significant is somehow contradictory. The feeling of belonging to a religion leads to an over-representation of the global level in Tunisia, China and Belgium, to an over-representation of the
tional level in Turkey and Malta, and finally to an over-representation of the local level in Moldova. As the question was badly formulated, we consider it reasonable to stop current investigations on this topic where results are unclear.
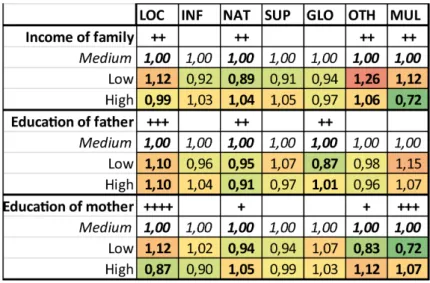
3.3.3 The effect of income and education levels
The socio-economic variables are based on the self-appreciation of the stu-dents for three criteria: the income level of the family, the level of educa-tion of the father, and the level of educaeduca-tion of the mother. Answers were made on a graphical qualitative scale with four degrees (“low”, “medium– low”, “medium–high” to “high”). In the following analysis, we consider the two categories of “medium” as the reference for the logit model, and we focus only on the specific effects of the extreme values “low” and “high”.
Students who declare coming from a low-income family are more “local” but also less “national” than the reference group of medium income students. Those who declare coming from a high-income family are more “national” and “supranational”, but not more “global”, than the stu-dents from the “medium” group. We can also notice that the stustu-dents with a low level of income are more likely to propose “other” or “multiple” answers than medium or high level students.
The more educated is the father, the higher is the scale level quoted: this general relation is verified for the global scale where the stu-dents that declare a father with low education are significantly less likely to declare belonging to the world than medium or high level students. But things are not so clear for the other scales. For example, it appears that the “national” level is preferred by the medium level students, in opposition with the high and low level students, who prefer to declare the “local” level.
The more educated is the mother, the higher is the scale level quoted: this general relation is once more verified but only for the local scale where we can observe that the students who declare a mother with high education will be less likely to declare a “local” feeling of belonging than the students with a medium or low level of the mother’s education. But things are less clear for the other scales and there is no significant relation between the education of the mother and the global scale of belonging.
To summarise our discoveries, it appears that if the higher is either the paternal or the maternal level of education, the more global is the declare feeling of belonging of the student. Furthermore, the maternal and paternal effects reinforce each other. The effect of the income of the family is less clear, probably because the question was more difficult to evaluate, or because the self-assessment was made differently by students in the 18 countries where the survey took place.
Figure 22: Influence of income and education on scale of belonging
When we examine the effects country by country, the one which is most often significant is the income level (6 countries), next, the paternal educa-tional level (5 countries). The educaeduca-tional level of the mother is significant only in two countries. The variations are quite coherent in all countries. The lower are the income and educational levels, the more often the level of locality of the feeling of belonging is declared to be low. However, in some large developing countries (India, Brazil, China, and Turkey), a high income level and a high level of education of either the mother or the father induces an over-representation of the declaration of a national scale for the feeling of belonging.
3.3.4 The effect of the mobility of students and their families The main hypothesis here was that the spatial history of the student could, to a certain extent, have an influence on the spatial level (or scale) of the feeling of belonging. For example, if a student surveyed in one country came from another country, their spatial reference might be larger, in order to include both spatial locations. This hypothesis is quite confirmed by the results of the logit model for the spatial history of both the students and their parents: all tests are very significant. When the fathers are born in the same place, students are more “local” or “infra-national”. When they are born in a different place, the students are more “global” and also more likely to provide “other” answers. When the mothers are born in the same place, students are much more “national”. When they are born in a different place, students are more “supranational” and “infranational”, but also more likely to
Figure 23: Influence of mobility of students and their families on the scale of belonging
propose “multiple” or “other” answers. Finally, when the students live in their birthplace, they are much more “national”; when they live in another place, they are more “global”, and also more likely to provide multiple answers as their first ranked answers. Those results confirm our hypothesis: the richer is the spatial history of the student and their family, the larger is the scale of the feeling of belonging: most often a migration experience leads to declaring a supranational or even a global scales for their feeling of belonging. When we consider the reduction of the importance of the “national” scale in the group of students with significant familial mobility, we have to keep in mind that this de-emphasis of the “national” scale is associated with a strong increase in “multiple” answers, which are generally combinations of the “national” scale with another scale. This means that those students with complex familial histories do not necessarily exclude the national scale from their representations but combine it with other scales and develop a more hybridised pattern of belonging than students with simpler familial histories. In order to make the analysis more precise, we examined how the relation can be observed country by country. The variables describing the spatial his-tory of the student and their family are quite interesting to analyse. The one most often significant is the migration experience of the students themselves: when the student has not been surveyed in their country of birth. In that case, the variable is significant in eight countries. The trend is coherent in all the countries of the sample with some nuances between the developed and the developing countries. The general trend is that when the student is not “a migrant”, their level of belonging is much more local than if a migrant. But, in developing countries, and more precisely in African ones, the absence of migration induces a local scale of the feeling of belonging when the migration induces a national one. In developed countries, the lack of migration
expe-rience induces a national scale in the feeling of belonging, and migration, a supranational (France, Belgium) or a global one (Portugal, France, Belgium, and Russia). The differences between the places of birth of the mother, the father, and the student are significant in three countries. The trend observed is similar to the one observed regarding the migration experience of the stu-dent. When the student is not born in the parental birth-country, ther is a tendency to declare a supranational (in France) or a global scale to the feeling of belonging (in Egypt, France, Belgium, Russia) and a national one in Senegal. One explanation could be that a student declares the spatial scale that includes their own place of birth and residence. In developed Eu-ropean countries, the students have often a EuEu-ropean migration experience that could explain the over-representation of the supranational level, but they also possess world scale migration experiences.
3.3.5 The effect of journeys abroad and number of languages spo-ken
In close thematic link with the previous independent variables, the next variables also give information on the world experience, but not from the point of view of migration. The variables gathered provide information on the “personal experience” of the world: the number of languages spoken, the number of countries where the student lived for more than three months, and the number of countries the student has visited. The three variables have a quite significant statistical relation with the declared scale. When the students speak only one language, they declare the “local” or “infra-national” scale. When they speak two or more languages, the “supra“infra-national” or “global” scale is over-represented, and there is also a greater likelihood of declaring “multiple” and “other choices”. Students who have not travelled abroad, even for a short period, are more “national” and “infra-national”. When they have visited one or more countries abroad, even for short periods of time, they are more likely to declare a scale of “supranational” or “global”. Then, the more they travelled, the more they declared having a global scale to their feeling of belonging. The case of students who lived in another country for a longer period (more than three months) reveals the same pattern, but with much more significant differences between students that have never lived three months out of their country and the others. In this case, the most important effect of the travel abroad is a reduction of the likelihood of having a “local” or “infranational” scale, but not really in that of the “national” one. It is nevertheless very clear that the fact of having lived abroad more than three months increases very strongly the probability of declaring a “supranational” or a “global” scale in their feeling of belonging. All these results are very consistent and confirm that a personal empirical experience of the world, i.e., the number of languages spoken and the number of countries visited for holidays and for longer stays is
Figure 24: Influence of journeys and languages on the scale of belonging
a crucial factor in the enlargement of the scale of their feelings of belonging and their supranational or global awareness.
When we examine this relation country by country, the three variables used to describe the students’ experience of the world are significant in seven countries (number of languages) and six countries (number of countries vis-ited, number of countries where the student lived). Concerning the number of languages spoken, the trend observed in all countries is similar: when the student declares a small number of languages, the scale of the feeling of belonging is small. When the number of languages spoken is large, the scale declared is large. However, some nuances exist. In some countries, when the student speaks only one language, the scale of belonging is local (Turkey, India), infra-national (China), or national (Brazil, Russia). There is a clear link with the languages configuration in these countries: in In-dia, many official languages coexist, while in Brazil there is only one official language. The variables regarding the number of countries visited and the number of countries where the student lived vary in a quite similar way: the less travel experience, the most they declare a local or national scale. The most travelling leads to the most over-representation in the global scale.
3.4 Conclusion: From scale of belonging to mental maps of students
The main finding of this analysis is the domination of the national scale for the feeling of belonging. However, this domination is not so strong and the spatial feeling of belonging can also be expressed at the local and, more
surprisingly, at the global level. What is more surprising is that the supra-national scale is relatively absent in the answers, and this result should be taken into consideration, especially by European actors trying to build a European identity reference.
This survey allows of stressing that a global scale of the feeling of belong-ing is not so rare in our sample: about 20% of the students declare it as their first rank. The awareness of the world scale, and the more and more impor-tant place that the world holds in representations, becoming even sometimes a space of reference for identity, can be explained by many factors. This scale in the identity emerges despite the need to confront the “others in the building of identity” (LaÃŕdi, 2001[64])—extraterrestrial references being ab-sent, as is often stressed with humour, (Grataloup, 2008[53]). However, with optimism, this feeling may come from the contemporary permanent move-ments of populations that less and less allow of applying a social identity to a portion of space. This inevitably leads to a global identity feeling (Guer-mond, 2006[56]). Zarifian (2004[116]) uses the word globality to speak about the objective belonging to one and the same and unique world and about the raising of the consciousness of this belonging. According to him and to AugÃľ (2006[6]), this feeling emerges with the awareness that the Earth is spatially limited and rather small. It emerges also with the awareness that life on Earth is fragile, faced with the threat of global warming, increasing disparities, and global terrorism’s representing the confrontation between civilisations.
The emergence of a global scale of feeling of belonging seems possible since spatial identities are constructed (Thiesse, 2001[108]), especially the national ones. As pointed out by FrÃľmont (1976[44]), the “lived space” (espace vécu in French) is also part of the conditioning and acculturation and alienation mechanism imposing on people a constructed image of the different spaces. Furthermore, the role of disciplinary fields in the social sciences is also rather important in the emergence of national identities, as the social sciences have been institutionalised by states that were constructions and that needed to be legitimised (VilaÃğa, 2008[112]). This legitimation was based on the idea that each society matches with one state only, and that no society could ever exist at a higher level than the national one. However, some difficulties are linked with the global level as a relevant space for the expression of a feeling of belonging: regarding the spatial practices, people face difficulties when they have to consider acting at the global scale as is stressed by numerous authors such as Bauman (2007[8]) who notice that people share the general feeling that global affairs would go on whatever they do. The issues faced in the setting up of acting global structure could be seen as a symptom of the difficulty of making the world scale emerge as an including reality. Those difficulties are due to the fact that the diversity of points of view, representations, norms, and values is very much more
important at the global scale than at the national one (Giraud, 2008[48]). However, from these results, we can hypothesise that a kind of “tran-sition” in the scale of the feeling of spatial belonging could occur just as there exists a “demographic transition”. We suppose that, with the diffusion of development, the diffusion of ideas, the diffusion of a certain way of life throughout the world, populations slowly shift from a local feeling of belong-ing toward a global feelbelong-ing of belongbelong-ing. Therefore, further analysis should test the hypothesis that there may exist a kind of transition in scales of the feeling of belonging, with a continuous progression from the local scale (pre-history, Middle Age) to the global scale, through the national (construction of the modern state) and even supranational (the European Union construc-tion). If this hypothesis is confirmed, further researches should analyse how this transition diffuses through space and time, and also through social space. FrÃľmont (1976[44]) asked if these series of various scale sizes reveal different models in the rapport between humans and space, or an inevitable evolution of humanity? However, this hypothesis raises some problems such as the concurrence between the scale sizes, particularly because of the maintenance of national identities. The maintenance of the historically constructed ref-erent of the nation state, which is deeply rooted, seems contradictory to the emergence of other scales, even if they fit together. If some people seem to have no difficulty dealing with multiple identities (Maalouf, 1998[75]), this is not the case with the majority of the population. There can exist then some tensions and competitions between the spatial identities. Last but not least, some sociologists declare that multi-belonging should be taken into account. This multi-belonging would be more a kind of cohabitation of feelings of belonging than a real merging. It would be, according to Zarifian, “a way of moving in different spaces, from local to global, without noticing it but with a kind of excitement caused by constant travels. But it would be also, conversely, the anguish of those who cannot carry out such movements and, destabilised and worried about globalisation, emphatically refer to localism, regionalism, nationalism and all other ‘-isms’ of spatial identity” (2004[116]). As this author stresses, when we have the privilege of crossing the different layers of space, they relativise themselves.
Finally, the scale of belonging seems therefore strongly linked with spatial practices and, in the perspective of a “world-territory”, with the experience of the global space. More, the relation between the spatial feeling of belong-ing and the world representation should be deepenbelong-ing, in particular when it comes to the division of the world into regions (Question C) where stu-dents were invited to propose from one to fifteen “world regions”. Without anticipating the in-depth analysis of Question C, we can still notice that an obvious relation exists between the number of regions proposed by students on their maps of world divisions and their scale of belonging. Generally speaking, most of the students have typically declared five to nine regions of
Figure 25: Number of divisions of the world proposed by students
the world, which is related to the classical “continental” vision of the world. But many students used the extreme limits of the question, i.e., proposed either the maximum number of regions or refused to divide the world and produce therefore only one region.
A χ2 test carried out on the table, crossing the number of world divisions and the scales of belonging declared by the students, appears very significant and demonstrates clearly that the number of regions proposed by students on their world maps is related to their scale of belonging. More precisely, we can notice that students that are “global” will more frequently refuse to divide the world, or will divide it into fewer regions than usual. On the other hand, students with a “local” scale of belonging will generally prefer to use the maximum level of world division (15) and avoid proposing maps without division or with a limited number. Finally, the students with a “national” scale of belonging will use the most frequent divisions of the world into from five to seven regions, which is obviously related to the classical world division into continents.
Figure 26: Relations between scale of belonging and number of divisions of the world
(1) Loc (2) Inf (3) Nat (4) Sup (5) Glo (6) Oth (7)Mul
1 57 19 120 20 134 34 29
2–4 326 95 509 82 308 64 73
5–7 754 222 1178 192 590 109 162
8–14 584 169 957 176 463 86 162
15 247 58 275 46 164 45 49
χ2 = 123.6 , Degrees of freedom = 24 , p-value < 0.0001
(1) Loc (2) Inf (3) Nat (4) Sup (5) Glo (6) Oth (7)Mul
1 0.60 0.70 0.82 0.80 1.67 2.08 1.27
2-4 0.97 0.99 0.98 0.93 1.09 1.11 0.90 5-7 1.02 1.05 1.03 0.99 0.95 0.86 0.91 8-14 0.98 0.99 1.04 1.12 0.92 0.84 1.12 15 1.22 1.00 0.88 0.86 0.96 1.29 1.00 Cells in bold are characterised by significant local deviation (χ2 > 3.84 and