HAL Id: tel-00998383
https://tel.archives-ouvertes.fr/tel-00998383
Submitted on 23 Jun 2014
HAL is a multi-disciplinary open access archive for the deposit and dissemination of sci-entific research documents, whether they are pub-lished or not. The documents may come from teaching and research institutions in France or abroad, or from public or private research centers.
L’archive ouverte pluridisciplinaire HAL, est destinée au dépôt et à la diffusion de documents scientifiques de niveau recherche, publiés ou non, émanant des établissements d’enseignement et de recherche français ou étrangers, des laboratoires publics ou privés.
Regulation of mitochondrial ATPase by its inhibitor
protein IF1 in Saccharomyces cerevisiae
Qian Wu
To cite this version:
Qian Wu. Regulation of mitochondrial ATPase by its inhibitor protein IF1 in Saccharomyces cere-visiae. Agricultural sciences. Université Paris Sud - Paris XI, 2013. English. �NNT : 2013PA11T097�. �tel-00998383�
UNIVERSITE PARIS-SUD
FACULTÉ DE MÉDECINE PARIS-SUD
ÉCOLE DOCTORALE 419
SIGNALISATIONS ET RÉSEAUX INTÉGRATIFS EN BIOLOGIE
Laboratoire de Protéines MembranairesUMR 8221 CNRS/CEA Saclay
DISCIPLINE
Biochimie et biologie moléculaire
THÈSE DE DOCTORAT
THÈSE DE DOCTORAT SUR TRAVAUX
soutenue le 12/12/2013
par
Qian WU
Regulation of mitochondrial ATP synthase
by its endogenous inhibitor IF1
in Saccharomyces cerevisiae
Directeur de thèse : Francis HARAUX
Composition du jury :
Président du jury : Marc LE MAIRE
Rapporteurs : Bruno MIROUX Daniel BRÈTHES
Examinateurs : Laura BACIOU Francis HARAUX
Acknowledgement
Time flies! A blink, I am already at the end of my PhD study. It has been a very pleasant three years, during which I learnt so much about science and life, as well as my French, English and some fake Italian. This thesis would have remained a dream had it not been for Francis Haraux, my Director of thesis, my friend, guide and philosopher. Thank you so much, Francis, for being patient, encouraging and supporting; for all the scientific discussions, all the experiments we did together and things I learnt from you; for teaching me the most proper French; for your sense of humor and your art; for sharing the happy moments around delicious food and drinks; for all the personal help (especially important for a foreign student!); for all the …… (I need ten more pages.)
It is with immense gratitude that I acknowledge the support and help of our team, Dr. Claire Lemaire, Mehdi Lembrouk, Margaux Renvoisé, as well as Gwenaëlle Moal. Well, Dr. Tiona Andrianaivomananjaona needs a whole line for her name! Thank you, Tiona for all the valuable help throughout the whole practical work! Thank you, my lovely colleagues for all the team meeting, discussion and lunchtime! I wish to thank our collaborator Dr. Emmanuel Tetaud, with whose professional skills and advise we could complete our work and eventually write an article. I would like to express my thanks of gratitude to my thesis committee: Dr. Bruno Miroux, who is as well my “rapporteur extérieur” during my thesis; Dr. Daniel Brèthes, who comes all the way from Bordeaux; Dr. Laura Baciou from Orsay; and Pr. Marc le Maire as the president of the committee. I am lucky to have this group of great scientists spending their valuable time and energy to review my thesis and coming to my defense. Thank you very much! I am indebted to Pr. Marc le Maire who offered me the opportunity to work in our institution iBiTec‐S. As the Director of master, he helped me with patience and encouragement; as the Director of URA2096, he and Dr. Ahmed Zahraoui offered me the internship in our institution in CEA saclay. In iBiTec‐S/SB2SM, it is with immense gratitude that I acknowledge the great support and help of Bruno Robert, the Director of SB2SM/UMR8221; Jean‐Marc Grognet, the Director of iBiTec‐S; Maïté Paternostre, the vise Director of iBiTec‐S.
It gives with me great pleasure in acknowledging the support of my colleagues and friends in SB2SM, whom I spent pleasant three years. Thanks Ghada, Violaine and Dominique, I learnt a lot from you! Thanks Anja, Sun for the lunchtime that I improved my English and for your warm help for my thesis! Thanks Hervé, without your spectro I could not have good yeast! Thanks Alain, for inviting me to your pots! Thanks Winfried for sharing cigarette breaks! Thanks my dear friends Amin, Benjamin, Cedric, Christian, Denis, Denise, Eduardo, Eiri, Kathleen, Liz, Manolis, Michał, Raj, Sana, Stéphanie, as well as my dearest physicists Cinthya, Marta, Adam and Niraj. Thank you for your support and all the happy time together! Those very close friends inside and outside of CEA who I didn’t write your names here are all in my heart!!! I am so lucky that I have many great friends here, which makes me feel like home.
Finally, I would say that my thesis is dedicated to my parents who have given me the opportunity of an education from the best institutions and support throughout my life. I cannot find words to express my love!
Table of contents
Abbreviations ... 9 1. Introduction ... 18 1.1. Mitochondrion ... 18 1.1.1. History and diseases ... 18 1.1.2. Main structure and function ... 20 a) Outer mitochondrial membrane ... 22 b) Intermembrane space ... 22 c) Inner mitochondrial membrane ... 23 d) Matrix ... 23 1.1.3. Electron transport chain ... 24 a) Complex I or NADH dehydrogenase ... 24 b) Complex II or succinate dehydrogenase ... 25 c) Complex III or complex bc1 ... 25 d) Complex IV or cytochrome c oxidase ... 26 e) Coupling with ATP production via ATP synthase, complex V ... 26 1.2. ATP synthase ... 27 1.2.1. Classification of different types of ATPases ... 27 1.2.2. Structures of FoF1 ATP synthase ... 29 1.2.2.1. Fo sector ... 31 1.2.2.2. F1 sector ... 34 1.2.2.3. FoF1 complex ... 36 1.2.2.4. Supramolecular organization of FoF1‐ATP synthase ... 38 1.2.3. FoF1 ATP synthase: A molecular rotary motor ... 38 1.2.3.1. Visualization of the rotation ... 38 1.2.3.2. Rotor and stator ... 42 1.2.3.3. Proton translocation ... 42 1.2.4. Forward the mechanism of ATP synthase ... 441.2.4.1. Binding change mechanism ... 45 1.2.4.2. Catalytic sites occupancy: Uni‐site catalysis and multi‐sites catalysis ……….47 1.2.4.3. non‐catalytic sites ... 48 1.2.5. Regulation of ATP synthase ... 49 1.3. Endogenous inhibitor of ATPase, IF1 ... 50 1.3.1. Structures of IF1: bovine vs yeast ... 50 1.3.2. Mechanism of IF1 inhibition ... 53 1.3.2.1. Uni‐directional inhibitory mechanism ... 53 1.3.2.2. Mitochondrial‐specific ATPase inhibition ... 54 1.3.2.3. Other inhibitory system for bacterial and chloroplast ATPases ... 55 1.4. Thesis statement ... 57 2. Materials and Methods ... 60 2.1. Materials ... 60 2.1.1. Yeast and bacteria strains ... 60 2.1.2. Cell culture media ... 61 2.1.3. Plasmid vectors and protein modification ... 63 2.1.4. Oligonucleotide primers ... 64 2.2. Methods ... 67 2.2.1. Mutagenesis ... 67 2.2.1.1. Site‐directed mutagenesis principle ... 67 2.2.1.2. Bacteria and Yeast cells transformations ... 69 2.2.1.3. DNA extraction and quantification ... 70 2.2.2. Production of yeast mitochondria (WT & mutants) ... 71 2.2.3. Production of yeast IF1 ... 72 2.2.4. Kinetic measurement ... 73 3. Results and Discussions ... 78
3.1. Analyses of published X‐ray crystallographic structures of F1‐ATPase ... 78 3.1.1. Bos taurus F1‐ATPase crystal structures, with or without IF1 ... 78 3.1.2. Saccharomyces cerevisiae F1‐ATPase crystal structures, with or without IF1...82 3.1.3. Sequence alignment on α and β subunits of mitochondrial and non‐ mitochondrial ATP synthases ... 87 3.1.4. Kinetic parameters ... 90 3.1.5. SMP centrifugation ... 93 3.2. Specificity of mitochondrial ATPase inhibition by IF1 ... 99 3.2.1. Original study of IF1 specificity ... 99 3.2.2. Effect of mutations in α and β subunit: investigation of IF1 specificity . 104 3.2.3. Discussion ... 106 3.3. IF1‐F1‐ATPase interaction process in Saccharomyces cerevisiae: Grasping and locking of inhibitor IF1 by yF1‐ATPase? ... 107 3.3.1. Previous studies lead the pathway to study IF1 binding process ... 107 3.3.2. Group A and B: γ‐remote residues from αDP, βDP ... 107 3.3.2.1. Effect of mutations in group A (α‐E357D‐Y399F‐R400A‐V402L‐ Q418N)………108 3.3.2.2. Effect of mutations in group B (β‐T380R‐S383E, E471K‐A474E and T380R‐S383E‐E471K‐A474E) ... 111 3.3.2.3. Discussion ... 114 3.3.3. Group C and D: γ‐neighbouring residues from αDP, βDP ... 115 3.3.3.1. Effect of mutations in Group C: ... 117 3.3.3.2. Effect of mutations in Group D ... 124
3.3.3.3. Combination of crucial mutations α409GS‐ ‐ ‐AST416 and β394DGLSEQD400 ... 126
3.3.3.5. Discussion ... 129 4. Conclusion ... 136 5. Perspectives ... 140 6. References ... 146 Appendix ... 160
List of figures
Figure 1. Ultra‐fine‐structure of mitochondria revealed by HRSEM ... 21 Figure 2. Model of mitochondrial components. ... 22 Figure 3. Representation of S. cerevisiae mitochondrial electron transport chain. ... 24 Figure 4. Electron microscopic images of ATP synthase from various organisms. ... 29 Figure 5. Simplified representation of yeast FoF1 ATP synthase structure ... 30 Figure 6. Models of FoF1 ATP synthases representing Saccharomyces cerevisiae mitochondrial ATP synthase and Escherichia coli ATP synthase ... 32 Figure 7. 3D structure of E. coli subunit c monomer determined by NMR, and representation of E. coli subunits a‐c12. ... 34 Figure 8. Structure of F1‐ATPase from Saccharomyces cerevisiae. ... 35 Figure 9. X‐ray crystal structures of yeast and bovine F1c10‐ATP synthase. ... 37 Figure 10. Observation of dimeric yeast mitochondrial ATP synthase by electron microscopy ... 38 Figure 11. First direct observation of the γ subunit rotation in the α3β3γ subcomplex . 39 Figure 12. Observation of the c subunit rotation in F1‐ATPase of E. coli. ... 39 Figure 13. Observation of Bacillus PS3 F1‐ATPase stepwise rotation ... 40 Figure 14. Simultaneous observation system of Bacillus PS3 F1‐ATPase rotation and ATP binding ... 41 Figure 15. Models for the generation of rotation by proton transport through the Fo domain of bacterial ATP synthase. ... 43 Figure 16. Model of ATP synthase rotary catalysis annotated according to Boyer’s classic model ... 46 Figure 17. Stereo view of the 2.2 Å crystal structure of bovine IF1 ... 51 Figure 18. Protein sequence alignment of bovine and yeast IF1. ... 52 Figure 19. Stereo view of the 2.5 Å crystal structure of yeast IF1 from the inhibited IF1‐ MF1 complex. ... 53 Figure 20. Representation of IF1 inhibition of mitochondrial ATPase. ... 54 Figure 21. Representation of ε subunits regulation of bacterial ATPase. ... 55 Figure 22. Overview of site‐directed mutagenesis principle. ... 68Figure 23. Overview of bacteria transformations. ... 69 Figure 24. Principle of IF1 overexpression in E. coli BL21(DE3) ... 72 Figure 25. ATP regeneration system using pyruvate kinase and lactate dehydrogenase ... 73 Figure 26. Spectrophotometric recording of ATP hydrolysis and IF1 inhibition in real time kinetics. ... 74 Figure 27. Bovine mitochondrial F1‐ATPase, IF1‐free or IF1‐bound. ... 80 Figure 28. Zoom of IF1 binding region in bovine mitochondrial F1‐ATPase. ... 81 Figure 29. Yeast mitochondrial F1‐ATPase, IF1‐free or IF1‐bound. ... 84 Figure 30. Zoom of IF1 binding region in yeast mitochondrial F1‐ATPase. ... 85 Figure 31. Sequence alignment on α subunit of mitochondrial and non‐mitochondrial ATP synthases. ... 88 Figure 32. Sequence alignment on β subunit of mitochondrial and non‐mitochondrial ATP synthase. ... 89 Figure 33. Experimental determination of IF1 binding parameters to SMP WT. ... 91 Figure 34. Experimental determination of IF1 binding parameters to MF1 WT, and SMP WT. ... 92 Figure 35a. Experimental determination of kon value comparing SMP WT and α409GS‐ ‐ ‐AST416 with or without centrifugation ... 95 Figure 35b. Experimental determination of Kd value comparing SMP WT and α409GS‐ ‐ ‐AST416 with or without centrifugation ... 95
Figure 35c. Experimental determination of koff value comparing SMP WT and α409GS‐ ‐ ‐AST416 with or without centrifugation ... 95 Figure 36. Yeast IF1 inhibiting ATP hydrolysis of purified F1‐ATPases from different organisms. ... 100 Figure 37. Bovine and yeast crystal structures showing the selected residues in F1‐ ATPase β subunit for IF1 specificity study. ... 102 Figure 38. Yeast crystal structures showing the selected residues in F1‐ATPase α subunit for IF1 specificity study. ... 103 Figure 39. IF1 inhibition of wild type and mutant SMP from yeast. ... 105
Figure 40. Experimental data of mutants in group A and determination of IF1 binding parameters. ... 109 Figure 41. Experimental data of mutants in group B and determination of IF1 binding parameters ... 112 Figure 42. Interaction between βDP‐E471, A474 and IF1 midpart in bovine IF1‐F1‐ ATPase. ... 115 Figure 43. Zoom of residues in Group C and D in bovine mitochondrial F1‐ATPase. ... 116 Figure 44a. Group C: rate constant of inhibition (kapp) as a function of IF1
concentration. ... 119 Figure 44b. Group C: normalized ATPase activity at equilibrium as a function of IF1 concentration ... 119 Figure 44c. Group C: normalized ATPase activity at equilibrium as a function of 1/kapp ... 119 Figure 45. Kinetic constants of IF1 binding and release after mutagenesis of Group C residues. ... 123 Figure 46. Experimental data of mutants in group D and determination of IF1 binding parameters. ... 125 Figure 47. Kinetics of ATP hydrolysis and IF1 inhibitions of yeast wild type and the “double mutant” SMP. ... 127 Figure 48. Interaction between αDP409GSDLDAST416 and its neighbouring residues. .. 131 Figure 49. Interaction between β‐DELSEQD and its neighbouring residues. ... 132 Figure 50. Representation of IF1 binding‐locking process in yeast mitochondrial ATPase. ... 137
List of tables
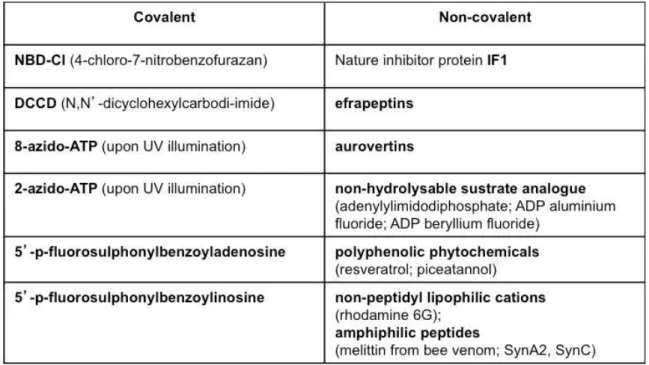
Table 1. Nomenclature of subunits from FoF1 ATP synthase in bacterial, chloroplast and mitochondrial ATP synthases. ... 31 Table 2. Identified covalent and non‐covalent inhibitors of mitochondrial F1‐ATPase .. 50 Table 3. Description of Saccharomyces cerevisiae strains. ... 60 Table 4. Description of Escherichia coli strains ... 61 Table 5. Description of cell culture media. ... 62 Table 6. Description of amino acids, bases and antibiotics. ... 62 Table 7. Description of plasmid vectors. ... 64 Table 8. Description of mutations and their oligonucleotide primers. ... 65 Table 9. Description of oligonucleotide primers for sequencing. ... 66 Table 10. Yeast (S. cerevisiae W303‐1A ∆ATP1∆ATP2) transformation Selections. ... 70 Table 11. Residues in β subunit selected for IF1 specificity study. ... 101 Table 12. Residues in α subunit selected for IF1 specificity study. ... 104 Table 13. IF1 binding parameters of ATP synthase with mutants of group A. ... 110 Table 14. IF1 binding parameters of ATP synthase with mutants of group A. ... 111 Table 15. IF1 binding parameters of ATP synthase with mutants of group B. ... 113 Table 16. IF1 binding parameters of ATP synthase with mutants of group B, at pH 8. 113 Table 17. IF1 binding parameters of ATP synthase with mutants of Group C. ... 122 Table 18. IF1 binding parameters of ATP synthase with mutants of Group D. ... 126Table 19. IF1 binding parameters of “double mutant”, α409GS‐ ‐ ‐AST416 and β394DGLSEQD400. ... 127 Table 20. IF1 binding parameters of mutants in γ subunit. ... 129
Abbreviations
3D ADP ATP AMP-PNP ANT BCA bIF1 CCCP CoQ dam DCCD DNA DTT EM ER FCCP FRET GFP G418 HRSEM IPTG LB LDH MES mtDNA NADH Ni-NTA OSCP PAGE PCR Three-dimensional Adenosine diphosphate Adenosine-5'-triphosphate 5’-adenylyl-β-γ-imidodiphosphate Adenine nucleotide translocator Bicinchoninic acidBovine IF1
Carbonyl cyanide m-chlorophenyl hydrazone Coenzyme Q
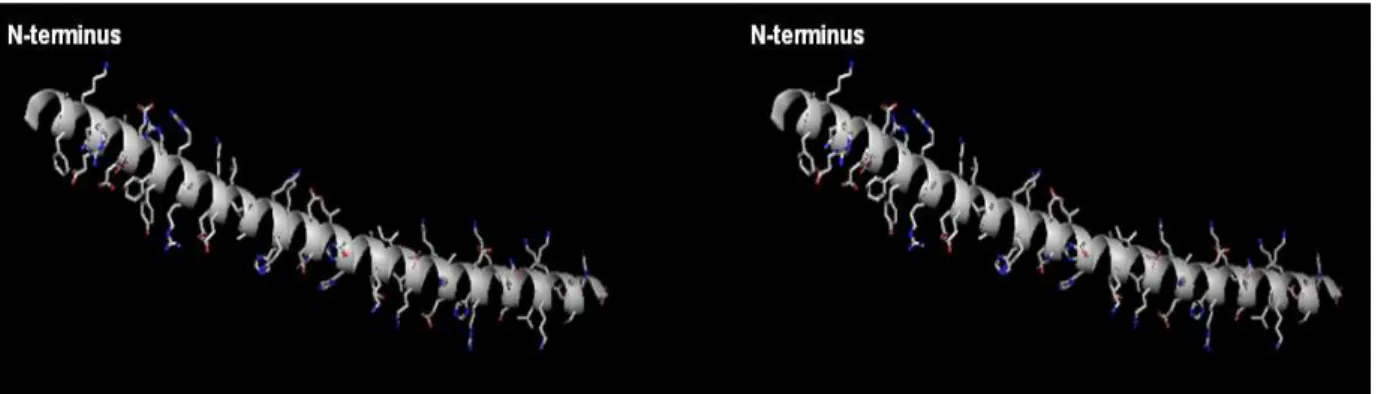
DNA adenine methylase
N,N'-Dicyclohexylcarbodiimide Deoxyribonucleic acid Dithiothreitol Electron microscopy Endoplasmic reticulum Carbonyl cyanide-4-(trifluoromethoxy)phenylhydrazone Fluorescence resonance energy transfer
Green fluorescent protein Geneticin
High-resolution scanning electron microscopy Isopropyl β-D-1-thiogalactopyranoside
Luria Broth
Lactate dehydrogenase
2-(N-morpholino)ethanesulfonic acid Mitochondrial deoxyribonucleic acid
Reduced nicotinamide adenine dinucleotide Nickel-nitrilotriacetic acid
Oligomycin sensitivity-conferring protein Poly-acrylamide gel electrophoresis Polymerase chain reaction
pdb PGK PK pmf RNA ROS SDS SMP TIM Tris UCP yIF1
Protein data bank
Phosphoglycerate kinase Pyruvate kinase
Protomotive force Ribonucleic acid
Reactive oxygen species Sodium dodecyl sulfate Submitochondrial particles Transporter inner membrane Tris(hydroxymethyl)aminomethane Uncoupling protein
Chapter 1. Introduction
1. Introduction
1.1. Mitochondria
Mitochondria are organelles found in most eukaryotic cells (all plants, animals, fungi and protists) (Henze & Martin, 2003). This compartment, which has a double‐ membrane‐enclosed structure, together with the nucleus is the distinguishing characteristics of eukaryotic cells and is not found in prokaryotic cells. Mitochondria are considered to be the double‐membrane‐bounded powerhouses of eukaryotic cells, because they generate most of the supply of adenosine triphosphate (ATP) used as a source of chemical energy for the cells. The prokaryote‐to‐eukaryote transition is still unclear with many different theories on the go. In addition to supplying cellular energy, mitochondria are involved in other functions such as signalling, cellular differentiation, cell death, as well as the control of the cell cycle and cell growth. They are also implicated in several human diseases including mitochondrial disorders (Burnett et al, 2005) and cardiac dysfunction (Lesnefsky et al, 2001) and may play a role in the aging process.
Mitochondria are semi‐autonomous in the sense that they are partially dependent on the cell to replicate and grow. They have their own DNA, ribosomes and can make their own proteins. Similar to bacteria, mitochondria have circular DNA (mt DNA) and replicate by a reproductive process called fission. A typical animal cell will have on the order of 1000 to 2000 mitochondria. So the cell will have a lot of materials that are capable of producing a high amount of available energy. This ATP production by the mitochondria is coupled to the process of respiration, which occurs in the mitochondrial inner membrane with an electron transporting chain.
1.1.1. History and diseases
The first observations of intracellular structures probably representing mitochondria date to the 1840s (e.g. Henle, 1841; Aubert, 1852; Kkolliker, 1856;
Butschli, 1871; Flemming, 1882; Kolliker, 1888; Retzius, 1890). In 1894, Richard Altmann established them as “elementary organisms” living inside cells and carrying out vital functions and called them “bioblasts”. His idea of symbiotic origin of mitochondria was accepted several decades later, based on similarities between mitochondria and bacteria. The term mitochondrion was introduced in 1898 by Carl Benda. It originates from the Greek “mitos” (thread) and “chondros” (granule), referring to the appearance of these structures during spermatogenesis. The observations of mitochondria developed with time and electromicroscopy technology. Bonjamin F. Kingsbury, in 1912, first related mitochondria with cell respiration but almost exclusively based on morphological observations. It was not until 1925 when David Keilin discovered cytochromes that the respiratory chain was described. In the middle of 20th century, the observations of mitochondria were revolutionary on structure and metabolism. The first high‐resolution micrographs appeared in 1952. This led to a more detailed analysis of the structure of the mitochondria. The popular term “powerhouse of the cell” was defined by Philip Siekevitz in 1957. In 1967 it was discovered that mitochondria contained ribosomes. The year after, methods were developed for mapping the mitochondrial genes, with the genetic and physical map of yeast mitochondria being completed in 1976.
There are two hypotheses about the origin of mitochondria: endosymbiotic and autogenous. The endosymbiotic hypothesis suggests mitochondria were originally prokaryotic cells that were capable of implementing oxidative mechanisms, of which eukaryotic cells were not capable. The autogenous hypothesis suggests mitochondria were born by splitting off a portion of DNA from the nucleus of the eukaryotic cell at the time of divergence with the prokaryotes. Since mitochondria share many common features with bacteria, the endosymbiosis theory is more popular at present.
Mitochondria are found in every cell of the human body except red blood cells. They are implicated in several human diseases. Mitochondrial diseases result from failures of the mitochondria, damage and subsequent dysfunction in mitochondria, which influence the cell metabolism. Diseases caused by mutation in the mtDNA include Keams‐Sayre syndrome (Butler & Gadoth, 1976), MELAS syndrome
(Mitochondrial encephalomyopathy, lactic acidosis, and stroke‐like episodes) (Pavlakis et al, 1984), Pearson’s syndrome (Baerlocher et al, 1992), progressive external ophthalmoplegia, MERRF (myoclonic epilepsy with ragged red fibers) (Wu et al, 2010) and Leber’s hereditary optic neuropathy (Hadavi et al, 2013). In most case, these diseases are transmitted by a female to her children, as the zygote derives its mitochondria and hence its mtDNA from the ovum. The disease primarily affects children, but adult onset is becoming more and more common. In addition, a number of mitochondrial dysfunctions of genetic origin are implicated in a range of age‐related diseases, including tumours. Mutations in the mitochondria‐encoded subunits of ATP synthase cause OXPHOS disease (Kovarova et al, 2012; Shoffner, 1999). ATP synthase has also been found on the surface of cancer cells, whereas the enzyme was thought to be localized mainly to mitochondria. More recent work on mitochondrial ATPase regulator IF1 (description in paragraph 1.3) revealed that in tumor cells IF1 overexpression inhibits the oxidative phosphorylation causing membrane hyperpolarization and favoring the aerobic glycolysis by ROS‐mediated activation of NFkB which results in cell proliferation. It suggested that IF1 would inhibit both ATP synthesis and hydrolysis depending on the mass action ratio. (Formentini et al, 2012; Sanchez‐Cenizo et al, 2010). Conversely, it has been proposed that in the hypoxic conditions of cancer cells, IF1 is involved in protecting tumor cells from excess ROS production and ROS‐mediated apoptosis (Faccenda & Campanella, 2012).
1.1.2. Main structure and function
Mitochondria vary widely in shape, such as rod‐like or granular; and in size ranging from 0.5 to 1.0 µm in diameter. The first high‐resolution micrographs appeared in 1952 revealed by Palade (Palade, 1952). In the following years, different models have been established. Figure 1 shows an observation of mitochondria from rat pancreas exocrine cells using High‐resolution scanning electron microscopy (Perkins & Frey, 2000). This ultra‐fine‐structure of mitochondria was published in 2000 by Perkins and Frey, from which we could clearly distinguish the outer and inner
mitochondrial membrane, as well as cristae, and maybe also the ATP synthase. A model of mitochondria is shown in figure 2. Details of their components will be developped as follows.
Figure 1. Ultra‐fine‐structure of mitochondria revealed by HRSEM (High‐Resolution Scanning Electron Microscopy) (Perkins & Frey, 2000).
Mitochondria from rat pancreas exocrine cells are shown in the figure. 1) Fracture plane revealing the surface (left) and interior structure (right) of mitochondria (M). Labeled features are outer mitochondrial membrane (OM), inner mitochondrial membrane (IM), cristae (C), tubular cristae (tC), rough endoplasmic reticulum (rER), ribosome (r). 2) View emphasizing the intermembrane space separating the outer and inner membranes (arrowheads) and “elemental particles” (arrows), which may be the ATP synthases.
Figure 2. Model of mitochondrial components. This model originated with Palade in 1952 and was reproduced by Perkins and Fray, 2000. This figure shows the representation of the mitochondria that has been prominent until recently. a) Outer mitochondrial membrane The outer membrane of mitochondria encloses the entire organelle. It is around 6 and 7 nm thick and barely selective to ions or other small molecules. This membrane has a protein‐to‐phospholipid ratio close to 4:6 which is similar to that of the eukaryotic plasma membrane. It contains large numbers of integral proteins such as porins and translocases allowing molecules of different sizes to pass from one side to the other.
b) Intermembrane space
The intermembrane space is the space between outer membrane and inner membrane of a mitochondrion. It is also known as perimitochondrial space. In the intermembrane space, the concentration of small molecules such as ions and sugars is the same as in cytosol because of the outer membrane permeability. However, large
size proteins have specific signalling sequences to be transported across the outer membrane to the intermembrane space, e.g. cytochrome c (Chipuk et al, 2006).
c) Inner mitochondrial membrane
The inner membrane of mitochondria is very rich in protein. It contains around 1/5 of the total protein in a mitochondrion. It is also very selective to most of molecules. Almost all ions and molecules require special membrane transporters to enter or exit the matrix. Proteins are ferried into the matrix via the translocase of the inner membrane (TIM) complex or via Oxa1 (Herrmann & Neupert, 2000). Besides, the inner membrane has a particularly high level of one phospholipid, cardiolipin, which is important to stabilize the respiratory chain supercomplexes (Eble et al, 1990; Pfeiffer et al, 2003; Zhang et al, 2005). The respiratory chain, or electron transport chain, is located in the inner membrane containing four protein complexes. It forms a membrane potential, which is used to produce ATP. Most of the ATP in a cell is produced in the inner membrane by the enzyme ATP synthase, which is also known as complex V forming the oxidative phosphorylation (OXPHOS) chain. This membrane also contains the ATP/ADP transporter, phosphate transporter that insure the production of ATP.
d) Matrix
The matrix is the space enclosed by the inner membrane. It contains about 2/3 of the total protein in a mitochondrion as well as a few mitochondrial genetic materials and the machinery to manufacture the mitochondrial proteins. There are several important metabolic processes occurring in the matrix, such as the oxidation of pyruvate and fatty acids, the citric acid cycle, vitamins biosynthesis, and hormone steroids biosynthesis etc. It is also implicated in the calcium and ROS signaling. In addition, it participates in the cell aging and apoptosis.
1.1.3. Electron transport chain
The electron transport chain locates in the inner mitochondrial membrane. It consists of a series of protein complexes cooperating to generate redox reactions, which couples electron transfer between an electron donor and an electron acceptor (such as NADH and O2) to the transfer of protons H+ across the membrane, establishing
an electrochemical proton gradient. The proton gradient is used by the enzyme ATP synthase to store energy as ATP (adenosine triphosphate). Figure 3 shows the mitochondrial electron transport chain in Saccharomyces cerevisiae. Figure 3. Representation of S. cerevisiae mitochondrial electron transport chain (Rigoulet et al, 2010). a) Complex I or NADH dehydrogenase Complex I is the first enzyme of the respiratory chain, which contains a soluble and transmembrane part. The protein structure in Thermus thermophiles was solved in 2010 (Efremov et al, 2010). This complex couples electron transfer between NADH and quinone to proton translocation. Two electrons are removed from NADH and transferred to ubiquinone (Q). The reduced product ubiquinol (QH2) freely diffuses within the membrane, and complex I translocates n protons (n, the number of translocated protons) across the membrane, thus producing a proton gradient.
NADH + H+ + Q + n H+matrix NAD+ + QH2 + n H+intermembrane
Succinate Dehydrogenase Complex II Cytochrome bc1 Complex III Cytochrome c oxydase Complex IV
In yeast mitochondria, the complex I is replaced by two NADH dehydrogenases located in inner membrane facing matrix (Ndip) or facing intermembrane space (Nde1p and Nde2p). They lack the transmembrane part, thus in yeast mitochondria the reduction of NADH does not induce proton translocation.
b) Complex II or succinate dehydrogenase
Complex II refers succinate dehydrogenase, which is bound to the inner membrane facing matrix. It is the only enzyme that participates in both the citric acid cycle and the electron transport chain (Oyedotun & Lemire, 2004). It catalyzes the oxidation of succinate to fumarate with the reduction of ubiquinone to ubiquinol. The succinate binding site and ubiquinione binding site are connected by a chain of redox centers including FAD and the Fe‐S cluster.
c) Complex III or complex bc1
Complex III is also called cytochrome bc1 complex. It is a mutisubunit transmembrane protein encoded by both mitochondrial (cytochrome b) and the nuclear genomes (all other subunits) (Gao et al, 2003). Three subunits have prosthetic groups. The cytochrome b subunit has two b‐type hemes (bL and bH), the cytochrome c
subunit has one c‐type heme (c1), and the Rieske Iron Sulfur Protein subunit (ISP) has a
two iron, two sulfur iron‐sulfur cluster (2Fe‐2S). This complex catalyzes the reduction of cytochrome c by oxidation of coenzyme Q (ubiquinone) and the concomitant translocation of four protons from the mitochondrial matrix to the intermembrane space.
QH2 + 2 cyt c (Fe3+) + 2 H+matrix Q + 2 cyt c (Fe2+) + 4 H+intermembrane
In the Q cycle process, two protons are consumed from the matrix, four protons are released into the intermembrane space, and two electrons are passed to cytochrome c (Kramer et al, 2004). As a result a proton gradient is formed across the membrane.
d) Complex IV or cytochrome c oxidase
The complex IV or cytochrome c oxidase is a large transmembrane protein complex found in bacteria and the mitochondrion (Iwata et al, 1995; Tsukihara et al, 1996). This is the last enzyme in the respiratory chain of mitochondria. It receives an electron from each of four cytochrome c molecules, and transfers them to one oxygen molecule, converting molecular oxygen to two molecules of water. In the process, it translocates four protons across the membrane, helping to establish a transmembrane proton gradient that is subsequently used by ATP synthase to synthesize ATP.
4 cyt c (Fe2+) + O2 + 8 H+matrix 4 cyt c (Fe3+) + 2 H2O + 4 H+intermembrane
e) Coupling with ATP production via ATP synthase (complex V of OXPHOS chain) The electron transport chain and ATP synthesis are coupled by the proton gradient across the inner membrane. The chemiosmotic hypothesis was first proposed in 1961 by Peter D. Mitchell. The protons move back across the inner membrane through the enzyme ATP synthase (also called complex V). The flow of protons back into the matrix of the mitochondria via ATP synthase provides energy for adenosine disphosphate (ADP) to combine with inorganic phosphate to form ATP. The term proton motive force (pmf) was created from the electrochemical gradient to describe the energy that is generated by the transfer of protons or electrons across an energy transducing membrane. The equation of the electrochemical proton gradient can be simplified to:
Δµ
H+ = FΔψ - 2,3 RT ΔpH
ΔG = ΔG ’+ 2.3 RT log
[ATP]
~
where the F is Faraday constant (96,485 C mol‐1); R is the molar gas constant (8.314 J mol‐1K‐1), T is the temperature in Kelvins, and Δψ is the transmembrane electrical potential difference in volts.
1.2. ATP synthase
ATP synthase is an essential enzyme in all kinds of cells, no matter prokaryote or eukaryote, plants or animals. It catalyzes ATP synthesis from ADP and inorganic phosphate driven by a flux of protons across the membrane down the proton gradient generated by electron transport chain. ATP is the most commonly used energy form of cells from most organisms in order to achieve most of cellular functions. ATP synthase is a large protein complex sitting in the inner membrane of mitochondria with a membrane embedded section Fo and a soluble section F1‐ATPase facing the matrix. So
it is called FoF1 ATP synthase. When neither respiratory chain nor photosynthetic
proteins can generate the pmf, ATP synthase works as a proton pump at the expense of ATP hydrolysis. The overall reaction is as following, where the n represents the number of protons pumped through ATP synthase. This number varies from different organismes (see paragraph 1.2.3.3 proton translocation).
ADP3‐ + HPO42‐ + H+ + n H+intermembrane ATP4‐ + H2O + n H+matrix
However, in most cases ATP hydrolysis activity is a potential danger to a living cell, so ATP synthase has several regulatory mechanisms to prevent futile ATP wasting, such as the IF1 inhibition. 1.2.1. Classification of different types of ATPases There are different types of ATPases found in different organisms. According to their functions, structures, localisations as well as ions that they transport, they are classified into different types.
F‐ATPase is also known as FoF1 ATP synthase, which is found in bacterial plasma
membranes, in mitochondrial inner membranes, and in chloroplast thylakoid membranes. Its major function is to use the proton gradient to drive ATP synthesis by allowing the protons flux across the membrane down their electrochemical gradient.
The produced energy is then used to support cell functions. The Fo domain is integral in
the membrane to insure the proton transport across the membrane, whereas the F1
domain is peripheral and contains the enzyme catalytic sites. FoF1 ATP synthase of
Saccharomyces cerevisiae is the central subject of our study. Its structure, function and
catalytic mechanism will be described in following paragraphs.
V‐ATPase is called vacuolar‐type H+‐ATPase, which is one of the most fundamental enzymes found in almost every eukaryotic cell. V‐ATPase functions as ATP‐dependent proton pump. It couples the energy of ATP hydrolysis to proton transport across intracellular and plasma membranes of eukaryotic cells. It plays a variety of roles for the function of many organelles (Nelson et al, 2000).
A‐ATPase is called AoA1 ATPase. It is found exclusively in Archaea and has a
similar function to F‐ATPase. But structurally, it is closer to V‐ATPase. This type of ATPases may have arisen as an adaptation to the different cellular needs and the more extreme environmental conditions faced by Archaeal species (Bickel‐Sandkötter et al, 1998).
P‐ATPase is also known as E1‐E2 ATPase. They are found in bacteria and in a number of eukaryotic plasma membranes and organelles. And they function to transport a variety of different compounds, including many ions and phospholipids, across a membrane using ATP hydrolysis for energy. There are many different classes of P‐ATPases, each of which transports a specific type of ion (Axelsen & Palmgren, 1998). In addition, they all appear to interconvert between at least two different conformations, denoted by E1 and E2. During their ion transport cycle, P‐ATPases form phosphorylated intermediate state, which is the distinction from other classes of ATPases (Bublitz et al, 2011).
E‐ATPase is a type of membrane‐bound cell surface enzymes. E stands for “Extracellular”. These ATPases are found in most eukaryotic cells and hydrolyse nucleotide tri‐ and/or diphosphates in the presence of Ca2+ or Mg2+ (Plesner, 1995). And they play important roles in many biological processes.
F‐, V‐ and A‐ATPases are multi‐subunit complexes with a similar architecture, which is one membrane embedded part and one soluble catalytic part. And they
possibly use the rotary motors to achieve catalytic mechanism and ions transport. Details will be described in FoF1 ATP synthase structures. The P‐ATPases are quite
distinct in their subunit composition and in the ions they transport, and they do not appear to use a rotary motor.
1.2.2. Structures of FoF1 ATP synthase
In order to better understand the catalytic mechanism of this large protein complex ATP synthase, it is necessary to start with its structure. The common global structure shared by various ATP synthases is composed of two linked complexes: the soluble catalytic core F1 ATPase complex and the membrane‐embedded proton
channel Fo complex. Electron microscopic images in figure 4 show the similarity of the
global structure of ATP synthases from chloroplast, bacteria and mitochondria. Although FoF1 ATP synthases from different organisms share a common general
structure, the nomenclature of different subunits are sometimes different, especially in the case of Fo sector. Thus, different ATP synthases with their compositions of
subunits as well as the nomenclature are presented in table 1.
a b c
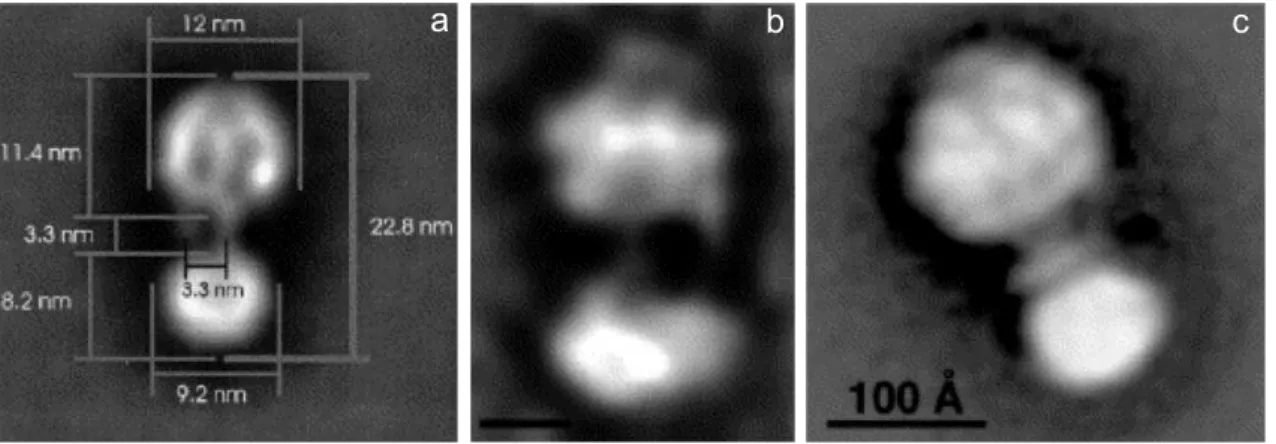
Figure 4. Electron microscopic images of ATP synthase from various organisms.
The images were obtained by averaging negatively stained single particles images. a) chloroplast ATP synthase (Bottcher et al, 1998); b) E. coli ATP synthase (Wilkens & Capaldi, 1998); c) bovine mitochondrial ATP synthase (Karrasch & Walker, 1999).
Figure 5. Simplified representation of yeast FoF1 ATP synthase structure (according to the thesis of
Vincent Corvest, 2006).
Figure 5 is a simplified image representing yeast FoF1 ATP synthase architecture,
with its Fo and F1 sectors coloured in pink and blue respectively. In addition, since the
enzyme functions with a rotary mechanism, we could also distinguish the mobile part as the rotor (hatched part in figure 5), and the fixed part as the stator (figure 5). It will be described later in the following paragraphs.
Table 1. Nomenclature of subunits from FoF1 ATP synthase in bacterial, chloroplast and mitochondrial
ATP synthases.
The name and the stoichiometry of each subunit are indicated in this table. The composition of both subcomplex Fo and F1 are as well indicated. In addition, proteins associated to Fo sector and proteins function as ATP synthase regulators are listed.
1.2.2.1. Fo sector
Fo sector is the membrane‐embedded FoF1 ATP synthase subcomplex, which is
1, this Fo sector consists of eight subunits (OSCP, 4, d, h, 9, 6, 8 and f, nomenclature of
yeast) in mitochondrial ATP synthases. In the case of yeast, there are four other subunits associated to Fo, e, g, k and i; in the case of bovine, the associated proteins
are e and g. For bacteria and chloroplast, the Fo sector simply has subunits a, b and c,
which are equivalent of mitochondrial 6, 4 and 9.
a
b
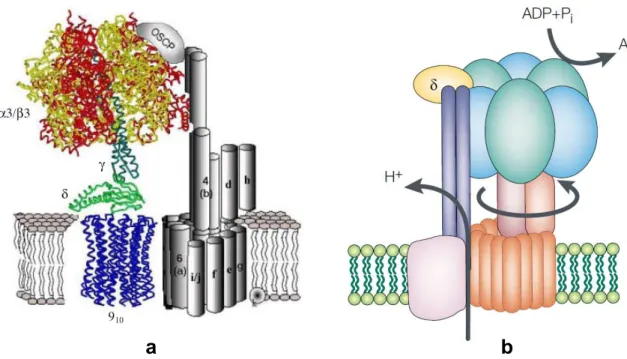
Figure 6. Models of FoF1 ATP synthases representing Saccharomyces cerevisiae mitochondrial ATP
synthase and Escherichia coli ATP synthase.
Panel a, topological model of Saccharomyces cerevisiae mitochondrial ATP synthase Fo sector, with partially reconstructed protein structure (Stock et al, 1999) (thesis of Rémy Fronzes, 2004). Panel b, the bacterial ATP synthase is illustrated as the simplest version of ATP synthases (Yoshida et al, 2001).
OSCP is the short form of Oligomycin Sensitivity Conferring Protein in mitochondrial ATP synthase, which is called δ subunit for bacterial and chloroplast ATP synthases. It appears to be part of the peripheral stalk that holds the F1 subcomplex
α3β3 catalytic core stationary against the torque of the rotating central stalk.
Subunit 4 links the F1 subcomplex to Fo membranous part via the OSCP and
related membranous proteins. Similar with OSCP, subunit 4 also stabilize the α3β3
Subunit 6 (analogue of subunit a in E. coli) cooperates with subunit 9 to form the proton translocation pathway through the four indispensable residues Glu196, Arg210,
Glu219 and His245 (numbering in E. coli, also shown in figure 7) that form the two half‐
channels. In the basic structure of E. coli, it is proposed that this subunit consists of five or six transmembrane segments (Jager et al, 1998; Long et al, 1998; Vik et al, 2000). Subunit 9 (analogue of subunit c in bacteria, chloroplast and bovine) functions as the membranous rotor of ATP synthase. Ten subunits 9 (the stoichiometry varies from 8 to 15 among different organisms) (Dimroth et al, 2006; Meier et al, 2006; Meier et al, 2007; Pogoryelov et al, 2007; Toei et al, 2007; Watt et al, 2010) form an oligomeric ring that makes up the Fo rotor (Jiang et al, 2001; Stock et al, 1999). The earlier NMR study of bacterial single copy subunit c showed a stoichiometry of twelve (Rastogi & Girvin, 1999) (see figure 7). Later on, the size of bacterial c‐ring was suggested to be ten (Ballhausen et al, 2009; Fillingame & Dmitriev, 2002; Fillingame et al, 2000). The flux of protons through the proton translocation channels drives the rotation of the c ring, which in turn is coupled to the rotation of the F1 subcomplex γ subunit rotor due to the
permanent binding between the γ and ε subunits of F1 and the c ring of Fo. The residue
Asp61 in E.coli (figure 7) (glutamate for other organisms) is essentially implicated in the
proton translocation (described in paragraph 1.2.3.3 proton translocation).
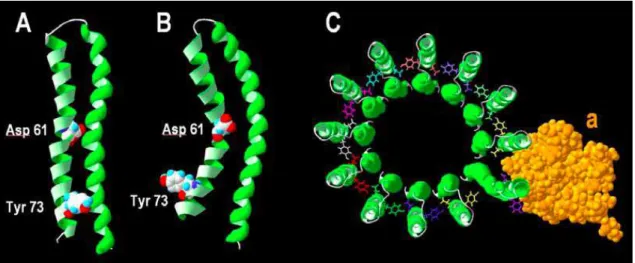
Figure 7. 3D structure of E. coli subunit c monomer determined by NMR, and representation of E. coli subunits a‐c12. Panel A, side view of protonated subunit c monomer, at pH5 (pdb file, 1c0v) (Girvin et al, 1998). Panel B, side view of deprotonated subunit c monomer, at pH8 (pdb file, 1c99) (Rastogi & Girvin, 1999). Panel C, representation of duodenary oligomer of subunit c (green) with subunit a (orange) (pdb file, 1c17) (Rastogi & Girvin, 1999).
Subunit 8 is essential for the Fo subcomplex assembly (Devenish et al, 2000;
Marzuki et al, 1989). But its function is not yet very clear.
Subunit d is important for the ATP synthase function. It is a hydrophilic protein, and associated to subunits 4, h and OSCP (Norais et al, 1991).
Subunit f is required for the assembly of subunits 6, 8 and 9. (Spannagel et al, 1997).
1.2.2.2. F1 sector
F1 sector is the soluble part of the ATP synthase, which contains the catalytic
core of the enzyme. This subcomplex has been well studied in various organisms. F1
sector of ATP synthase could generate ATP synthesis as well as ATP hydrolysis when it is attached to Fo part, whereas the isolated F1 could only hydrolyze ATP. So it is also
and inorganic phosphate through its F1 sector en presence of the proton gradient
across the membrane generated by electron transport chain. When the membrane could not generate the proton gradient or the F1‐ATPase becomes soluble detached
from the Fo part, F1‐ATPase would function in the direction of ATP hydrolysis. Many
studies have been done to determine the structure of F1‐ATPase, such as bacterial F1‐
ATPase from E. coli (Cingolani & Duncan, 2011; Hausrath et al, 1999; Rodgers & Wilce, 2000), chloroplast F1‐ATPase from spinach (Groth & Pohl, 2001), and mitochondrial F1‐
ATPase from beef heart (Abrahams et al, 1994), rat liver (Bianchet et al, 1998), and also from yeast S. cerevisiae (Kabaleeswaran et al, 2006; Kabaleeswaran et al, 2009). The common structure of F1‐ATPase shared by many organisms contains five subunits, α, β, γ, δ and ε, with the stoichiometry of 3, 3, 1, 1 and 1 respectively (Walker et al, 1985) (see table 1 and figure 8). a ε δ γ β α b Figure 8. Structure of F1‐ATPase from Saccharomyces cerevisiae.
Panel a, globle view of X‐ray crystal structure F1‐ATPase from Saccharomyces cerevisiae. Panel b, separated presentation of α, β, γ, δ and ε subunits (Kabaleeswaran et al, 2006). The presented α and β subunits correspond to αDP and βDP. Images created using PyMol software, with pdb file 2hld.
α and β subunits form the catalytic core of the F1 subcomplex with three copies
of each. There is a substrate‐binding site on each of the αβ interface, which is the binding site in each αβ catalytic interface and αβ non‐catalytic interface. The α3β3
complex forms a cylinder that surrounds the central stalk. The three pairs of α/β subunits undergo a sequence of conformational changes leading to ATP synthesis (or hydrolysis), which are induced by the rotation of γ subunit.
γ subunit forms the central shaft that connects the Fo rotary motor to the F1
catalytic core. It sequentially deforms the α3β3 catalytic core by a rotary activity
transmitted from the membrane‐embedded rotor of subunit 9. Its two terminal extremities are inserted into the catalytic core, and its midpart forms the “foot of gamma” (name frequently used in this work, referring residues around 80‐180 in yeast).
δ subunit contributes to the assembly of the protein rotor by the connection of γ subunit and subunit 9 (Watts et al, 1995). But the mitochondrial δ subunit does not play a role during enzyme catalytic activity. It is analogue of bacterial or chloroplast ε subunit.
ε subunit only exists in mitochondrial ATP synthases. It is observed that yeast depleted of this subunit could not grow in fermentative medium (Guelin et al, 1993). Other experiments demonstrated the essential role of subunit ε in the assembly of F1 and the incorporation of hydrophobic subunit c into the F1‐c oligomer rotor structure of mitochondrial ATP synthase in higher eukaryotes (Havlickova et al, 2010). 1.2.2.3. FoF1 complex
Using single particle electron cryomicroscopy, the complete view of bovine (Baker et al, 2012; Rubinstein et al, 2003) and yeast (Lau et al, 2008) FoF1 ATP synthase
has been observed. None of the entire protein complex structure has been resolved either by X‐ray crystallography or by NMR. Nevertheless, the protein assembly of F1
model of yeast F1c10‐ATP synthase was resolved at 3.9 Å. The visualization of the c ring
and its close contact with γ and δ subunits suggested that they might rotate as an ensemble during catalysis (Stock et al, 1999). Then the yeast F1c10‐ATP synthase was
revealed by the recent work of at 3.43 Å, which was the first model of MgADP‐ inhibited state of the yeast enzyme (Dautant et al, 2010). Compared to bovine enzyme that has eight copies of c subunit (Watt et al, 2010), the yeast central stalk was twisted (see figure 9). Besides, isolated partial peripheral stalk has also been resolved (Dickson et al, 2006). To date, the structure of the membranous subunit a (or subunit 6) as well as the entire complex still remain unclear, which requires more research.
a
b
Figure 9. X‐ray crystal structures of yeast and bovine F1c10‐ATP synthase.Panel a, structure of yeast F1c10‐ATP synthase (Dautant et al, 2010); Panel b, structure of bovine F1c8‐ATP synthase (Watt et al, 2010).
1.2.2.4. Supramolecular organization of FoF1‐ATP synthase
For many organisms including yeast, plant and mammals, mitochondrial ATP synthase has been shown to adopt oligomeric structures (Arnold et al, 1998; Eubel et al, 2003; Krause et al, 2005). In yeast mitochondria, it has been demonstrated that ATP synthase subunits e and g are involved in the dimerization and oligomerization (Arnold et al, 1998; Paumard et al, 2002; Thomas et al, 2008). This oligomerization of ATP synthase has been suggested to determine the arrangement of mitochondrial cristae (Arselin et al, 2004; Paumard et al, 2002), which is the basis of mitochondrial mophology. An exemple of yeast dimeric ATP synthase observation using electron microscopy is shown in figure 10. Althrough the oligomerization of ATP synthase is shown to play an important role in the network of cristae during mitochondrial biogenesis, no evidence has been shown that the ATP synthase oligomerization has any effect on the enzyme functions. Figure 10. Observation of dimeric yeast mitochondrial ATP synthase by electron microscopy (Thomas et al, 2008). Averaged images represent six classes in which dimers exhibit various angle between two monomers. 1.2.3. FoF1 ATP synthase: A molecular rotary motor 1.2.3.1. Visualization of the rotation
The first direct visualization of Bacillus PS3 F1 rotation driven by ATP was
obtained sixteen years ago (Noji et al, 1997). In that experiment, bacterial subcomplex α3β3γ was immobilized on a glass surface covered by Ni‐NTA via the N‐terminal
extremity of its β‐subunits. The γ subunit was biotinylated to bind streptavindin and a fluorescently labeled actin filament, which rotated uni‐directionally, counterclockwise (view from membrane side) after ATP addition (figure 11). Figure 11. First direct observation of the γ subunit rotation in the α3β3γ subcomplex (Noji et al, 1997).
The rotary motor model was confirmed in 1999 by another observation of c subunit (equivalent to subunit 9 in Sccahromyces cerevisiae) of FoF1 ATP synthase
rotation (Sambongi et al, 1999). In this model (figure 12), Escherichia coli FoF1 was
immobilized on a coverslip through a His‐tag linked to the N‐terminus of each α subunit. A c subunit glutamine was replaced by cysteine and then biotinylated to bind streptavindin and a fluorescently labeled actin filament. After the addition of MgATP, the actin filament that was connected to the c subunits rotated. Figure 12. Observation of the c subunit rotation in F1‐ATPase of E. coli (Sambongi et al, 1999).
Later on, several similar experiments were carried out to show the rotation of ATP synthase more precisely, such as different steps of rotation by 120° (Yasuda et al, 1998), which corresponds to the sequential ATP hydrolysis by the three β subunits. In order to detect the stepwise rotation, a smaller marker, a colloidal gold bead of 40 nm diameter was used to replace actin (Yasuda et al, 2001). PS3 subcomplex α3β3γ was
immobilized and its γ subunit was attached by the gold bead (figure 13). It was shown that one 120° rotation step consisted of roughly 90° and 30° substeps, which were suggested to be related to ATP binding and hydrolysis product (ADP, phosphate, or both) release respectively.
Figure 13. Observation of Bacillus PS3 F1‐ATPase stepwise rotation (Yasuda et al, 2001).
More recently, the observation of the rotation was performed with a more sophisticated technique that visualized rotation by attaching a bead duplex to the γ shaft and simultaneously detected binding of a fluorescent ATP analog to a particular site through angle‐resolved fluorescence imaging (Nishizaka et al, 2004) (figure 14). This work showed that the 120° rotary step were more likely subdivided into an 80° and a 40° substeps. In particular, this 80° substep was linked to the binding of one ATP molecule to one empty site, triggering the ATP hydrolysis and/or the phosphate release but not ADP release.
Figure 14. Simultaneous observation system of Bacillus PS3 F1‐ATPase rotation and ATP binding
(Nishizaka et al, 2004).
Simultaneous‐observation system (not to scale). Single turnovers of ATP hydrolysis on catalytic sites in F1‐ATPase are visualized with fluorescently labeled ATP (Cy3‐ATP), which is excited by an evanescent wave under total internal reflection fluorescence microscopy. Cy3‐ATP appears as a stable fluorescent spot when it binds to a surface‐immobilized F1 molecule and the spot disappears when ADP is released, whereas unbound Cy3‐ATP is virtually invisible because of its rapid Brownian motion. Rotation of a bead duplex attached to the γ shaft is simultaneously observed under bright‐field illumination at a wavelength different from the emission of Cy3‐ATP.
Stepwise γ rotation has also been proved by single‐molecule FRET (fluorescence resonance energy transfer). In the study of Diez and co‐workers, the double‐labeled E.
coli FoF1 ATP synthase was incorporated into liposomes. And it was demonstrated that
γ subunit rotated during ATP synthesis powered by proton transport, showing three distinct distances to b subunits in repeating sequences (Diez et al, 2004). More recently, a splendid work using high‐speed atomic force microscopy revealed rotary catalysis of rotorless F1‐ATPase. In this work, isolated α3β3 stator ring was shown to
cyclically propagate conformational states in the counterclockwise direction, similar to rotary shaft rotation in F1‐ATPase. It suggested the cooperative interplay between
subunits in hexameric ATPases (Uchihashi et al, 2011).
All those studies as well as some other brilliant work demonstrated the rotary mechanism of FoF1 ATP synthase in precising the substeps of the rotation and the
relative sequence of substrate binding, ATP hydrolysis and product release. In the following paragraph, I am going to introduce the rotor and stator of ATP synthase.
1.2.3.2. Rotor and stator
The rotor refers to the mobile part of the molecular motor, which is to say the subunit 9 (or c), the central axis formed by subunits γ, δ and ε in mitochondrial case, γ and ε in bacterial and chloroplast cases (see figure 5).
The rotary activity is initiated by the protomotive force which triggers the rotation of subunit 9 by the proton translocation. This rotary movement will then transmit to the asymmetric central axis (γ, δ, ε subunits or γ, ε subunits), which then deform the three catalytic sites located in β subunits, sequentially. The conformational change of the catalytic sites generates the ATP synthesis from ADP and inorganic phosphate. The transformation of chemiosmotic energy to mechanical energy is the key point of ATP synthesis, which makes the subunit 9 essential by its contribution of energetic coupling between Fo and F1 sectors.
The central axis γ subunit is essential not only for the protein complex assembly but also for the rotary procedure owing to its contact with the membrane rotor subunit 9 and asymmetric structure interacting with F1 catalytic subunits. It plays the
important role of coupling energy between the rotor and the stator.
The stator is the immobile part of FoF1 ATP synthase. It contains three pairs of
α/β subunits and all the subunits in Fo sector except the c‐ring (subunit 9). The crown‐
like α3β3 subunits are fixed by the peripheral stalk, subunits 4, 6 and OSCP through the
contact with OSCP (see figure 5). And the α3β3 subunits catalyse ATP synthesis or
hydrolysis. The subunit 6 contributes to the proton translocation (Fillingame et al, 2002) (see figure 5‐6).
1.2.3.3. Proton translocation
The proton translocation initiates the rotation of ATP synthase. This activity requires the cooperation of the subunits 6 and 9 in yeast (a and c in E. coli, respectively). Since these two subunits are coded by the mitochondrial genes, it is difficult to perform genetic modifications. Moreover, the fact that the protein
structures of the membrane‐embedded subunits a and b are not yet clear adds more inconvenience of the study. Most of the studies about proton translocation were realized using the bacterial ATP synthase as model. The classic mechanism of proton translocation in bacterial subunits a and c was proposed (Junge et al, 1997; Vik & Antonio, 1994; Vik et al, 2000), and it could be adapted for mitochondrial and sodium‐ driven bacterial ATP synthases (figure 15). a b Figure 15. Models for the generation of rotation by proton transport through the Fo domain of bacterial ATP synthase. Panel a, model according to (Junge et al, 1997). Panel b, model according to (Vik et al, 2000).
It is shown that several properties are required for the proton translocation function of ATP synthase. Firstly, an electrostatical constraint implies that protonated sites (Asp61) on the c‐ring are always electroneutral when facing the lipid core,
whereas their facing the protein (a subunit) can be deprotonated and charged. Secondly, the intramembranous a subunit contains two hypothetical half‐channels that allow passage of protons through the membrane. The two accessible channels refer to: the first one that extends from the cytoplasmic surface to the center of the membrane