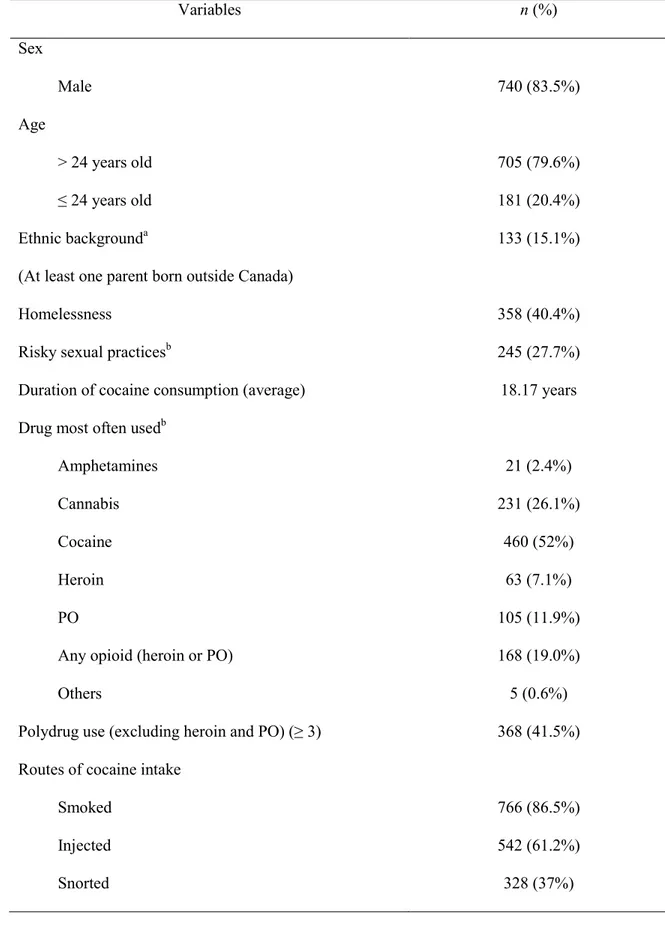
Table 1 Sample description (n = 886).
Variables
n (%)
Sex
Male
740 (83.5%)
Age
> 24 years old
705 (79.6%)
≤ 24 years old
181 (20.4%)
Ethnic background
a(At least one parent born outside Canada)
133 (15.1%)
Homelessness
358 (40.4%)
Risky sexual practices
b245 (27.7%)
Duration of cocaine consumption (average)
18.17 years
Drug most often used
bAmphetamines
21 (2.4%)
Cannabis
231 (26.1%)
Cocaine
460 (52%)
Heroin
63 (7.1%)
PO
105 (11.9%)
Any opioid (heroin or PO)
168 (19.0%)
Others
5 (0.6%)
Polydrug use (excluding heroin and PO) (≥ 3)
368 (41.5%)
Routes of cocaine intake
Smoked
766 (86.5%)
Injected
542 (61.2%)
Opioid used (last month)
464 (52.4%)
PO
357 (40.3%)
Injected
305 (34.4%)
Not injected
87 (9.8%)
Heroin
322 (36.3%)
Injected
290 (32.7%)
Not injected
63 (7.1%)
Speedball
102 (11.5%)
a 5 missing values. b 1 missing value.Table 2
Probabilities of substance use and routes of administration by class membership. Substance used
in the past month
Classes Class 1 Cocaine Smokers (CS) (n = 161) Class 2
Cocaine Sniffers/ Smokers (CSS) (n = 201) Class 3 Cocaine Injectors (CI) (n = 207) Class 4 Cocaine-Opioid Injectors (COI) (n = 277) Class5 Cocaine-Opioid Poly-routes (COP) (n=40) Overall (n = 886) Membership probabilities 0.183 0.218 0.231 0.291 0.077 1 Conditional probabilities Injected cocaine 0.000 0.268 1.000 0.906 0.761 0.612 Smoked cocaine 1.000 0.872 0.675 0.893 0.983 0.865 Snorted cocaine 0.000 1.000 0.119 0.272 0.596 0.370 Injected heroin (including speedball) 0.032 0.036 0.291 0.672 0.818 0.340 Non-injected heroina 0.073 0.058 0.011 0.000 0.553 0.071 Injected Pos 0.016 0.024 0.000 1.000 0.589 0.344 Non-injected POsb 0.081 0.121 0.039 0.092 0.274 0.098
a Refers to either sniffed or smoked heroin.
b Refers to either snorted, eaten, drank, or smoked PO.
Table 3
Descriptive statistics for sociodemographic and behavioural characteristics for each cocaine users subgroups.
Class 1 Class 2 Class 3 Class 4 Class 5 Comparisons
across subgroups Cocaine Smokers (CS) (n=161) Cocaine Sniffers/Smokers (CSS) (n=201) Cocaine Injectors (CI) (n=207) Cocaine-Opioid Injectors (COI) (n=277) Cocaine-Opioid Poly-routes (COP) (n=40) Overall p-value* n % % n % n % n % Sex Male 137 85.1% 172 85.6% 172 83.3% 226 81.6% 33 82.5% 0.788
Age > 24 years old 121 75.2% 123 61.2% 191 92.3% 237 85.6% 33 82.5% <0.001
≤ 24 years old 40 24.8% 78 38.8% 16 7.7% 40 14.4% 7 17.5% Ethnic backgrounda Outside Canada 29 18.2% 44 21.9% 21 10.2% 30 10.9% 9 22.5% 0.001 Homelessness Yes 66 41.0% 80 39.8% 62 30.0% 131 47.3% 19 47.5% 0.003 Duration of cocaine consumption (continuous)
17.17 years 14.99 years 21.83 years 18.22 years 18.80 years <0.001
Polydrug use (≥ 3)
Yes 55 34.2% 109 54.2% 37 17.9% 139 50.2% 28 70.0% <0.001
practicesb Principal route of cocaine intake Injecting 0 0% 28 13.9% 143 69.1% 156 56.3% 13 32.5% <0.001 Smoking 161 100.0% 126 62.7% 61 29.5% 115 41.5% 22 55.0% Snorting 0 0% 47 23.4% 3 1.4% 6 2.2% 5 12.5% Drug used (last month) Heroin 18 11.2% 16 8.0% 63 30.4% 185 66.8% 40 100% <0.001 PO 13 8.1% 29 14.4% 9 4.3% 277 100% 29 72.5% <0.001 Speedball 0 0% 0 0% 19 9.2% 68 24.5% 15 37.5% <0.001 Any opioid 29 18.0% 43 21.4% 75 36.2% 277 100% 40 100% <0.001 Drug most frequently usedc Amphetamines 4 2.5% 13 6.5% 1 0.5% 2 0.7% 1 2.5% NA Cannabis 58 36.0% 83 41.3% 36 17.4% 42 15.2% 12 30.0% Cocaine 96 59.6% 101 50.2% 145 70.0% 102 37.0% 16 40.0% Heroin 3 1.9% 2 1.0% 21 10.1% 33 12.0% 4 10.0% PO 0 0% 2 1.0% 2 1.0% 95 34.4% 6 15.0% Any opioid 3 1.9% 4 2.0% 23 11.1% 128 46.4% 10 25.0% Others 0 0% 0 0% 2 1.0% 2 0.7% 1 2.5% Total 161 100% 201 100% 207 100% 276 100% 40 100% a = 5 missing values. b = 1 missing value. c = 1 missing value.
Table 4
Adjusted odds ratio (AOR) and 95% confidence intervals (CI) of LCA cocaine users subgroups (n = 886). Multinomial logistic regression
AOR (95% CI)
CS vs. COI CSS vs. COI CI vs. COI COP vs. COI
Age (>24 year) 0.35 (0.18-0.67)** 0.20 (0.11-0.36)*** 0.69 (0.33-1.44) 0.64 (0.21-1.96) Homeless 0.74 (0.49-1.12) 0.62 (0.42-0.91)* 0.54 (0.36-0.80)** 0.98 (0.50-1.94) Ethnic background (not Canada) 1.79 (1.02-3.16)* 2.06 (1.22-3.50)** 1.026 (0.55-1.90) 2.52 (1.07-5.92)* Polydrug use (without PO and
heroin ) ≥ 3
0.41 (0.27-0.64)*** 0.89 (0.60-1.32) 0.23 (0.15-0.36)*** 2.41 (1.15-5.02)*
Risky sexual practices 1.89 (1.20-2.97)** 1.81 (1.19-2.78)** 1.34 (0.85-2.11) 0.99 (0.45-2.18) Duration of cocaine consumption 1.01 (0.98-1.04) 1.01 (0.99-1.04) 1.04 (1.02-1.07)** 1.03 (0.99-1.08) * p ≤ 0.05.
** p ≤ 0.01. *** p ≤ 0.001.